
CMBA - Connecticut Motorsports Business Association
Executive Summary
Introduction
The Connecticut Motorsports Business Association is a nonprofit trade association of motorsports businesses in Connecticut and other interested parties. CMBA works to enhance and improve the motorsports business climate in Connecticut by promoting the sport to the general public, protecting the rights of motorsports businesses, and assisting businesses to improve their sales and profits.
The Organization
CMBA was founded in 1974 as the Connecticut Motorcycle Dealers Association. In 1992 the association expanded to allow motorcycle accessory shops full participation in the Association. The name was changed in 1995 to the Connecticut Motorsports Business Association in recognition of the other motorsports products, such as personal watercraft and ski mobiles, that our members sell and service.
Our management team consists of the board of directors and officers of CMBA working closely with the executive director. In addition, a professional lobbyist is employed to keep us appraised of legislative activities and to help us affect desired outcomes. Ultimately the work will be divided among committees and the executive director may need to add staff to the Association management team.
Services
CMBA provides a variety of services to motorsport businesses including the scheduling and coordination of a number of activities and events. These include monthly dinner meetings for information sharing, a spring motorcycle show, the winter conference and seminars, an annual Awards Banquet, and an annual Connecticut SuperRide.
In addition we provide direct services to motorsport businesses that include professional lobbyist services to represent our members with government agencies, communications in the form of a monthly newsletter and regular monthly meetings as well as special bulletins, and group benefits such as coordinating our members’ dealings with insurance companies and distributors for rates and discounts.
Among the services planned for the future are: a group insurance medical plan for all members, a group buying plan, bringing the CMBA members onto the Internet for consumer sales and inter-member product distribution, a permanent rider education facility, and the development of a Connecticut Motorsport Park.
The Market
Research shows that the motorcycle industry has been growing for the past seven years. This includes all types of motorcycles. Today’s retail sales produce more than 3.5 times the dollars produced in 1983. In addition, Powersports research stated that “56% of motorsports customers turn to their friendly neighborhood dealer for all of their routine service work.” This creates a market with tremendous opportunities for small, local businesses if they can get the right tools to take advantage of the possibilities. For the most part, our potential members are very small businesses with limited resources for training and marketing. We can help them improve their earnings and increase the value of their investments with sales and management training and well as marketing information and marketing aids.
There are more than 100 businesses in Connecticut involved with motorsports. In addition, there are potential associate members outside the state, such as manufacturers, distributors, insurance companies, and others who service and sell to our members.
Since CMBA’s goal is to bring together all interested parties in the motorsport industry, the company plans to have a broad target market with management focusing on franchised dealers, independent accessory and repair outlets, insurance companies, distributors/manufacturers, and other interested parties.
Financial Considerations
Our main strategy is the growth of membership. A large membership base provides revenue from dues and also positions CMBA as the true representative of the Connecticut motorsports industry.
We want to finance growth solely through cash flow. We recognize that this means we will have to grow more slowly than we might like but that no assessment of members or borrowing is necessary.
Our funding on membership and other services is expected to increase from more than $195,000 the first year to more than $263,000 the third. Net surplus is estimated to rise slowly but steadily over the next three years. Cash flow is expected to remain healthy. We plan to apply any surplus to legislative activities, marketing activities, or hold it for contingencies.

1.1 Objectives
- Fifty members for Year 1 and sixty members for Year 2.
- Net annual income greater than $60,000 to support full-time staff and expenses.
1.2 Mission
The Connecticut Motorsports Business Association is a trade association of motorsports businesses in Connecticut and other interested parties. CMBA works to enhance and improve the motorsports business climate in Connecticut. It is a recognized and respected representative and proponent of the motorsports industry.
1.3 Keys to Success
- Long-standing trade association for Connecticut motorsports businesses… more than 25 years old.
- One of the few state motorsports organizations with a paid executive director/association management firm.
- Connecticut is a small state and allows for convenient member visits and meetings.
Organization Summary
The CMBA has been Connecticut’s only trade association for motorcycle and motorsports businesses since 1974. Our focus is on improving and enhancing the motorsport business climate in Connecticut by:
- Promoting motorsports to the general public,
- Protecting the rights of motorsports businesses, and
- Assisting motorsports businesses to improve their sales and profits.
2.1 Legal Entity
The Connecticut Motorsports Business Association, Inc. is a Connecticut nonprofit corporation.
2.2 Organization History
CMBA was founded in 1974 as the Connecticut Motorcycle Dealers Association. In 1992 the name was changed to the Connecticut Motorcycle Business Association to allow motorcycle accessory shops full participation in the Association. The name was changed again in 1995 to the Connecticut Motorsports Business Association in recognition of the other motorsports products, such as personal watercraft and ski mobiles, that our members sell and service.

| Past Performance | |||
| FY 1997 | FY 1998 | FY 1999 | |
| Funding | $18,000 | $20,000 | $20,780 |
| Gross Surplus | $3,000 | $5,000 | ($631) |
| Gross Surplus % | 16.67% | 25.00% | -3.04% |
| Operating Expenses | $50 | $50 | $50 |
| Balance Sheet | |||
| FY 1997 | FY 1998 | FY 1999 | |
| Current Assets | |||
| Cash | $11,000 | $17,000 | $12,000 |
| Other Current Assets | $0 | $0 | $0 |
| Total Current Assets | $11,000 | $17,000 | $12,000 |
| Long-term Assets | |||
| Long-term Assets | $0 | $0 | $0 |
| Accumulated Depreciation | $0 | $0 | $0 |
| Total Long-term Assets | $0 | $0 | $0 |
| Total Assets | $11,000 | $17,000 | $12,000 |
| Current Liabilities | |||
| Accounts Payable | $0 | $0 | $0 |
| Current Borrowing | $0 | $0 | $0 |
| Other Current Liabilities (interest free) | $0 | $0 | $0 |
| Total Current Liabilities | $0 | $0 | $0 |
| Long-term Liabilities | $0 | $0 | $0 |
| Total Liabilities | $0 | $0 | $0 |
| Paid-in Capital | $0 | $0 | $0 |
| Retained Earnings | $11,000 | $17,000 | $12,000 |
| Earnings | $0 | $0 | $0 |
| Total Capital | $11,000 | $17,000 | $12,000 |
| Total Capital and Liabilities | $11,000 | $17,000 | $12,000 |
| Other Inputs | |||
| Payment Days | 0 | 0 | 0 |
2.3 Locations and Facilities
Since its inception, the CMBA’s office has been that of its president. Since the mid-1990’s, however, a paid executive director/association management firm has provided housing for the CMBA’s office. At this time we have a modest website and are planning a phone line separate from that of the executive director.
Services
Activities and events:
- Monthly dinner meetings for information sharing.
- Lobbying and legislative services.
- Annual awards banquet.
- Spring motorcycle show.
- Winter conference and seminars.
- Annual Connecticut SuperRide.
- Permanent rider education facility.
- Connecticut Motorsports Park.
3.1 Service Description
- Government: CMBA employs a professional lobbyist to represent our members with government agencies and the legislature.
- Communications: We distribute a monthly newsletter and hold regular monthly meetings as well as special bulletins and events to share information with and among our members.
- Group Benefits: We coordinate our members’ dealings with insurance companies and distributors for rates and discounts.
- Retail Marketing: We produce events and advertising campaigns to promote the motorsports industry in Connecticut.
- Training: We conduct seminars and workshops to improve our members’ businesses.
3.2 Alternative Providers
While there are no direct competitors, there are other organizations that may solicit our members and prospects.
- CBIA. Connecticut Business and Industry Association offers group insurance and other benefits to small businesses.
- CATA. Connecticut Auto Trades Association offers benefits to firms selling motor vehicles.
- CMTA. Connecticut Marine Trades Association offer benefits to firms selling watercraft.
- Chambers of Commerce offer incentives to businesses in their local market.
- National organizations (dealer groups, Lemco Twenty Clubs) offer benefits.
3.3 Printed Collaterals
The management team will develop an organization brochure to explain the benefits of membership to prospective members and associate members.

3.4 Fulfillment
- The full-time executive director will personally visit every business in the state that is involved with motorsports, or otherwise interested in our goals and objectives, to solicit their membership in the Association. In addition, he will contact businesses outside the state that are potential Associate members.
- The director and staff will coordinate and produce the events and activities that will produce the revenue to operate the Association as well as provide the services for our members.
3.5 Technology
The executive director and the Association management team will maintain Windows and Mac capabilities including:
- Complete email facilities on the Internet for working with members directly through email and website delivery of information.
- Complete desktop publishing facilities for delivery of reports, announcements, news, and information.
- Telephone and fax facilities, including a toll-free hot-line for members and consumers.
3.6 Future Services
Among the services planned for the future are:
- A group insurance medical plan for all members.
- A group buying plan for all members.
- Bringing the CMBA members onto the Internet for consumer sales and inter-member product distribution.
- A permanent rider education facility.
- A Connecticut Motorsport Park.
Market Analysis Summary
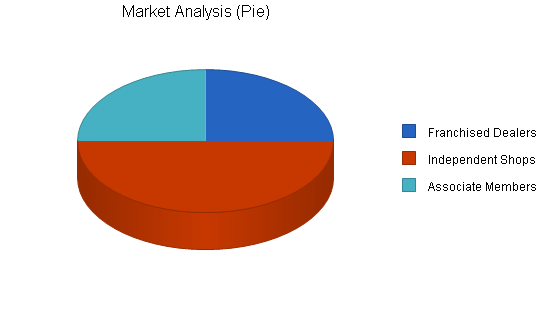
There are more than 100 businesses in Connecticut involved with motorsports; from franchised dealers and independent accessory shops, repair facilities, and used vehicle dealers to insurance agencies, distributors, manufacturers, and other interested parties. In addition, there are potential associate members outside the state, such as manufacturers, distributors, insurance companies, and others who service and sell to our members.
4.1 Market Segmentation
- Franchised dealers.
- Independent accessory, repair, used motorcycle, parts stores.
- Insurance companies and agencies.
- Distributors and manufacturers.
- Other interested parties.
| Market Analysis | |||||||
| 1999 | 2000 | 2001 | 2002 | 2003 | |||
| Potential Customers | Growth | CAGR | |||||
| Franchised Dealers | -10% | 25 | 23 | 21 | 19 | 17 | -9.19% |
| Independent Shops | 0% | 50 | 50 | 50 | 50 | 50 | 0.00% |
| Associate Members | 20% | 25 | 30 | 36 | 43 | 52 | 20.09% |
| Total | 4.44% | 100 | 103 | 107 | 112 | 119 | 4.44% |
4.2 Target Market Segment Strategy
Past experience has shown that most businesses in our industry will not join this association of their own accord. Instead, we must mount an aggressive membership drive.
NOTE: The number of franchised dealers is shrinking by mergers and acquisitions. Future growth of membership will require attracting the independent shops.
4.2.1 Market Trends
One important trend is the hectic nature of our lives combined with increasing competitiveness in the marketplace, not just from our own industry, but from a wide range of products and services targeting our customers’ dollars. In addition, mail order and Internet marketers also erode our market share.
A more positive trend is that new motorcycle and other powersports equipment sales seem to be increasing. Consumer confidence is up and so is consumer spending.
4.2.2 Market Growth
According to the D.J. Brown Composite Index in Dealernews magazine, the motorcycle industry is celebrating its seventh straight year of expansion. And it’s not just cruisers and sportbikes, the report continues, it’s also touring bikes and dirtbikes. Street motorcycles, including cruisers, sportbikes, tourers, and standards are up 17% through the end of 1998. Today’s retail sales produce more than 3.5 times the dollars produced in 1983.
In addition, Powersports research, also reported in Dealernews, stated that “56% of motorsports customers turn to their friendly neighborhood dealer for all of their routine service work.”
4.2.3 Market Needs
For the most part, our members and potential members are very small businesses with limited resources for training and marketing. We can help them improve their earnings and increase the value of their investments with sales and management training and well as marketing information and marketing aids.
Strategy and Implementation Summary
CMBA will focus on three major projects: Winter Conference combined with Motorcycle Show, SuperRide, and Annual Awards Banquet.
Other revenue will come from monthly dinner meetings (profit on dinner plus sponsorship) and sale of advertising in the monthly newsletter.
5.1 Strategy Pyramid
Our main strategy is the growth of membership. A large membership base provides revenue from dues and also positions CMBA as the true representative of the Connecticut motorsports industry.
The tactics to grow the membership are:
- At least twice-annual visits to all potential members within the state, and at least twice-annual telephone to potential associate members outside the state by the executive director,
- Creating value of membership to encourage potential members to join, and
- Building awareness of the Association and the value of membership.
Programs to support these tactics are:
- Association advertising and promotions to bring customers to member locations,
- Special events such as Winter Conference, Motorcycle Show, SuperRide, and Awards Banquet,
- Support and development of places for our customers to use their equipment and get training,
- Legislative and government agency activity and education, and
- Mutual legal aid and support.
5.2 Value Proposition
Our members operate with the knowledge and experience of many businesses over many years instead of trial and error. The opportunity to network with peers as well as industry and government leaders provides value far in excess of the cost of membership.
Our members share in the power of numbers when dealing with insurance carriers, distributors and manufacturers, and other vendors. They have the opportunity to tap into each others inventory for better customer service.
5.3 Competitive Edge
Dealing with highly independent small-business owners requires an aggressive presentation of the value of membership to encourage prospects to spend their time and money with the Association.
Direct on-site presentations by the executive director (and possibly members of the Membership Committee) accompanied by presentation materials that clearly demonstrate value of membership will be used to reach membership size objectives.
Increasing the meeting schedule from twice-yearly to monthly-–always at the same location and same day of the month-–will enable more members and prospective members to attend more meetings. This will build fellowship and trust among competing businesses to raise the standards of the whole industry. In addition, upgrading the newsletter to a monthly publication–-along with fax and email notices-–will improve the flow in critical information and raise the awareness of the benefits of membership.
5.4 Marketing Strategy
As shown by the Funding Forecast table and chart, the major sources of funding will each have its own strategic plan.
- The Winter Conference combined with the Motorcycle Show will be marketed to motorsports businesses throughout New England and New York. Planning the Conference and promoting it to the industry begins in July. The Motorcycle Show is either done in association with an independent show promoter or, lacking one, we’ll do it ourselves.
- Preparation for the annual SuperRide begins immediately after the previous SuperRide, soliciting early reservations by vendors and development of sponsors. Promotion to the general public begins after Labor Day and hits its peak in March.
- The Awards Banquet planning is already in place and will be marketed initially within our membership, then to the industry within Connecticut, and then to the motorcycling public in Connecticut.
5.4.1 Fundraising Programs
Our fundraising programs include monthly objectives with a financial bonus incentive to the executive director to exceeding each month’s objective. The executive director will report to the president and the board of directors each month, and the officers and directors will communicate among themselves, either by meeting or telephoning (also fax or email), at least once a month. The executive director will conference with the president at least weekly.
5.4.2 Funding Forecast
The following table and chart give a run-down on forecasted funding. With a full-time executive director in place, we expect first-year funding to jump dramatically over previous years and then grow incrementally as membership and member services increase.
Revenue assumptions are based on past history plus adjustments for this new initiative:
- Conference revenues are based upon conferences done in years past, enhanced by the support of the Association.
- Motorcycle Show revenues are based upon the past three years of experience, enhanced by new “partners.”
- SuperRide revenues are based upon ten years of experience, enhanced by the support of the Association.
- Awards Banquet revenues are based upon the best estimates of the committee members.


| Funding Forecast | |||
| FY 2000 | FY 2001 | FY 2002 | |
| Funding | |||
| Dues | $12,500 | $15,000 | $15,000 |
| Monthly Meetings | $6,000 | $14,000 | $15,000 |
| Motorcycle Show | $21,000 | $25,000 | $27,000 |
| SuperRide | $107,300 | $120,000 | $150,000 |
| Awards Banquet | $17,000 | $20,000 | $25,000 |
| Conference | $30,000 | $30,000 | $30,000 |
| Newsletter | $1,200 | $1,200 | $1,200 |
| Total Funding | $195,000 | $225,200 | $263,200 |
| Direct Cost of Funding | FY 2000 | FY 2001 | FY 2002 |
| Dues | $150 | $200 | $200 |
| Monthly Meetings | $4,800 | $12,000 | $12,000 |
| Motorcycle Show | $19,000 | $20,000 | $22,000 |
| SuperRide | $74,700 | $80,000 | $100,000 |
| Awards Banquet | $13,500 | $16,000 | $18,000 |
| Conference | $15,500 | $17,000 | $17,000 |
| Newsletter | $900 | $900 | $900 |
| Subtotal Cost of Funding | $128,550 | $146,100 | $170,100 |
5.5 Milestones
The accompanying table lists important program milestones, with dates, responsible parties, and budgets for each. The milestone schedule indicates our emphasis on planning for implementation.
What the table doesn’t show is the commitment behind it. Our business plan includes complete provisions for plan-vs.-actual analysis, and we will hold follow-up meetings every month to discuss the variance and course corrections.

| Milestones | |||||
| Milestone | Start Date | End Date | Budget | Manager | Department |
| Fifty members for FY2000 | 9/30/1999 | 8/31/2000 | $12,500 | Essenfield | Membership |
| 400 at Awards Banquet | 11/13/1999 | 11/13/1999 | $17,000 | D’Occhio | Banquet |
| 200 at Conference | 9/30/1999 | 2/20/2000 | $30,000 | Essenfield | Events |
| Other | 9/30/1999 | 5/5/2000 | $110,000 | Essenfield | Events |
| Totals | $169,500 | ||||
Management Summary
The initial management team consists of the board of directors and officers of CMBA working closely with the executive director. In addition, a professional lobbyist is employed to keep us appraised of legislative activities and to help us affect desired outcomes. Ultimately the work will be divided among committees and the executive director may need to add staff to the Association management team.
6.1 Personnel Plan
The following table summarizes our personnel expenditures (executive director and lobbyist) for the first three years, with compensation increasing from about $43K the first year to about $59K in the third. We believe this plan is a good compromise between fairness and expedience, and meets the commitment of our mission statement. The detailed monthly personnel plan for the first year is included in the appendix.
| Personnel Plan | |||
| FY 2000 | FY 2001 | FY 2002 | |
| Executive Director | $39,000 | $44,000 | $53,000 |
| Other | $4,200 | $5,000 | $6,000 |
| Total People | 2 | 2 | 2 |
| Total Payroll | $43,200 | $49,000 | $59,000 |
Financial Plan
- We want to finance growth solely through cash flow. We recognize that this means we will have to grow more slowly than we might like but that no assessment of members or borrowing is necessary.
- The most important factor in our case is attention to details and to the plan. Therefore, we need to develop a permanent system of communication and accountability between the executive director and the board of directors and officers.
- We are also assuming beginning cash reserves on June 30th of $12,000 according the the Treasurer.
7.1 Important Assumptions
Notes for Funding chart for 1999-2000 (FY2000):
Revenues:
- Dues revenue assumes 50 members (new and renewing) at $250 from Exec. Dir. visiting all potential members in state and calling potential associate members.
- Meeting revenue assumes 20 people per monthly meeting paying $25 each for dinner and meeting.
- Motorcycle Show revenue assumes 11,000 consumers @$10 and 20,000 sq ft @$1.
- SuperRide revenue comes from Registrations, Exhibitors, Advertisers, Sponsors, and Specials. Separate chart is attached for projected SuperRide forecast.
- Awards Banquet Revenue assumes 400 people paying $30 each plus $5,000 sponsorships.
- Conference Revenue assumes 200 people paying $125 each plus $5,000 sponsors and exhibitors.
Costs:
- Motorcycle Show costs include $10,000 for space, $9,000 advertising, $1,000 other costs.
- SuperRide costs include Promotion expense, cost of Event, and General expenses such as credit card charges, postage for confirmations, etc.
| General Assumptions | |||
| FY 2000 | FY 2001 | FY 2002 | |
| Plan Month | 1 | 2 | 3 |
| Current Interest Rate | 10.00% | 10.00% | 10.00% |
| Long-term Interest Rate | 10.00% | 10.00% | 10.00% |
| Tax Rate | 0.00% | 0.00% | 0.00% |
| Other | 0 | 0 | 0 |
7.2 Projected Surplus or Deficit
Our projected surplus and deficit is shown on the following table, with funding increasing from more than $195K the first year to more than $263K the third. Profits may be applied to legislative activities, marketing activities, or held for contingencies.
The detailed monthly projections are included in the appendix.


| Surplus and Deficit | |||
| FY 2000 | FY 2001 | FY 2002 | |
| Funding | $195,000 | $225,200 | $263,200 |
| Direct Cost | $128,550 | $146,100 | $170,100 |
| Other Costs of Funding | $0 | $0 | $0 |
| Total Direct Cost | $128,550 | $146,100 | $170,100 |
| Gross Surplus | $66,450 | $79,100 | $93,100 |
| Gross Surplus % | 34.08% | 35.12% | 35.37% |
| Expenses | |||
| Payroll | $43,200 | $49,000 | $59,000 |
| Marketing/Promotion | $1,380 | $6,400 | $7,450 |
| Depreciation | $0 | $0 | $0 |
| Rent | $6,000 | $6,500 | $7,000 |
| Telephone Service | $1,200 | $1,500 | $1,800 |
| Payroll Taxes | $0 | $0 | $0 |
| Other | $0 | $0 | $0 |
| Total Operating Expenses | $51,780 | $63,400 | $75,250 |
| Surplus Before Interest and Taxes | $14,670 | $15,700 | $17,850 |
| EBITDA | $14,670 | $15,700 | $17,850 |
| Interest Expense | $0 | $0 | $0 |
| Taxes Incurred | $0 | $0 | $0 |
| Net Surplus | $14,670 | $15,700 | $17,850 |
| Net Surplus/Funding | 7.52% | 6.97% | 6.78% |
7.3 Projected Cash Flow
Cash flow projections are critical to our success. The monthly cash flow is shown in the illustration, with one bar representing the cash flow per month, and the other the monthly balance. The annual cash flow figures are included here and the more important detailed monthly numbers are included in the appendix.

| Pro Forma Cash Flow | |||
| FY 2000 | FY 2001 | FY 2002 | |
| Cash Received | |||
| Cash from Operations | |||
| Cash Funding | $195,000 | $225,200 | $263,200 |
| Subtotal Cash from Operations | $195,000 | $225,200 | $263,200 |
| Additional Cash Received | |||
| Sales Tax, VAT, HST/GST Received | $0 | $0 | $0 |
| New Current Borrowing | $0 | $0 | $0 |
| New Other Liabilities (interest-free) | $0 | $0 | $0 |
| New Long-term Liabilities | $0 | $0 | $0 |
| Sales of Other Current Assets | $0 | $0 | $0 |
| Sales of Long-term Assets | $0 | $0 | $0 |
| New Investment Received | $0 | $0 | $0 |
| Subtotal Cash Received | $195,000 | $225,200 | $263,200 |
| Expenditures | FY 2000 | FY 2001 | FY 2002 |
| Expenditures from Operations | |||
| Cash Spending | $43,200 | $49,000 | $59,000 |
| Bill Payments | $135,400 | $149,039 | $184,225 |
| Subtotal Spent on Operations | $178,600 | $198,039 | $243,225 |
| Additional Cash Spent | |||
| Sales Tax, VAT, HST/GST Paid Out | $0 | $0 | $0 |
| Principal Repayment of Current Borrowing | $0 | $0 | $0 |
| Other Liabilities Principal Repayment | $0 | $0 | $0 |
| Long-term Liabilities Principal Repayment | $0 | $0 | $0 |
| Purchase Other Current Assets | $0 | $0 | $0 |
| Purchase Long-term Assets | $0 | $0 | $0 |
| Dividends | $0 | $0 | $0 |
| Subtotal Cash Spent | $178,600 | $198,039 | $243,225 |
| Net Cash Flow | $16,400 | $27,161 | $19,975 |
| Cash Balance | $28,400 | $55,562 | $75,536 |
7.4 Projected Balance Sheet
The balance sheet in the following table shows managed but sufficient growth of net worth, and a sufficiently healthy financial position. The monthly estimates are included in the appendix.
| Pro Forma Balance Sheet | |||
| FY 2000 | FY 2001 | FY 2002 | |
| Assets | |||
| Current Assets | |||
| Cash | $28,400 | $55,562 | $75,536 |
| Other Current Assets | $0 | $0 | $0 |
| Total Current Assets | $28,400 | $55,562 | $75,536 |
| Long-term Assets | |||
| Long-term Assets | $0 | $0 | $0 |
| Accumulated Depreciation | $0 | $0 | $0 |
| Total Long-term Assets | $0 | $0 | $0 |
| Total Assets | $28,400 | $55,562 | $75,536 |
| Liabilities and Capital | FY 2000 | FY 2001 | FY 2002 |
| Current Liabilities | |||
| Accounts Payable | $1,730 | $13,192 | $15,316 |
| Current Borrowing | $0 | $0 | $0 |
| Other Current Liabilities | $0 | $0 | $0 |
| Subtotal Current Liabilities | $1,730 | $13,192 | $15,316 |
| Long-term Liabilities | $0 | $0 | $0 |
| Total Liabilities | $1,730 | $13,192 | $15,316 |
| Paid-in Capital | $0 | $0 | $0 |
| Accumulated Surplus/Deficit | $12,000 | $26,670 | $42,370 |
| Surplus/Deficit | $14,670 | $15,700 | $17,850 |
| Total Capital | $26,670 | $42,370 | $60,220 |
| Total Liabilities and Capital | $28,400 | $55,562 | $75,536 |
| Net Worth | $26,670 | $42,370 | $60,220 |
7.5 Standard Ratios
The following table outlines some of the more important ratios from the Convention and Trade Show Organizers industry. The final column, Industry Profile, details specific ratios based on the industry as it is classified by the Standard Industry Classification (SIC) code, 7389.
| Ratio Analysis | ||||
| FY 2000 | FY 2001 | FY 2002 | Industry Profile | |
| Funding Growth | 838.40% | 15.49% | 16.87% | 10.93% |
| Percent of Total Assets | ||||
| Other Current Assets | 0.00% | 0.00% | 0.00% | 76.67% |
| Total Current Assets | 100.00% | 100.00% | 100.00% | 76.67% |
| Long-term Assets | 0.00% | 0.00% | 0.00% | 23.33% |
| Total Assets | 100.00% | 100.00% | 100.00% | 100.00% |
| Current Liabilities | 6.09% | 23.74% | 20.28% | 40.41% |
| Long-term Liabilities | 0.00% | 0.00% | 0.00% | 17.31% |
| Total Liabilities | 6.09% | 23.74% | 20.28% | 57.72% |
| Net Worth | 93.91% | 76.26% | 79.72% | 42.28% |
| Percent of Funding | ||||
| Funding | 100.00% | 100.00% | 100.00% | 100.00% |
| Gross Surplus | 34.08% | 35.12% | 35.37% | 100.00% |
| Selling, General & Administrative Expenses | 26.55% | 28.15% | 28.59% | 76.26% |
| Advertising Expenses | 0.00% | 0.00% | 0.00% | 2.58% |
| Surplus Before Interest and Taxes | 7.52% | 6.97% | 6.78% | 1.39% |
| Main Ratios | ||||
| Current | 16.41 | 4.21 | 4.93 | 1.42 |
| Quick | 16.41 | 4.21 | 4.93 | 1.14 |
| Total Debt to Total Assets | 6.09% | 23.74% | 20.28% | 67.09% |
| Pre-tax Return on Net Worth | 55.01% | 37.05% | 29.64% | 3.47% |
| Pre-tax Return on Assets | 51.65% | 28.26% | 23.63% | 10.56% |
| Additional Ratios | FY 2000 | FY 2001 | FY 2002 | |
| Net Surplus Margin | 7.52% | 6.97% | 6.78% | n.a |
| Return on Equity | 55.01% | 37.05% | 29.64% | n.a |
| Activity Ratios | ||||
| Accounts Payable Turnover | 79.25 | 12.17 | 12.17 | n.a |
| Payment Days | 27 | 17 | 28 | n.a |
| Total Asset Turnover | 6.87 | 4.05 | 3.48 | n.a |
| Debt Ratios | ||||
| Debt to Net Worth | 0.06 | 0.31 | 0.25 | n.a |
| Current Liab. to Liab. | 1.00 | 1.00 | 1.00 | n.a |
| Liquidity Ratios | ||||
| Net Working Capital | $26,670 | $42,370 | $60,220 | n.a |
| Interest Coverage | 0.00 | 0.00 | 0.00 | n.a |
| Additional Ratios | ||||
| Assets to Funding | 0.15 | 0.25 | 0.29 | n.a |
| Current Debt/Total Assets | 6% | 24% | 20% | n.a |
| Acid Test | 16.41 | 4.21 | 4.93 | n.a |
| Funding/Net Worth | 7.31 | 5.32 | 4.37 | n.a |
| Dividend Payout | 0.00 | 0.00 | 0.00 | n.a |
Appendix
| Funding Forecast | |||||||||||||
| Jul | Aug | Sep | Oct | Nov | Dec | Jan | Feb | Mar | Apr | May | Jun | ||
| Funding | |||||||||||||
| Dues | 0% | $5,000 | $5,000 | $2,500 | $0 | $0 | $0 | $0 | $0 | $0 | $0 | $0 | $0 |
| Monthly Meetings | 0% | $500 | $500 | $500 | $500 | $500 | $500 | $500 | $500 | $500 | $500 | $500 | $500 |
| Motorcycle Show | 0% | $0 | $0 | $0 | $0 | $0 | $0 | $0 | $10,000 | $11,000 | $0 | $0 | $0 |
| SuperRide | 0% | $0 | $0 | $5,800 | $1,800 | $5,600 | $9,400 | $3,200 | $8,000 | $13,000 | $24,000 | $29,000 | $7,500 |
| Awards Banquet | 0% | $0 | $0 | $3,500 | $3,500 | $10,000 | $0 | $0 | $0 | $0 | $0 | $0 | $0 |
| Conference | 0% | $0 | $0 | $0 | $0 | $6,000 | $6,000 | $6,000 | $12,000 | $0 | $0 | $0 | $0 |
| Newsletter | 0% | $100 | $100 | $100 | $100 | $100 | $100 | $100 | $100 | $100 | $100 | $100 | $100 |
| Total Funding | $5,600 | $5,600 | $12,400 | $5,900 | $22,200 | $16,000 | $9,800 | $30,600 | $24,600 | $24,600 | $29,600 | $8,100 | |
| Direct Cost of Funding | Jul | Aug | Sep | Oct | Nov | Dec | Jan | Feb | Mar | Apr | May | Jun | |
| Dues | $150 | $0 | $0 | $0 | $0 | $0 | $0 | $0 | $0 | $0 | $0 | $0 | |
| Monthly Meetings | $400 | $400 | $400 | $400 | $400 | $400 | $400 | $400 | $400 | $400 | $400 | $400 | |
| Motorcycle Show | $0 | $0 | $0 | $0 | $0 | $0 | $10,000 | $9,000 | $0 | $0 | $0 | $0 | |
| SuperRide | $500 | $500 | $2,300 | $1,800 | $3,000 | $4,000 | $10,000 | $14,000 | $4,000 | $16,000 | $18,000 | $600 | |
| Awards Banquet | $0 | $0 | $1,000 | $0 | $12,500 | $0 | $0 | $0 | $0 | $0 | $0 | $0 | |
| Conference | $0 | $0 | $6,000 | $500 | $500 | $0 | $500 | $8,000 | $0 | $0 | $0 | $0 | |
| Newsletter | $75 | $75 | $75 | $75 | $75 | $75 | $75 | $75 | $75 | $75 | $75 | $75 | |
| Subtotal Cost of Funding | $1,125 | $975 | $9,775 | $2,775 | $16,475 | $4,475 | $20,975 | $31,475 | $4,475 | $16,475 | $18,475 | $1,075 | |
| Personnel Plan | |||||||||||||
| Jul | Aug | Sep | Oct | Nov | Dec | Jan | Feb | Mar | Apr | May | Jun | ||
| Executive Director | 0% | $3,250 | $3,250 | $3,250 | $3,250 | $3,250 | $3,250 | $3,250 | $3,250 | $3,250 | $3,250 | $3,250 | $3,250 |
| Other | 0% | $350 | $350 | $350 | $350 | $350 | $350 | $350 | $350 | $350 | $350 | $350 | $350 |
| Total People | 2 | 2 | 2 | 2 | 2 | 2 | 2 | 2 | 2 | 2 | 2 | 2 | |
| Total Payroll | $3,600 | $3,600 | $3,600 | $3,600 | $3,600 | $3,600 | $3,600 | $3,600 | $3,600 | $3,600 | $3,600 | $3,600 | |
| Surplus and Deficit | |||||||||||||
| Jul | Aug | Sep | Oct | Nov | Dec | Jan | Feb | Mar | Apr | May | Jun | ||
| Funding | $5,600 | $5,600 | $12,400 | $5,900 | $22,200 | $16,000 | $9,800 | $30,600 | $24,600 | $24,600 | $29,600 | $8,100 | |
| Direct Cost | $1,125 | $975 | $9,775 | $2,775 | $16,475 | $4,475 | $20,975 | $31,475 | $4,475 | $16,475 | $18,475 | $1,075 | |
| Other Costs of Funding | $0 | $0 | $0 | $0 | $0 | $0 | $0 | $0 | $0 | $0 | $0 | $0 | |
| Total Direct Cost | $1,125 | $975 | $9,775 | $2,775 | $16,475 | $4,475 | $20,975 | $31,475 | $4,475 | $16,475 | $18,475 | $1,075 | |
| Gross Surplus | $4,475 | $4,625 | $2,625 | $3,125 | $5,725 | $11,525 | ($11,175) | ($875) | $20,125 | $8,125 | $11,125 | $7,025 | |
| Gross Surplus % | 79.91% | 82.59% | 21.17% | 52.97% | 25.79% | 72.03% | -114.03% | -2.86% | 81.81% | 33.03% | 37.58% | 86.73% | |
| Expenses | |||||||||||||
| Payroll | $3,600 | $3,600 | $3,600 | $3,600 | $3,600 | $3,600 | $3,600 | $3,600 | $3,600 | $3,600 | $3,600 | $3,600 | |
| Marketing/Promotion | $115 | $115 | $115 | $115 | $115 | $115 | $115 | $115 | $115 | $115 | $115 | $115 | |
| Depreciation | $0 | $0 | $0 | $0 | $0 | $0 | $0 | $0 | $0 | $0 | $0 | $0 | |
| Rent | $500 | $500 | $500 | $500 | $500 | $500 | $500 | $500 | $500 | $500 | $500 | $500 | |
| Telephone Service | $100 | $100 | $100 | $100 | $100 | $100 | $100 | $100 | $100 | $100 | $100 | $100 | |
| Payroll Taxes | 15% | $0 | $0 | $0 | $0 | $0 | $0 | $0 | $0 | $0 | $0 | $0 | $0 |
| Other | $0 | $0 | $0 | $0 | $0 | $0 | $0 | $0 | $0 | $0 | $0 | $0 | |
| Total Operating Expenses | $4,315 | $4,315 | $4,315 | $4,315 | $4,315 | $4,315 | $4,315 | $4,315 | $4,315 | $4,315 | $4,315 | $4,315 | |
| Surplus Before Interest and Taxes | $160 | $310 | ($1,690) | ($1,190) | $1,410 | $7,210 | ($15,490) | ($5,190) | $15,810 | $3,810 | $6,810 | $2,710 | |
| EBITDA | $160 | $310 | ($1,690) | ($1,190) | $1,410 | $7,210 | ($15,490) | ($5,190) | $15,810 | $3,810 | $6,810 | $2,710 | |
| Interest Expense | $0 | $0 | $0 | $0 | $0 | $0 | $0 | $0 | $0 | $0 | $0 | $0 | |
| Taxes Incurred | $0 | $0 | $0 | $0 | $0 | $0 | $0 | $0 | $0 | $0 | $0 | $0 | |
| Net Surplus | $160 | $310 | ($1,690) | ($1,190) | $1,410 | $7,210 | ($15,490) | ($5,190) | $15,810 | $3,810 | $6,810 | $2,710 | |
| Net Surplus/Funding | 2.86% | 5.54% | -13.63% | -20.17% | 6.35% | 45.06% | -158.06% | -16.96% | 64.27% | 15.49% | 23.01% | 33.46% | |
| Pro Forma Cash Flow | |||||||||||||
| Jul | Aug | Sep | Oct | Nov | Dec | Jan | Feb | Mar | Apr | May | Jun | ||
| Cash Received | |||||||||||||
| Cash from Operations | |||||||||||||
| Cash Funding | $5,600 | $5,600 | $12,400 | $5,900 | $22,200 | $16,000 | $9,800 | $30,600 | $24,600 | $24,600 | $29,600 | $8,100 | |
| Subtotal Cash from Operations | $5,600 | $5,600 | $12,400 | $5,900 | $22,200 | $16,000 | $9,800 | $30,600 | $24,600 | $24,600 | $29,600 | $8,100 | |
| Additional Cash Received | |||||||||||||
| Sales Tax, VAT, HST/GST Received | 0.00% | $0 | $0 | $0 | $0 | $0 | $0 | $0 | $0 | $0 | $0 | $0 | $0 |
| New Current Borrowing | $0 | $0 | $0 | $0 | $0 | $0 | $0 | $0 | $0 | $0 | $0 | $0 | |
| New Other Liabilities (interest-free) | $0 | $0 | $0 | $0 | $0 | $0 | $0 | $0 | $0 | $0 | $0 | $0 | |
| New Long-term Liabilities | $0 | $0 | $0 | $0 | $0 | $0 | $0 | $0 | $0 | $0 | $0 | $0 | |
| Sales of Other Current Assets | $0 | $0 | $0 | $0 | $0 | $0 | $0 | $0 | $0 | $0 | $0 | $0 | |
| Sales of Long-term Assets | $0 | $0 | $0 | $0 | $0 | $0 | $0 | $0 | $0 | $0 | $0 | $0 | |
| New Investment Received | $0 | $0 | $0 | $0 | $0 | $0 | $0 | $0 | $0 | $0 | $0 | $0 | |
| Subtotal Cash Received | $5,600 | $5,600 | $12,400 | $5,900 | $22,200 | $16,000 | $9,800 | $30,600 | $24,600 | $24,600 | $29,600 | $8,100 | |
| Expenditures | Jul | Aug | Sep | Oct | Nov | Dec | Jan | Feb | Mar | Apr | May | Jun | |
| Expenditures from Operations | |||||||||||||
| Cash Spending | $3,600 | $3,600 | $3,600 | $3,600 | $3,600 | $3,600 | $3,600 | $3,600 | $3,600 | $3,600 | $3,600 | $3,600 | |
| Bill Payments | $61 | $1,835 | $1,983 | $10,257 | $3,947 | $16,790 | $5,740 | $22,040 | $31,290 | $5,590 | $17,257 | $18,610 | |
| Subtotal Spent on Operations | $3,661 | $5,435 | $5,583 | $13,857 | $7,547 | $20,390 | $9,340 | $25,640 | $34,890 | $9,190 | $20,857 | $22,210 | |
| Additional Cash Spent | |||||||||||||
| Sales Tax, VAT, HST/GST Paid Out | $0 | $0 | $0 | $0 | $0 | $0 | $0 | $0 | $0 | $0 | $0 | $0 | |
| Principal Repayment of Current Borrowing | $0 | $0 | $0 | $0 | $0 | $0 | $0 | $0 | $0 | $0 | $0 | $0 | |
| Other Liabilities Principal Repayment | $0 | $0 | $0 | $0 | $0 | $0 | $0 | $0 | $0 | $0 | $0 | $0 | |
| Long-term Liabilities Principal Repayment | $0 | $0 | $0 | $0 | $0 | $0 | $0 | $0 | $0 | $0 | $0 | $0 | |
| Purchase Other Current Assets | $0 | $0 | $0 | $0 | $0 | $0 | $0 | $0 | $0 | $0 | $0 | $0 | |
| Purchase Long-term Assets | $0 | $0 | $0 | $0 | $0 | $0 | $0 | $0 | $0 | $0 | $0 | $0 | |
| Dividends | $0 | $0 | $0 | $0 | $0 | $0 | $0 | $0 | $0 | $0 | $0 | $0 | |
| Subtotal Cash Spent | $3,661 | $5,435 | $5,583 | $13,857 | $7,547 | $20,390 | $9,340 | $25,640 | $34,890 | $9,190 | $20,857 | $22,210 | |
| Net Cash Flow | $1,939 | $165 | $6,817 | ($7,957) | $14,653 | ($4,390) | $460 | $4,960 | ($10,290) | $15,410 | $8,743 | ($14,110) | |
| Cash Balance | $13,939 | $14,104 | $20,920 | $12,964 | $27,617 | $23,227 | $23,687 | $28,647 | $18,357 | $33,767 | $42,510 | $28,400 | |
| Pro Forma Balance Sheet | |||||||||||||
| Jul | Aug | Sep | Oct | Nov | Dec | Jan | Feb | Mar | Apr | May | Jun | ||
| Assets | Starting Balances | ||||||||||||
| Current Assets | |||||||||||||
| Cash | $12,000 | $13,939 | $14,104 | $20,920 | $12,964 | $27,617 | $23,227 | $23,687 | $28,647 | $18,357 | $33,767 | $42,510 | $28,400 |
| Other Current Assets | $0 | $0 | $0 | $0 | $0 | $0 | $0 | $0 | $0 | $0 | $0 | $0 | $0 |
| Total Current Assets | $12,000 | $13,939 | $14,104 | $20,920 | $12,964 | $27,617 | $23,227 | $23,687 | $28,647 | $18,357 | $33,767 | $42,510 | $28,400 |
| Long-term Assets | |||||||||||||
| Long-term Assets | $0 | $0 | $0 | $0 | $0 | $0 | $0 | $0 | $0 | $0 | $0 | $0 | $0 |
| Accumulated Depreciation | $0 | $0 | $0 | $0 | $0 | $0 | $0 | $0 | $0 | $0 | $0 | $0 | $0 |
| Total Long-term Assets | $0 | $0 | $0 | $0 | $0 | $0 | $0 | $0 | $0 | $0 | $0 | $0 | $0 |
| Total Assets | $12,000 | $13,939 | $14,104 | $20,920 | $12,964 | $27,617 | $23,227 | $23,687 | $28,647 | $18,357 | $33,767 | $42,510 | $28,400 |
| Liabilities and Capital | Jul | Aug | Sep | Oct | Nov | Dec | Jan | Feb | Mar | Apr | May | Jun | |
| Current Liabilities | |||||||||||||
| Accounts Payable | $0 | $1,779 | $1,634 | $10,140 | $3,374 | $16,617 | $5,017 | $20,967 | $31,117 | $5,017 | $16,617 | $18,550 | $1,730 |
| Current Borrowing | $0 | $0 | $0 | $0 | $0 | $0 | $0 | $0 | $0 | $0 | $0 | $0 | $0 |
| Other Current Liabilities | $0 | $0 | $0 | $0 | $0 | $0 | $0 | $0 | $0 | $0 | $0 | $0 | $0 |
| Subtotal Current Liabilities | $0 | $1,779 | $1,634 | $10,140 | $3,374 | $16,617 | $5,017 | $20,967 | $31,117 | $5,017 | $16,617 | $18,550 | $1,730 |
| Long-term Liabilities | $0 | $0 | $0 | $0 | $0 | $0 | $0 | $0 | $0 | $0 | $0 | $0 | $0 |
| Total Liabilities | $0 | $1,779 | $1,634 | $10,140 | $3,374 | $16,617 | $5,017 | $20,967 | $31,117 | $5,017 | $16,617 | $18,550 | $1,730 |
| Paid-in Capital | $0 | $0 | $0 | $0 | $0 | $0 | $0 | $0 | $0 | $0 | $0 | $0 | $0 |
| Accumulated Surplus/Deficit | $12,000 | $12,000 | $12,000 | $12,000 | $12,000 | $12,000 | $12,000 | $12,000 | $12,000 | $12,000 | $12,000 | $12,000 | $12,000 |
| Surplus/Deficit | $0 | $160 | $470 | ($1,220) | ($2,410) | ($1,000) | $6,210 | ($9,280) | ($14,470) | $1,340 | $5,150 | $11,960 | $14,670 |
| Total Capital | $12,000 | $12,160 | $12,470 | $10,780 | $9,590 | $11,000 | $18,210 | $2,720 | ($2,470) | $13,340 | $17,150 | $23,960 | $26,670 |
| Total Liabilities and Capital | $12,000 | $13,939 | $14,104 | $20,920 | $12,964 | $27,617 | $23,227 | $23,687 | $28,647 | $18,357 | $33,767 | $42,510 | $28,400 |
| Net Worth | $12,000 | $12,160 | $12,470 | $10,780 | $9,590 | $11,000 | $18,210 | $2,720 | ($2,470) | $13,340 | $17,150 | $23,960 | $26,670 |


