
Gamehenge Tapers Co-op
Executive Summary
Gamehenge Tapers Co-op is a not-for-profit organization that was created to serve the Portland tapers community. The tapers community is a hobby based community that trades live recordings for personal use, never for commercial gain. The Co-op will provide this community with the equipment needed to further the taping of shows which in effect supports the trading community as well (people who trade these live shows for personal consumption only). The Co-op sells the recording equipment at wholesale prices + a low overhead percentage. By offering the members heavily discounted rates, it encourages them to become more active tapers. Because the organization is a not-for-profit co-op, members are willing to volunteer their time to help the organization allowing it to become successful. The organization exists to support the trading community.
Membership dues and a small charge for overhead will allow the organization to cover costs associated with doing business and allow it to slowly grow. Gamehenge Tapers Co-op will be increasing their membership roster by at least 20% per year.

1.1 Objectives
The objectives for the first three years of operation include:
- To create a co-op whose #1 goal is to serve its members.
- To increase the membership base by 20% each year.
- To provide the Portland traders community with cost + overhead deals on CD-R media, microphones, CD-RWs and DAT recorders.
- To develop a sustainable co-op.
1.2 Mission
Gamehenge Tapers Co-op’ s mission is to serve the Portland tapers community. We exist to attract and maintain customers. When we adhere to this maxim, everything else will fall in to place. Our services will exceed the expectations of our customers.
Organization Summary
Gamehenge Tapers Co-op is a co-operative organization designed to serve the Portland tapers community. The tapers community is a hobby based group that records and trades live concerts. All of the bands that allow live recordings are “live” or “jam” bands who incorporate improvisation into their live performances so each performance is unique. The group members trade these live performances for personal consumption, enjoying the unique attributes of each individual show. Commercial use of these shows is strictly prohibited.
The organization sells a wide range of equipment for tapers. The equipment is purchased through normal wholesale distribution channels and sold directly to organizational members. Membership is required for entry to the co-op. A $40 entry fee and proof of traders status (a list of your show list is usually sufficient) is all that is needed to become a member. Products must be purchased through the web site and then picked up from the office at certain times throughout the week. Questions regarding products can be answered via email or phone (typically voicemail with a return phone call).
2.1 Legal Entity
Gamehenge Tapers Co-op is a 501C not-for-profit co-operative organization.
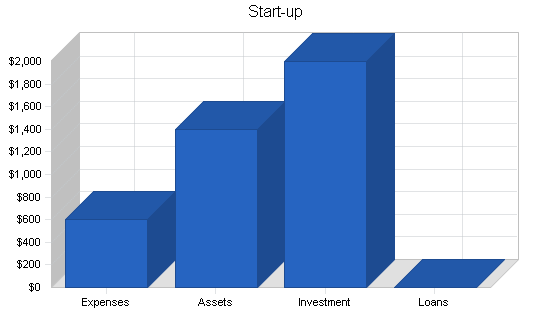
2.2 Start-up Summary
Gamehenge Tapers Co-op’s start up costs include:
- Desk, chair and file cabinet.
- Computer with printer, CD-RW, and internet connection.
- Legal fees for formation of not-for-profit status including filing fees.
- Website development.
| Start-up | |
| Requirements | |
| Start-up Expenses | |
| Legal | $200 |
| Website development | $200 |
| Rent | $200 |
| Other | $0 |
| Total Start-up Expenses | $600 |
| Start-up Assets | |
| Cash Required | $250 |
| Start-up Inventory | $0 |
| Other Current Assets | $0 |
| Long-term Assets | $1,150 |
| Total Assets | $1,400 |
| Total Requirements | $2,000 |
| Start-up Funding | |
| Start-up Expenses to Fund | $600 |
| Start-up Assets to Fund | $1,400 |
| Total Funding Required | $2,000 |
| Assets | |
| Non-cash Assets from Start-up | $1,150 |
| Cash Requirements from Start-up | $250 |
| Additional Cash Raised | $0 |
| Cash Balance on Starting Date | $250 |
| Total Assets | $1,400 |
| Liabilities and Capital | |
| Liabilities | |
| Current Borrowing | $0 |
| Long-term Liabilities | $0 |
| Accounts Payable (Outstanding Bills) | $0 |
| Other Current Liabilities (interest-free) | $0 |
| Total Liabilities | $0 |
| Capital | |
| Planned Investment | |
| Philanthropist 1 | $1,000 |
| Philanthropist 2 | $1,000 |
| Other | $0 |
| Additional Investment Requirement | $0 |
| Total Planned Investment | $2,000 |
| Loss at Start-up (Start-up Expenses) | ($600) |
| Total Capital | $1,400 |
| Total Capital and Liabilities | $1,400 |
| Total Funding | $2,000 |
Products
Gamehenge Tapers Co-op offers the tapers community the following products:
- CD-RW (Compact Disc ReWriteable) drives for computers, external units with USB, SCSI or Firewire connections.
- High quality stereo microphones for audience taping.
- DAT(digital audio tape) portable recorders.
- CD-R (Compact Disc Recordable) media.
Market Analysis Summary
Gamehenge Tapers Co-op is a not for profit organization designed to serve the individual members of the co-op. These members come from the Portland tapers community, a group of people who attend specific live performances and tape them for their personal consumption as well as for personal trading purposes. This is a very active community and intimate community.
Gamehenge Tapers Co-op will grow its membership through word of mouth promotions at the events. Because it is an intimate community where most people know each other, it will be relatively easy to build up membership. In addition to word of mouth advertising, Gamehenge Tapers Co-op will also have a web site that provides prospective members about the organization and its goals.
4.1 Market Segmentation
Gamehenge Tapers Co-op will be addressing the tapers community in the Portland area. The taping community is made up of individuals that legally tape live concerts. There are a handful of bands that allow taping of their live performances. Generally, record labels discourage or ban taping of live performances because they believe that it infringes on profits from record sales. On the contrary however, it tends to promote the band as there is an entire community that trades these shows, attends the concerts, and buys the records after they hear live performances of the band.
From a legal standpoint, the live performances are copyrighted, but the band nonetheless allows the taping. The vast majority of bands to do not allow taping, it is only a few select bands that allow tapings. These bands are representative by the fact that they are very good live performers, they have a loyal following of people that tour with them and consequently these bands tend to play entirely different set lists each night recognizing the fact that there are people seeing several to many different shows in a row.
The bands that allow recording of live concerts are the remnants of the Grateful Dead (Phil Lesh & Friends, The Other Ones) remnants of Phish (Trey Anastatio and the Giant Country Horns), String Cheese Incident, moe., Blues Traveler, Dave Matthews Band, Medeski Martin & Wood, Tony Furtado, Bela Fleck and the Flecktones, Widespread Panic, Galactic, Government Mule, Greyboy Allstars, Karl Denson and the Tiny Universe, etc.
These bands have a loyal following, a very close knit community. This element lends itself to word of mouth promotion.

| Market Analysis | |||||||
| Year 1 | Year 2 | Year 3 | Year 4 | Year 5 | |||
| Potential Customers | Growth | CAGR | |||||
| Tapers | 10% | 200 | 220 | 242 | 266 | 293 | 10.02% |
| Other | 0% | 0 | 0 | 0 | 0 | 0 | 0.00% |
| Total | 10.02% | 200 | 220 | 242 | 266 | 293 | 10.02% |
4.2 Target Market Segment Strategy
The strategy behind the market segmentation is solely based on word of mouth and web site visibility. Because the taping community is so close knit, if you end up going to a couple of shows to tape, you will run into a large portion of tapers. Everyone knows each other, and everyone trades show from their collection. Growing the membership list through word of mouth will be no problem.
Additionally, Gamehenge Tapers Co-op will operate a web site to which will be used to attract new members. The site however, will have far more content including ordering which is password protected for members only.
4.3 Service Providers Analysis
The industry of tapers is a relatively unregulated, free formed industry. As long as the bands allow taping (there is a select varied group of bands that encourage taping of their live performances) then the taping community is allowed to do what they want. In essence it is a self formed group that police themselves.

4.3.1 Alternatives and Usage Patterns
The competition is regular retail outlets. These take the form of mail order places, retail outlets, and e-commerce sites. These competitors might offer a better selection, however, they will rarely compete on price because they are for profit organizations and Gamehenge Tapers Co-op is a not-for-profit.
The buying patterns of tapers are typically price sensitive. Because the tapers are constantly using their equipment and tons of media, they are generally looking for the best price.
Strategy and Implementation Summary
Gamehenge Tapers Co-op will be aggressively using word of mouth advertising to generate new members. The cost of this is minimal as the members are already at the concerts taping for their own collection already.
Gamehenge Tapers Co-op will have a web site that will be used to attract new members, however, the members gained from the site will pale in comparison to word of mouth promotion.
5.1 Competitive Edge
Gamehenge Tapers Co-op competitive edge is its co-operative business structure. The organization is not-for-profit so all revenue gets funneled back into the organization. The organization is set up to solely benefit the members. The members benefit by being able to purchase equipment at drastically reduced prices compared to retail.
5.2 Fundraising Strategy
The sales strategy will be simply to increase membership. Increasing membership increases buying power, reducing wholesale and overhead costs, benefiting members.
5.2.1 Funding Forecast
The first month will be used to set up the office and web site. The office will be in a small space with low rental costs. The web site will be designed to provide general information to the public and detailed product information regarding the products offered. Members will only be able to purchase products via the web site and picked up from the office at certain times.
Month two will see an increase in sales and membership. The following months will see both membership as well as sales activity.

| Funding Forecast | |||
| Year 1 | Year 2 | Year 3 | |
| Funding | |||
| Tapers | $37,294 | $41,545 | $42,154 |
| Memebership income | $3,800 | $0 | $0 |
| Total Funding | $41,094 | $41,545 | $42,154 |
| Direct Cost of Funding | Year 1 | Year 2 | Year 3 |
| Tapers | $33,565 | $37,391 | $37,939 |
| Memebership income | $0 | $0 | $0 |
| Subtotal Cost of Funding | $33,565 | $37,391 | $37,939 |
5.3 Milestones
Gamehenge Tapers Co-op will have several milestones early on:
- Business plan completion. This will be done as a roadmap for the organization. While we do not need a business plan to raise capital, it will be an indispensable tool for the ongoing performance and improvement of the company.
- Office set up.
- The 100th member signed up.
Management Summary
Gamehenge Tapers Co-op was founded and led by Al Truistic. Al graduated from the University of Vermont with a degree in business. After college, Al spent the next five months on the road following the band Phish. This was his first introduction to the taping scene. After coming back home to Portland, Al got his MBA from the University of Portland.
Al then entered the business world with a job at VersionTracker, an internet start up that provided software updates for Mac OS. His love for taping never disappeared and continued to tape at all of the live bands that passed through Portland. After numerous discussions with a lot of the Portland taping community, Al concluded that there was demand for a tapers co-op so he began investing his free time to pursue this goal.
6.1 Personnel Plan
Al will be working part time for Gamehenge Tapers Co-op. He will perform purchasing, order fulfillment and general management of the organization. His wife Sarah will help out with membership and the financials. These two positions are unpaid, volunteer positions.
Web maintenance will be done by one of the members at a below market rates.
It is Al’s and Sarah’s plan that once they get things up off the ground and the co-op becomes much more active they will recruit more members to volunteer their time to take care of the necessary details.
Financial Plan
The following sections will outline the important financial assumptions, key financial indicators, Break-even Analysis, profit and loss, cash flow, and balance sheet.
7.1 Important Assumptions
The following table highlights some of the important financial assumptions for Gamehenge Tapers Co-op.
| General Assumptions | |||
| Year 1 | Year 2 | Year 3 | |
| Plan Month | 1 | 2 | 3 |
| Current Interest Rate | 10.00% | 10.00% | 10.00% |
| Long-term Interest Rate | 10.00% | 10.00% | 10.00% |
| Tax Rate | 2.50% | 0.00% | 2.50% |
| Other | 0 | 0 | 0 |
7.2 Break-even Analysis
The Break-even Analysis shows what we need in monthly revenue to break even.

| Break-even Analysis | |
| Monthly Revenue Break-even | $1,741 |
| Assumptions: | |
| Average Percent Variable Cost | 82% |
| Estimated Monthly Fixed Cost | $319 |
7.3 Projected Surplus or Deficit
THe following table will indicate projected surplus or deficit.
| Surplus and Deficit | |||
| Year 1 | Year 2 | Year 3 | |
| Funding | $41,094 | $41,545 | $42,154 |
| Direct Cost | $33,565 | $37,391 | $37,939 |
| Other | $0 | $0 | $0 |
| Total Direct Cost | $33,565 | $37,391 | $37,939 |
| Gross Surplus | $7,529 | $4,155 | $4,215 |
| Gross Surplus % | 18.32% | 10.00% | 10.00% |
| Expenses | |||
| Payroll | $0 | $0 | $0 |
| Sales and Marketing and Other Expenses | $600 | $600 | $600 |
| Depreciation | $228 | $228 | $228 |
| Leased Equipment | $0 | $0 | $0 |
| Utilities | $0 | $0 | $0 |
| Insurance | $600 | $600 | $600 |
| Rent | $2,400 | $2,400 | $2,400 |
| Payroll Taxes | $0 | $0 | $0 |
| Other | $0 | $0 | $0 |
| Total Operating Expenses | $3,828 | $3,828 | $3,828 |
| Surplus Before Interest and Taxes | $3,701 | $327 | $387 |
| EBITDA | $3,929 | $555 | $615 |
| Interest Expense | $0 | $0 | $0 |
| Taxes Incurred | ($48) | $0 | $10 |
| Net Surplus | $3,749 | $327 | $378 |
| Net Surplus/Funding | 9.12% | 0.79% | 0.90% |
7.4 Projected Cash Flow
The following chart and table will indicate projected cash flow.

| Pro Forma Cash Flow | |||
| Year 1 | Year 2 | Year 3 | |
| Cash Received | |||
| Cash from Operations | |||
| Cash Funding | $41,094 | $41,545 | $42,154 |
| Subtotal Cash from Operations | $41,094 | $41,545 | $42,154 |
| Additional Cash Received | |||
| Sales Tax, VAT, HST/GST Received | $0 | $0 | $0 |
| New Current Borrowing | $0 | $0 | $0 |
| New Other Liabilities (interest-free) | $0 | $0 | $0 |
| New Long-term Liabilities | $0 | $0 | $0 |
| Sales of Other Current Assets | $0 | $0 | $0 |
| Sales of Long-term Assets | $0 | $0 | $0 |
| New Investment Received | $0 | $0 | $0 |
| Subtotal Cash Received | $41,094 | $41,545 | $42,154 |
| Expenditures | Year 1 | Year 2 | Year 3 |
| Expenditures from Operations | |||
| Cash Spending | $0 | $0 | $0 |
| Bill Payments | $36,615 | $42,634 | $41,602 |
| Subtotal Spent on Operations | $36,615 | $42,634 | $41,602 |
| Additional Cash Spent | |||
| Sales Tax, VAT, HST/GST Paid Out | $0 | $0 | $0 |
| Principal Repayment of Current Borrowing | $0 | $0 | $0 |
| Other Liabilities Principal Repayment | $0 | $0 | $0 |
| Long-term Liabilities Principal Repayment | $0 | $0 | $0 |
| Purchase Other Current Assets | $0 | $0 | $0 |
| Purchase Long-term Assets | $0 | $0 | $0 |
| Dividends | $0 | $0 | $0 |
| Subtotal Cash Spent | $36,615 | $42,634 | $41,602 |
| Net Cash Flow | $4,479 | ($1,089) | $552 |
| Cash Balance | $4,729 | $3,641 | $4,193 |
7.5 Projected Balance Sheet
The following table will indicate the projected balance sheet.
| Pro Forma Balance Sheet | |||
| Year 1 | Year 2 | Year 3 | |
| Assets | |||
| Current Assets | |||
| Cash | $4,729 | $3,641 | $4,193 |
| Inventory | $4,083 | $4,548 | $4,615 |
| Other Current Assets | $0 | $0 | $0 |
| Total Current Assets | $8,812 | $8,189 | $8,808 |
| Long-term Assets | |||
| Long-term Assets | $1,150 | $1,150 | $1,150 |
| Accumulated Depreciation | $228 | $456 | $684 |
| Total Long-term Assets | $922 | $694 | $466 |
| Total Assets | $9,734 | $8,883 | $9,274 |
| Liabilities and Capital | Year 1 | Year 2 | Year 3 |
| Current Liabilities | |||
| Accounts Payable | $4,585 | $3,407 | $3,420 |
| Current Borrowing | $0 | $0 | $0 |
| Other Current Liabilities | $0 | $0 | $0 |
| Subtotal Current Liabilities | $4,585 | $3,407 | $3,420 |
| Long-term Liabilities | $0 | $0 | $0 |
| Total Liabilities | $4,585 | $3,407 | $3,420 |
| Paid-in Capital | $2,000 | $2,000 | $2,000 |
| Accumulated Surplus/Deficit | ($600) | $3,149 | $3,476 |
| Surplus/Deficit | $3,749 | $327 | $378 |
| Total Capital | $5,149 | $5,476 | $5,853 |
| Total Liabilities and Capital | $9,734 | $8,883 | $9,274 |
| Net Worth | $5,149 | $5,476 | $5,853 |
Appendix
| Funding Forecast | |||||||||||||
| Month 1 | Month 2 | Month 3 | Month 4 | Month 5 | Month 6 | Month 7 | Month 8 | Month 9 | Month 10 | Month 11 | Month 12 | ||
| Funding | |||||||||||||
| Tapers | 0% | $0 | $1,545 | $2,587 | $3,654 | $3,878 | $4,578 | $3,254 | $4,578 | $2,587 | $3,124 | $3,385 | $4,124 |
| Memebership income | 0% | $160 | $360 | $400 | $480 | $400 | $320 | $280 | $200 | $360 | $280 | $200 | $360 |
| Total Funding | $160 | $1,905 | $2,987 | $4,134 | $4,278 | $4,898 | $3,534 | $4,778 | $2,947 | $3,404 | $3,585 | $4,484 | |
| Direct Cost of Funding | Month 1 | Month 2 | Month 3 | Month 4 | Month 5 | Month 6 | Month 7 | Month 8 | Month 9 | Month 10 | Month 11 | Month 12 | |
| Tapers | $0 | $1,391 | $2,328 | $3,289 | $3,490 | $4,120 | $2,929 | $4,120 | $2,328 | $2,812 | $3,047 | $3,712 | |
| Memebership income | $0 | $0 | $0 | $0 | $0 | $0 | $0 | $0 | $0 | $0 | $0 | $0 | |
| Subtotal Cost of Funding | $0 | $1,391 | $2,328 | $3,289 | $3,490 | $4,120 | $2,929 | $4,120 | $2,328 | $2,812 | $3,047 | $3,712 | |
| General Assumptions | |||||||||||||
| Month 1 | Month 2 | Month 3 | Month 4 | Month 5 | Month 6 | Month 7 | Month 8 | Month 9 | Month 10 | Month 11 | Month 12 | ||
| Plan Month | 1 | 2 | 3 | 4 | 5 | 6 | 7 | 8 | 9 | 10 | 11 | 12 | |
| Current Interest Rate | 10.00% | 10.00% | 10.00% | 10.00% | 10.00% | 10.00% | 10.00% | 10.00% | 10.00% | 10.00% | 10.00% | 10.00% | |
| Long-term Interest Rate | 10.00% | 10.00% | 10.00% | 10.00% | 10.00% | 10.00% | 10.00% | 10.00% | 10.00% | 10.00% | 10.00% | 10.00% | |
| Tax Rate | 30.00% | 0.00% | 0.00% | 0.00% | 0.00% | 0.00% | 0.00% | 0.00% | 0.00% | 0.00% | 0.00% | 0.00% | |
| Other | 0 | 0 | 0 | 0 | 0 | 0 | 0 | 0 | 0 | 0 | 0 | 0 | |
| Surplus and Deficit | |||||||||||||
| Month 1 | Month 2 | Month 3 | Month 4 | Month 5 | Month 6 | Month 7 | Month 8 | Month 9 | Month 10 | Month 11 | Month 12 | ||
| Funding | $160 | $1,905 | $2,987 | $4,134 | $4,278 | $4,898 | $3,534 | $4,778 | $2,947 | $3,404 | $3,585 | $4,484 | |
| Direct Cost | $0 | $1,391 | $2,328 | $3,289 | $3,490 | $4,120 | $2,929 | $4,120 | $2,328 | $2,812 | $3,047 | $3,712 | |
| Other | $0 | $0 | $0 | $0 | $0 | $0 | $0 | $0 | $0 | $0 | $0 | $0 | |
| Total Direct Cost | $0 | $1,391 | $2,328 | $3,289 | $3,490 | $4,120 | $2,929 | $4,120 | $2,328 | $2,812 | $3,047 | $3,712 | |
| Gross Surplus | $160 | $515 | $659 | $845 | $788 | $778 | $605 | $658 | $619 | $592 | $539 | $772 | |
| Gross Surplus % | 100.00% | 27.01% | 22.05% | 20.45% | 18.42% | 15.88% | 17.13% | 13.77% | 20.99% | 17.40% | 15.02% | 17.23% | |
| Expenses | |||||||||||||
| Payroll | $0 | $0 | $0 | $0 | $0 | $0 | $0 | $0 | $0 | $0 | $0 | $0 | |
| Sales and Marketing and Other Expenses | $50 | $50 | $50 | $50 | $50 | $50 | $50 | $50 | $50 | $50 | $50 | $50 | |
| Depreciation | $19 | $19 | $19 | $19 | $19 | $19 | $19 | $19 | $19 | $19 | $19 | $19 | |
| Leased Equipment | $0 | $0 | $0 | $0 | $0 | $0 | $0 | $0 | $0 | $0 | $0 | $0 | |
| Utilities | $0 | $0 | $0 | $0 | $0 | $0 | $0 | $0 | $0 | $0 | $0 | $0 | |
| Insurance | $50 | $50 | $50 | $50 | $50 | $50 | $50 | $50 | $50 | $50 | $50 | $50 | |
| Rent | $200 | $200 | $200 | $200 | $200 | $200 | $200 | $200 | $200 | $200 | $200 | $200 | |
| Payroll Taxes | 15% | $0 | $0 | $0 | $0 | $0 | $0 | $0 | $0 | $0 | $0 | $0 | $0 |
| Other | $0 | $0 | $0 | $0 | $0 | $0 | $0 | $0 | $0 | $0 | $0 | $0 | |
| Total Operating Expenses | $319 | $319 | $319 | $319 | $319 | $319 | $319 | $319 | $319 | $319 | $319 | $319 | |
| Surplus Before Interest and Taxes | ($159) | $196 | $340 | $526 | $469 | $459 | $286 | $339 | $300 | $273 | $220 | $453 | |
| EBITDA | ($140) | $215 | $359 | $545 | $488 | $478 | $305 | $358 | $319 | $292 | $239 | $472 | |
| Interest Expense | $0 | $0 | $0 | $0 | $0 | $0 | $0 | $0 | $0 | $0 | $0 | $0 | |
| Taxes Incurred | ($48) | $0 | $0 | $0 | $0 | $0 | $0 | $0 | $0 | $0 | $0 | $0 | |
| Net Surplus | ($111) | $196 | $340 | $526 | $469 | $459 | $286 | $339 | $300 | $273 | $220 | $453 | |
| Net Surplus/Funding | -69.56% | 10.26% | 11.37% | 12.73% | 10.96% | 9.37% | 8.10% | 7.09% | 10.17% | 8.03% | 6.12% | 10.11% | |
| Pro Forma Cash Flow | |||||||||||||
| Month 1 | Month 2 | Month 3 | Month 4 | Month 5 | Month 6 | Month 7 | Month 8 | Month 9 | Month 10 | Month 11 | Month 12 | ||
| Cash Received | |||||||||||||
| Cash from Operations | |||||||||||||
| Cash Funding | $160 | $1,905 | $2,987 | $4,134 | $4,278 | $4,898 | $3,534 | $4,778 | $2,947 | $3,404 | $3,585 | $4,484 | |
| Subtotal Cash from Operations | $160 | $1,905 | $2,987 | $4,134 | $4,278 | $4,898 | $3,534 | $4,778 | $2,947 | $3,404 | $3,585 | $4,484 | |
| Additional Cash Received | |||||||||||||
| Sales Tax, VAT, HST/GST Received | 0.00% | $0 | $0 | $0 | $0 | $0 | $0 | $0 | $0 | $0 | $0 | $0 | $0 |
| New Current Borrowing | $0 | $0 | $0 | $0 | $0 | $0 | $0 | $0 | $0 | $0 | $0 | $0 | |
| New Other Liabilities (interest-free) | $0 | $0 | $0 | $0 | $0 | $0 | $0 | $0 | $0 | $0 | $0 | $0 | |
| New Long-term Liabilities | $0 | $0 | $0 | $0 | $0 | $0 | $0 | $0 | $0 | $0 | $0 | $0 | |
| Sales of Other Current Assets | $0 | $0 | $0 | $0 | $0 | $0 | $0 | $0 | $0 | $0 | $0 | $0 | |
| Sales of Long-term Assets | $0 | $0 | $0 | $0 | $0 | $0 | $0 | $0 | $0 | $0 | $0 | $0 | |
| New Investment Received | $0 | $0 | $0 | $0 | $0 | $0 | $0 | $0 | $0 | $0 | $0 | $0 | |
| Subtotal Cash Received | $160 | $1,905 | $2,987 | $4,134 | $4,278 | $4,898 | $3,534 | $4,778 | $2,947 | $3,404 | $3,585 | $4,484 | |
| Expenditures | Month 1 | Month 2 | Month 3 | Month 4 | Month 5 | Month 6 | Month 7 | Month 8 | Month 9 | Month 10 | Month 11 | Month 12 | |
| Expenditures from Operations | |||||||||||||
| Cash Spending | $0 | $0 | $0 | $0 | $0 | $0 | $0 | $0 | $0 | $0 | $0 | $0 | |
| Bill Payments | $8 | $351 | $3,235 | $3,693 | $4,624 | $4,049 | $5,007 | $2,045 | $5,583 | $1,357 | $3,021 | $3,643 | |
| Subtotal Spent on Operations | $8 | $351 | $3,235 | $3,693 | $4,624 | $4,049 | $5,007 | $2,045 | $5,583 | $1,357 | $3,021 | $3,643 | |
| Additional Cash Spent | |||||||||||||
| Sales Tax, VAT, HST/GST Paid Out | $0 | $0 | $0 | $0 | $0 | $0 | $0 | $0 | $0 | $0 | $0 | $0 | |
| Principal Repayment of Current Borrowing | $0 | $0 | $0 | $0 | $0 | $0 | $0 | $0 | $0 | $0 | $0 | $0 | |
| Other Liabilities Principal Repayment | $0 | $0 | $0 | $0 | $0 | $0 | $0 | $0 | $0 | $0 | $0 | $0 | |
| Long-term Liabilities Principal Repayment | $0 | $0 | $0 | $0 | $0 | $0 | $0 | $0 | $0 | $0 | $0 | $0 | |
| Purchase Other Current Assets | $0 | $0 | $0 | $0 | $0 | $0 | $0 | $0 | $0 | $0 | $0 | $0 | |
| Purchase Long-term Assets | $0 | $0 | $0 | $0 | $0 | $0 | $0 | $0 | $0 | $0 | $0 | $0 | |
| Dividends | $0 | $0 | $0 | $0 | $0 | $0 | $0 | $0 | $0 | $0 | $0 | $0 | |
| Subtotal Cash Spent | $8 | $351 | $3,235 | $3,693 | $4,624 | $4,049 | $5,007 | $2,045 | $5,583 | $1,357 | $3,021 | $3,643 | |
| Net Cash Flow | $152 | $1,554 | ($248) | $441 | ($346) | $849 | ($1,473) | $2,733 | ($2,636) | $2,047 | $564 | $841 | |
| Cash Balance | $402 | $1,955 | $1,708 | $2,149 | $1,803 | $2,652 | $1,180 | $3,913 | $1,277 | $3,324 | $3,888 | $4,729 | |
| Pro Forma Balance Sheet | |||||||||||||
| Month 1 | Month 2 | Month 3 | Month 4 | Month 5 | Month 6 | Month 7 | Month 8 | Month 9 | Month 10 | Month 11 | Month 12 | ||
| Assets | Starting Balances | ||||||||||||
| Current Assets | |||||||||||||
| Cash | $250 | $402 | $1,955 | $1,708 | $2,149 | $1,803 | $2,652 | $1,180 | $3,913 | $1,277 | $3,324 | $3,888 | $4,729 |
| Inventory | $0 | $0 | $1,530 | $2,561 | $3,617 | $3,839 | $4,532 | $3,221 | $4,532 | $3,204 | $3,093 | $3,351 | $4,083 |
| Other Current Assets | $0 | $0 | $0 | $0 | $0 | $0 | $0 | $0 | $0 | $0 | $0 | $0 | $0 |
| Total Current Assets | $250 | $402 | $3,485 | $4,269 | $5,766 | $5,642 | $7,185 | $4,401 | $8,445 | $4,480 | $6,417 | $7,239 | $8,812 |
| Long-term Assets | |||||||||||||
| Long-term Assets | $1,150 | $1,150 | $1,150 | $1,150 | $1,150 | $1,150 | $1,150 | $1,150 | $1,150 | $1,150 | $1,150 | $1,150 | $1,150 |
| Accumulated Depreciation | $0 | $19 | $38 | $57 | $76 | $95 | $114 | $133 | $152 | $171 | $190 | $209 | $228 |
| Total Long-term Assets | $1,150 | $1,131 | $1,112 | $1,093 | $1,074 | $1,055 | $1,036 | $1,017 | $998 | $979 | $960 | $941 | $922 |
| Total Assets | $1,400 | $1,533 | $4,597 | $5,362 | $6,840 | $6,697 | $8,221 | $5,418 | $9,443 | $5,459 | $7,377 | $8,180 | $9,734 |
| Liabilities and Capital | Month 1 | Month 2 | Month 3 | Month 4 | Month 5 | Month 6 | Month 7 | Month 8 | Month 9 | Month 10 | Month 11 | Month 12 | |
| Current Liabilities | |||||||||||||
| Accounts Payable | $0 | $244 | $3,113 | $3,538 | $4,490 | $3,878 | $4,943 | $1,854 | $5,540 | $1,257 | $2,900 | $3,485 | $4,585 |
| Current Borrowing | $0 | $0 | $0 | $0 | $0 | $0 | $0 | $0 | $0 | $0 | $0 | $0 | $0 |
| Other Current Liabilities | $0 | $0 | $0 | $0 | $0 | $0 | $0 | $0 | $0 | $0 | $0 | $0 | $0 |
| Subtotal Current Liabilities | $0 | $244 | $3,113 | $3,538 | $4,490 | $3,878 | $4,943 | $1,854 | $5,540 | $1,257 | $2,900 | $3,485 | $4,585 |
| Long-term Liabilities | $0 | $0 | $0 | $0 | $0 | $0 | $0 | $0 | $0 | $0 | $0 | $0 | $0 |
| Total Liabilities | $0 | $244 | $3,113 | $3,538 | $4,490 | $3,878 | $4,943 | $1,854 | $5,540 | $1,257 | $2,900 | $3,485 | $4,585 |
| Paid-in Capital | $2,000 | $2,000 | $2,000 | $2,000 | $2,000 | $2,000 | $2,000 | $2,000 | $2,000 | $2,000 | $2,000 | $2,000 | $2,000 |
| Accumulated Surplus/Deficit | ($600) | ($600) | ($600) | ($600) | ($600) | ($600) | ($600) | ($600) | ($600) | ($600) | ($600) | ($600) | ($600) |
| Surplus/Deficit | $0 | ($111) | $84 | $424 | $950 | $1,419 | $1,878 | $2,164 | $2,503 | $2,803 | $3,076 | $3,296 | $3,749 |
| Total Capital | $1,400 | $1,289 | $1,484 | $1,824 | $2,350 | $2,819 | $3,278 | $3,564 | $3,903 | $4,203 | $4,476 | $4,696 | $5,149 |
| Total Liabilities and Capital | $1,400 | $1,533 | $4,597 | $5,362 | $6,840 | $6,697 | $8,221 | $5,418 | $9,443 | $5,459 | $7,377 | $8,180 | $9,734 |
| Net Worth | $1,400 | $1,289 | $1,484 | $1,824 | $2,350 | $2,819 | $3,278 | $3,564 | $3,903 | $4,203 | $4,476 | $4,696 | $5,149 |


