
Advocates for Legal Equal Access
Executive Summary
Advocates for Legal Equal Access is a not-for-profit public interest law firm that provides civil rights legal representation to indigent Portland citizens. Advocates’ provides legal aid to those that cannot afford it and those that are not serviced through other organizations. By nature, America is a fairly litigious society, and while everyone has the same legal rights, attorneys are generally required for someone to enforce/assert their rights. This is not a problem for people with money, but for those without, civil rights are often compromised. Advocates for Legal Equal Access will reverse this trend by offering legal aid to those that could not otherwise afford it.
Advocates for Legal Equal Access is founded and lead by Al Rand. Al will leverage his outstanding networking and marketing skills to bring visibility and donations to the organization. Advocates for Legal Equal Access will rely on law firms and corporate money donations, as well as pro bono donations from fellow attorneys. Advocates for Legal Equal Access will be started up with a donation of time and money from Al and will sustain itself off of donations.
1.1 Objectives
The objectives for the first three years of operation include:
- To create a service-based organization whose primary goal is to exceed customer’s expectations.
- To serve the Portland community with legal representation for societal members who could not otherwise afford representation.
- To increase donations by 20% per year.
1.2 Mission
Advocates for Legal Equal Access’ mission is to provide the Portland indigent community with legal services for civil rights issues. We exist to attract and maintain customers. When we adhere to this maxim, everything else will fall into place. Our services will exceed the expectations of our customers.
Organization Summary
Advocates for Legal Equal Access will be set up as an Oregon nonprofit organization, qualifying for 501C(3) status.
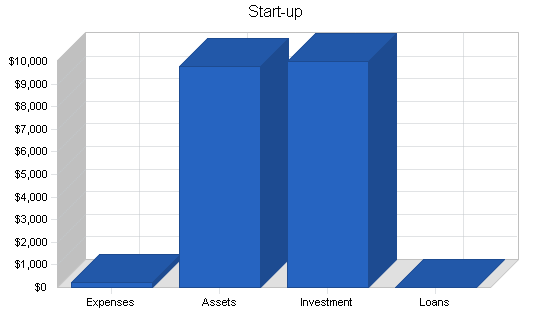
2.1 Start-up Summary
Advocates for Legal Equal Access will incur the following start-up costs:
- Three networked computers, including one printer and one CD-RW drive, a DSL connection with a DSL router.
- Three desks and chairs, all purchased at a used furniture store for increased value.
- Assorted office supplies.
- Stationary.
- Website development fees. The website will be primarily used for visibility with corporations and law firms to further the sense of legitimacy of the organization.
| Start-up Funding | |
| Start-up Expenses to Fund | $200 |
| Start-up Assets to Fund | $9,800 |
| Total Funding Required | $10,000 |
| Assets | |
| Non-cash Assets from Start-up | $4,700 |
| Cash Requirements from Start-up | $5,100 |
| Additional Cash Raised | $0 |
| Cash Balance on Starting Date | $5,100 |
| Total Assets | $9,800 |
| Liabilities and Capital | |
| Liabilities | |
| Current Borrowing | $0 |
| Long-term Liabilities | $0 |
| Accounts Payable (Outstanding Bills) | $0 |
| Other Current Liabilities (interest-free) | $0 |
| Total Liabilities | $0 |
| Capital | |
| Planned Investment | |
| Al | $10,000 |
| Donor 2 | $0 |
| Other | $0 |
| Additional Investment Requirement | $0 |
| Total Planned Investment | $10,000 |
| Loss at Start-up (Start-up Expenses) | ($200) |
| Total Capital | $9,800 |
| Total Capital and Liabilities | $9,800 |
| Total Funding | $10,000 |
| Start-up | |
| Requirements | |
| Start-up Expenses | |
| Legal | $0 |
| Stationery etc. | $200 |
| Other | $0 |
| Total Start-up Expenses | $200 |
| Start-up Assets | |
| Cash Required | $5,100 |
| Other Current Assets | $0 |
| Long-term Assets | $4,700 |
| Total Assets | $9,800 |
| Total Requirements | $10,000 |
Services
Advocates for Legal Equal Access provides civil rights legal services for the Portland indigent community. These types of services range from discrimination, to fair housing practices, to 1st amendment issues, to due process claims. These services will apply to individuals who qualify for services using the Advocates minimum qualification system, based on a variety of factors including income, access to other legal alternatives, and the type of litigation that is being sought or defended.
Market Analysis Summary
Advocates for Legal Equal Access will provide legal services to people who do not qualify for other types of legal aid because 1) they do not fit the economic profile, 2) the other organizations do not have the time, resources, or do not specialize in that particular type of law.
Advocates for Legal Equal Access will be in constant contact with the other legal aid organizations to develop a referral system to support the Portland indigent community.
4.1 Market Segmentation
The Advocates’ market can be segmented into two different segments:
- People who do not qualify for other legal aid agencies for economic reasons but qualify for Advocates.
- People who have legal needs that are not currently served by existing legal aid agencies.

| Market Analysis | |||||||
| Year 1 | Year 2 | Year 3 | Year 4 | Year 5 | |||
| Potential Customers | Growth | CAGR | |||||
| Customers based on economic restraint | 9% | 22,547 | 24,576 | 26,788 | 29,199 | 31,827 | 9.00% |
| Customers based on litigation subject | 9% | 31,455 | 34,286 | 37,372 | 40,735 | 44,401 | 9.00% |
| Other | 0% | 0 | 0 | 0 | 0 | 0 | 0.00% |
| Total | 9.00% | 54,002 | 58,862 | 64,160 | 69,934 | 76,228 | 9.00% |
4.2 Target Market Segment Strategy
Advocates for Legal Equal Access will target the different segments by developing relationships with other legal aid organizations. By developing a relationship with these organizations, Advocates will obtain new clients when they are unable to serve.
Advocates will also target new clients by developing awareness of itself with different courts in the city so that the court is aware of Advocates and can refer the people to them.
As long as the proper agencies and organizations are aware of the Advocates, then it will not be difficult to get clients as the legal aid sector has demand that outstrips supply.
Strategy and Implementation Summary
Advocates for Legal Equal Access will rely on Al’s marketing and fundraising to raise awareness of Advocates and to solicit donations as the primary income income stream. Al will leverage his extensive network of legal and corporate contacts to raise funds for Advocates. Al will also use his contacts to solicit donations of time from fellow attorneys to help out with the case load.
5.1 Competitive Edge
Advocates for Legal Equal Access’ competitive edge is their effectiveness as fundraisers. The legal aid market is always in demand as there are far more customers as there are service providers. For this reason it is important to be able to fund your organization. Advocates founder, Al Rand, has developed an extensive network of colleagues after practicing for ten years at a large Portland law firm. Al will be able to use his network to develop donations from the firms and their individual members.
Another component of the Advocates’ competitive edge is Al’s marketing skills. These will be used to set up programs with the large firms to give their attorneys credit toward pro bono requirements as well as to their yearly hourly requirements, encouraging more donations of time from the attorneys.
5.2 Marketing Strategy
Advocates for Legal Equal Access’ marketing strategy will be based on marketing themselves to different law firms as well as to different corporations. The law firms will be targeted for cash donations as well donations of attorney’s time. The corporations will be targeted for fiscal donations.
Al will use his marketing skills learned in his MBA studies to market Advocates as an organization that offers public interest support for the greater Portland community. Approximately 40% of Al’s time will be spent fundraising/marketing. A lot of this time will be spent traveling around and meeting with the different leaders of the organizations and convincing them that Advocates is a well run organization, deserving of the company’s support. Because Al comes from ten years of law practice in a well respected firm, he generates a lot of legitimacy or visibility in the Portland community. For corporations or law firms that are donating time or money to the Advocates, they are reassured that they will gain from their donation because of the visibility that they will get from their donation, the better “bang for the buck” efficiency of delivery of services of the Advocates, and the positive feeling of their financial civic virtue.

The attorneys sought will be convinced to donate their time to Advocates because it is a particularly efficient organization and the time donation will be of greater value (meaning more people will be served) than the same time donation to another cause.
5.3 Fundraising Strategy
This topic was covered in the previous marketing sections since these two activities are so intertwined in nonprofit organizations.
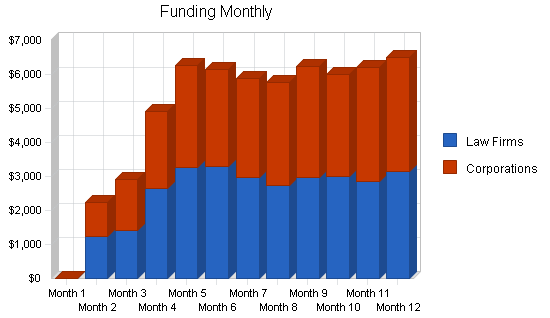
5.3.1 Funding Forecast
It is forecasted that initial funding will be slow for the first few months. Al will be making an initial donation for the start-up costs. After month four as the organization is truly up and running and has gained visibility in the community, the donations will begin to flow in at a more regular rate. This applies to both fiscal donations as well as attorneys’ donations of their time to take over case loads.
| Funding Forecast | |||
| Year 1 | Year 2 | Year 3 | |
| Funding | |||
| Law Firms | $29,546 | $38,954 | $38,985 |
| Corporations | $29,445 | $37,455 | $41,888 |
| Total Funding | $58,991 | $76,409 | $80,873 |
| Direct Cost of Funding | Year 1 | Year 2 | Year 3 |
| Law Firms | $0 | $0 | $0 |
| Corporations | $0 | $0 | $0 |
| Subtotal Cost of Funding | $0 | $0 | $0 |
5.4 Milestones
Advocates for Legal Equal Access will have several milestones early on:
- Business plan completion. This will be done as a roadmap for the organization. This will be an indispensable tool for the ongoing performance and improvement of the company.
- Set up the office.
- Official release of the website.
- The first case won.
- Donations exceeding $50,000.
| Milestones | |||||
| Milestone | Start Date | End Date | Budget | Manager | Department |
| Business plan completion | 1/1/2001 | 2/1/2001 | $0 | ABC | Marketing |
| Set up the office | 1/1/2001 | 2/1/2001 | $0 | ABC | Department |
| Official release of the website | 1/1/2001 | 2/1/2001 | $0 | ABC | Department |
| The first case won | 1/1/2001 | 4/1/2001 | $0 | ABC | Department |
| Donations exceeding $50,000 | 1/1/2001 | 11/30/2001 | $0 | ABC | Department |
| Totals | $0 | ||||
Management Summary
Al Rand received his Bachelor of Arts from Oberlin college in OH. Following college, Al spent two years in Ghana, Africa for the Peace Corps developing sustainable agriculture for the local villages. After the Peace Corps Al applied and was accepted to Willamette University’s College of Law and Atkinson Graduate School of Management. During the school year Al spent all of his free time with Willamette’s public interest student organization. During the summers Al worked for Stoel Rives. His hope was to work for Stoel Rives (the largest Portland law firm) after graduation to gain excellent experience as well as participate in their pro bono program where pro bono hours count toward yearly hourly requirements for the firm.
Upon graduation Al got an offer from Stoel and accepted it. Al practiced in the domestic affairs corporate divisions for ten years. During this time he got to know a large part of the legal and corporate community in Portland. After ten years of practice Al felt that he had developed enough skills, networking, and enough earned enough money to start up his own nonprofit public interest law firm.
6.1 Personnel Plan
Al will work full-time for Advocates. Approximately 40% of his time will be spent marketing/fundraising, while the remaining time will be spent doing legal work and administrative/management details. At month three an administrative assistant/paralegal will be hired. These will be the only paid positions.
Advocates for Legal Equal Access will receive law student interns through Lewis and Clark as well as Willamette University. Local attorneys will also be donating their time to help out with the case load.
| Personnel Plan | |||
| Year 1 | Year 2 | Year 3 | |
| Al | $22,500 | $33,000 | $35,000 |
| Adminstrative assistant/paralegal | $16,000 | $20,000 | $20,000 |
| Other | $0 | $0 | $0 |
| Total People | 2 | 2 | 2 |
| Total Payroll | $38,500 | $53,000 | $55,000 |
Financial Plan
The following sections will outline important financial information.
7.1 Important Assumptions
The following table details important financial assumptions.
| General Assumptions | |||
| Year 1 | Year 2 | Year 3 | |
| Plan Month | 1 | 2 | 3 |
| Current Interest Rate | 10.00% | 10.00% | 10.00% |
| Long-term Interest Rate | 10.00% | 10.00% | 10.00% |
| Tax Rate | 0.00% | 0.00% | 0.00% |
| Other | 0 | 0 | 0 |
7.2 Projected Surplus or Deficit
The following table will indicate surplus or deficit.

| Surplus and Deficit | |||
| Year 1 | Year 2 | Year 3 | |
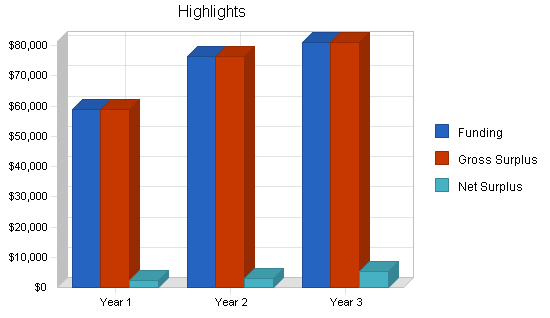
| Funding | $58,991 | $76,409 | $80,873 |
| Direct Cost | $0 | $0 | $0 |
| Other Production Expenses | $0 | $0 | $0 |
| Total Direct Cost | $0 | $0 | $0 |
| Gross Surplus | $58,991 | $76,409 | $80,873 |
| Gross Surplus % | 100.00% | 100.00% | 100.00% |
| Expenses | |||
| Payroll | $38,500 | $53,000 | $55,000 |
| Sales and Marketing and Other Expenses | $1,200 | $1,200 | $1,200 |
| Depreciation | $936 | $936 | $936 |
| Web site + DSL | $1,620 | $1,620 | $1,620 |
| Utilities | $600 | $600 | $600 |
| Insurance | $2,100 | $2,100 | $2,100 |
| Rent | $6,000 | $6,000 | $6,000 |
| Payroll Taxes | $5,775 | $7,950 | $8,250 |
| Other | $0 | $0 | $0 |
| Total Operating Expenses | $56,731 | $73,406 | $75,706 |
| Surplus Before Interest and Taxes | $2,260 | $3,003 | $5,167 |
| EBITDA | $3,196 | $3,939 | $6,103 |
| Interest Expense | $0 | $0 | $0 |
| Taxes Incurred | $0 | $0 | $0 |
| Net Surplus | $2,260 | $3,003 | $5,167 |
| Net Surplus/Funding | 3.83% | 3.93% | 6.39% |
7.3 Break-even Analysis
The Break-even Analysis is shown below.

| Break-even Analysis | |
| Monthly Revenue Break-even | $4,728 |
| Assumptions: | |
| Average Percent Variable Cost | 0% |
| Estimated Monthly Fixed Cost | $4,728 |
7.4 Projected Cash Flow
The following chart and table will indicate projected cash flow.

| Pro Forma Cash Flow | |||
| Year 1 | Year 2 | Year 3 | |
| Cash Received | |||
| Cash from Operations | |||
| Cash Funding | $58,991 | $76,409 | $80,873 |
| Subtotal Cash from Operations | $58,991 | $76,409 | $80,873 |
| Additional Cash Received | |||
| Sales Tax, VAT, HST/GST Received | $0 | $0 | $0 |
| New Current Borrowing | $0 | $0 | $0 |
| New Other Liabilities (interest-free) | $0 | $0 | $0 |
| New Long-term Liabilities | $0 | $0 | $0 |
| Sales of Other Current Assets | $0 | $0 | $0 |
| Sales of Long-term Assets | $0 | $0 | $0 |
| New Investment Received | $0 | $0 | $0 |
| Subtotal Cash Received | $58,991 | $76,409 | $80,873 |
| Expenditures | Year 1 | Year 2 | Year 3 |
| Expenditures from Operations | |||
| Cash Spending | $38,500 | $53,000 | $55,000 |
| Bill Payments | $15,773 | $19,392 | $19,745 |
| Subtotal Spent on Operations | $54,273 | $72,392 | $74,745 |
| Additional Cash Spent | |||
| Sales Tax, VAT, HST/GST Paid Out | $0 | $0 | $0 |
| Principal Repayment of Current Borrowing | $0 | $0 | $0 |
| Other Liabilities Principal Repayment | $0 | $0 | $0 |
| Long-term Liabilities Principal Repayment | $0 | $0 | $0 |
| Purchase Other Current Assets | $0 | $0 | $0 |
| Purchase Long-term Assets | $0 | $0 | $0 |
| Dividends | $0 | $0 | $0 |
| Subtotal Cash Spent | $54,273 | $72,392 | $74,745 |
| Net Cash Flow | $4,719 | $4,017 | $6,128 |
| Cash Balance | $9,819 | $13,835 | $19,963 |
7.5 Projected Balance Sheet
The following table will indicate the projected balance sheet.
| Pro Forma Balance Sheet | |||
| Year 1 | Year 2 | Year 3 | |
| Assets | |||
| Current Assets | |||
| Cash | $9,819 | $13,835 | $19,963 |
| Other Current Assets | $0 | $0 | $0 |
| Total Current Assets | $9,819 | $13,835 | $19,963 |
| Long-term Assets | |||
| Long-term Assets | $4,700 | $4,700 | $4,700 |
| Accumulated Depreciation | $936 | $1,872 | $2,808 |
| Total Long-term Assets | $3,764 | $2,828 | $1,892 |
| Total Assets | $13,583 | $16,663 | $21,855 |
| Liabilities and Capital | Year 1 | Year 2 | Year 3 |
| Current Liabilities | |||
| Accounts Payable | $1,523 | $1,600 | $1,625 |
| Current Borrowing | $0 | $0 | $0 |
| Other Current Liabilities | $0 | $0 | $0 |
| Subtotal Current Liabilities | $1,523 | $1,600 | $1,625 |
| Long-term Liabilities | $0 | $0 | $0 |
| Total Liabilities | $1,523 | $1,600 | $1,625 |
| Paid-in Capital | $10,000 | $10,000 | $10,000 |
| Accumulated Surplus/Deficit | ($200) | $2,060 | $5,063 |
| Surplus/Deficit | $2,260 | $3,003 | $5,167 |
| Total Capital | $12,060 | $15,063 | $20,230 |
| Total Liabilities and Capital | $13,583 | $16,663 | $21,855 |
| Net Worth | $12,060 | $15,063 | $20,230 |
7.6 Business Ratios
The following table outlines some of the more important ratios from the Offices of Laywers industry. The final column, Industry Profile, details specific ratios based on the industry as it is classified by the Standard Industry Classification (SIC) code, 8111.
| Ratio Analysis | ||||
| Year 1 | Year 2 | Year 3 | Industry Profile | |
| Funding Growth | 0.00% | 29.53% | 5.84% | 8.50% |
| Percent of Total Assets | ||||
| Other Current Assets | 0.00% | 0.00% | 0.00% | 66.90% |
| Total Current Assets | 72.29% | 83.03% | 91.34% | 75.50% |
| Long-term Assets | 27.71% | 16.97% | 8.66% | 24.50% |
| Total Assets | 100.00% | 100.00% | 100.00% | 100.00% |
| Current Liabilities | 11.21% | 9.60% | 7.44% | 50.20% |
| Long-term Liabilities | 0.00% | 0.00% | 0.00% | 12.90% |
| Total Liabilities | 11.21% | 9.60% | 7.44% | 63.10% |
| Net Worth | 88.79% | 90.40% | 92.56% | 36.90% |
| Percent of Funding | ||||
| Funding | 100.00% | 100.00% | 100.00% | 100.00% |
| Gross Surplus | 100.00% | 100.00% | 100.00% | 0.00% |
| Selling, General & Administrative Expenses | 96.17% | 96.07% | 93.61% | 58.20% |
| Advertising Expenses | 0.00% | 0.00% | 0.00% | 0.50% |
| Surplus Before Interest and Taxes | 3.83% | 3.93% | 6.39% | 3.40% |
| Main Ratios | ||||
| Current | 6.45 | 8.65 | 12.29 | 1.54 |
| Quick | 6.45 | 8.65 | 12.29 | 1.09 |
| Total Debt to Total Assets | 11.21% | 9.60% | 7.44% | 63.10% |
| Pre-tax Return on Net Worth | 18.74% | 19.94% | 25.54% | 12.30% |
| Pre-tax Return on Assets | 16.64% | 18.02% | 23.64% | 33.40% |
| Additional Ratios | Year 1 | Year 2 | Year 3 | |
| Net Surplus Margin | 3.83% | 3.93% | 6.39% | n.a |
| Return on Equity | 18.74% | 19.94% | 25.54% | n.a |
| Activity Ratios | ||||
| Accounts Payable Turnover | 11.36 | 12.17 | 12.17 | n.a |
| Payment Days | 27 | 29 | 30 | n.a |
| Total Asset Turnover | 4.34 | 4.59 | 3.70 | n.a |
| Debt Ratios | ||||
| Debt to Net Worth | 0.13 | 0.11 | 0.08 | n.a |
| Current Liab. to Liab. | 1.00 | 1.00 | 1.00 | n.a |
| Liquidity Ratios | ||||
| Net Working Capital | $8,296 | $12,235 | $18,338 | n.a |
| Interest Coverage | 0.00 | 0.00 | 0.00 | n.a |
| Additional Ratios | ||||
| Assets to Funding | 0.23 | 0.22 | 0.27 | n.a |
| Current Debt/Total Assets | 11% | 10% | 7% | n.a |
| Acid Test | 6.45 | 8.65 | 12.29 | n.a |
| Funding/Net Worth | 4.89 | 5.07 | 4.00 | n.a |
| Dividend Payout | 0.00 | 0.00 | 0.00 | n.a |
Appendix
| Funding Forecast | |||||||||||||
| Month 1 | Month 2 | Month 3 | Month 4 | Month 5 | Month 6 | Month 7 | Month 8 | Month 9 | Month 10 | Month 11 | Month 12 | ||
| Funding | |||||||||||||
| Law Firms | 0% | $0 | $1,245 | $1,400 | $2,645 | $3,254 | $3,300 | $2,985 | $2,745 | $2,978 | $3,004 | $2,845 | $3,145 |
| Corporations | 0% | $0 | $1,000 | $1,500 | $2,254 | $3,000 | $2,845 | $2,900 | $3,005 | $3,245 | $2,995 | $3,356 | $3,345 |
| Total Funding | $0 | $2,245 | $2,900 | $4,899 | $6,254 | $6,145 | $5,885 | $5,750 | $6,223 | $5,999 | $6,201 | $6,490 | |
| Direct Cost of Funding | Month 1 | Month 2 | Month 3 | Month 4 | Month 5 | Month 6 | Month 7 | Month 8 | Month 9 | Month 10 | Month 11 | Month 12 | |
| Law Firms | $0 | $0 | $0 | $0 | $0 | $0 | $0 | $0 | $0 | $0 | $0 | $0 | |
| Corporations | $0 | $0 | $0 | $0 | $0 | $0 | $0 | $0 | $0 | $0 | $0 | $0 | |
| Subtotal Cost of Funding | $0 | $0 | $0 | $0 | $0 | $0 | $0 | $0 | $0 | $0 | $0 | $0 | |
| Personnel Plan | |||||||||||||
| Month 1 | Month 2 | Month 3 | Month 4 | Month 5 | Month 6 | Month 7 | Month 8 | Month 9 | Month 10 | Month 11 | Month 12 | ||
| Al | 0% | $0 | $0 | $0 | $2,500 | $2,500 | $2,500 | $2,500 | $2,500 | $2,500 | $2,500 | $2,500 | $2,500 |
| Adminstrative assistant/paralegal | 0% | $0 | $0 | $1,600 | $1,600 | $1,600 | $1,600 | $1,600 | $1,600 | $1,600 | $1,600 | $1,600 | $1,600 |
| Other | 0% | $0 | $0 | $0 | $0 | $0 | $0 | $0 | $0 | $0 | $0 | $0 | $0 |
| Total People | 0 | 0 | 1 | 2 | 2 | 2 | 2 | 2 | 2 | 2 | 2 | 2 | |
| Total Payroll | $0 | $0 | $1,600 | $4,100 | $4,100 | $4,100 | $4,100 | $4,100 | $4,100 | $4,100 | $4,100 | $4,100 | |
| General Assumptions | |||||||||||||
| Month 1 | Month 2 | Month 3 | Month 4 | Month 5 | Month 6 | Month 7 | Month 8 | Month 9 | Month 10 | Month 11 | Month 12 | ||
| Plan Month | 1 | 2 | 3 | 4 | 5 | 6 | 7 | 8 | 9 | 10 | 11 | 12 | |
| Current Interest Rate | 10.00% | 10.00% | 10.00% | 10.00% | 10.00% | 10.00% | 10.00% | 10.00% | 10.00% | 10.00% | 10.00% | 10.00% | |
| Long-term Interest Rate | 10.00% | 10.00% | 10.00% | 10.00% | 10.00% | 10.00% | 10.00% | 10.00% | 10.00% | 10.00% | 10.00% | 10.00% | |
| Tax Rate | 0.00% | 0.00% | 0.00% | 0.00% | 0.00% | 0.00% | 0.00% | 0.00% | 0.00% | 0.00% | 0.00% | 0.00% | |
| Other | 0 | 0 | 0 | 0 | 0 | 0 | 0 | 0 | 0 | 0 | 0 | 0 | |
| Surplus and Deficit | |||||||||||||
| Month 1 | Month 2 | Month 3 | Month 4 | Month 5 | Month 6 | Month 7 | Month 8 | Month 9 | Month 10 | Month 11 | Month 12 | ||
| Funding | $0 | $2,245 | $2,900 | $4,899 | $6,254 | $6,145 | $5,885 | $5,750 | $6,223 | $5,999 | $6,201 | $6,490 | |
| Direct Cost | $0 | $0 | $0 | $0 | $0 | $0 | $0 | $0 | $0 | $0 | $0 | $0 | |
| Other Production Expenses | $0 | $0 | $0 | $0 | $0 | $0 | $0 | $0 | $0 | $0 | $0 | $0 | |
| Total Direct Cost | $0 | $0 | $0 | $0 | $0 | $0 | $0 | $0 | $0 | $0 | $0 | $0 | |
| Gross Surplus | $0 | $2,245 | $2,900 | $4,899 | $6,254 | $6,145 | $5,885 | $5,750 | $6,223 | $5,999 | $6,201 | $6,490 | |
| Gross Surplus % | 0.00% | 100.00% | 100.00% | 100.00% | 100.00% | 100.00% | 100.00% | 100.00% | 100.00% | 100.00% | 100.00% | 100.00% | |
| Expenses | |||||||||||||
| Payroll | $0 | $0 | $1,600 | $4,100 | $4,100 | $4,100 | $4,100 | $4,100 | $4,100 | $4,100 | $4,100 | $4,100 | |
| Sales and Marketing and Other Expenses | $100 | $100 | $100 | $100 | $100 | $100 | $100 | $100 | $100 | $100 | $100 | $100 | |
| Depreciation | $78 | $78 | $78 | $78 | $78 | $78 | $78 | $78 | $78 | $78 | $78 | $78 | |
| Web site + DSL | $135 | $135 | $135 | $135 | $135 | $135 | $135 | $135 | $135 | $135 | $135 | $135 | |
| Utilities | $50 | $50 | $50 | $50 | $50 | $50 | $50 | $50 | $50 | $50 | $50 | $50 | |
| Insurance | $175 | $175 | $175 | $175 | $175 | $175 | $175 | $175 | $175 | $175 | $175 | $175 | |
| Rent | $500 | $500 | $500 | $500 | $500 | $500 | $500 | $500 | $500 | $500 | $500 | $500 | |
| Payroll Taxes | 15% | $0 | $0 | $240 | $615 | $615 | $615 | $615 | $615 | $615 | $615 | $615 | $615 |
| Other | $0 | $0 | $0 | $0 | $0 | $0 | $0 | $0 | $0 | $0 | $0 | $0 | |
| Total Operating Expenses | $1,038 | $1,038 | $2,878 | $5,753 | $5,753 | $5,753 | $5,753 | $5,753 | $5,753 | $5,753 | $5,753 | $5,753 | |
| Surplus Before Interest and Taxes | ($1,038) | $1,207 | $22 | ($854) | $501 | $392 | $132 | ($3) | $470 | $246 | $448 | $737 | |
| EBITDA | ($960) | $1,285 | $100 | ($776) | $579 | $470 | $210 | $75 | $548 | $324 | $526 | $815 | |
| Interest Expense | $0 | $0 | $0 | $0 | $0 | $0 | $0 | $0 | $0 | $0 | $0 | $0 | |
| Taxes Incurred | $0 | $0 | $0 | $0 | $0 | $0 | $0 | $0 | $0 | $0 | $0 | $0 | |
| Net Surplus | ($1,038) | $1,207 | $22 | ($854) | $501 | $392 | $132 | ($3) | $470 | $246 | $448 | $737 | |
| Net Surplus/Funding | 0.00% | 53.76% | 0.76% | -17.43% | 8.01% | 6.38% | 2.24% | -0.05% | 7.55% | 4.10% | 7.22% | 11.36% | |
| Pro Forma Cash Flow | |||||||||||||
| Month 1 | Month 2 | Month 3 | Month 4 | Month 5 | Month 6 | Month 7 | Month 8 | Month 9 | Month 10 | Month 11 | Month 12 | ||
| Cash Received | |||||||||||||
| Cash from Operations | |||||||||||||
| Cash Funding | $0 | $2,245 | $2,900 | $4,899 | $6,254 | $6,145 | $5,885 | $5,750 | $6,223 | $5,999 | $6,201 | $6,490 | |
| Subtotal Cash from Operations | $0 | $2,245 | $2,900 | $4,899 | $6,254 | $6,145 | $5,885 | $5,750 | $6,223 | $5,999 | $6,201 | $6,490 | |
| Additional Cash Received | |||||||||||||
| Sales Tax, VAT, HST/GST Received | 0.00% | $0 | $0 | $0 | $0 | $0 | $0 | $0 | $0 | $0 | $0 | $0 | $0 |
| New Current Borrowing | $0 | $0 | $0 | $0 | $0 | $0 | $0 | $0 | $0 | $0 | $0 | $0 | |
| New Other Liabilities (interest-free) | $0 | $0 | $0 | $0 | $0 | $0 | $0 | $0 | $0 | $0 | $0 | $0 | |
| New Long-term Liabilities | $0 | $0 | $0 | $0 | $0 | $0 | $0 | $0 | $0 | $0 | $0 | $0 | |
| Sales of Other Current Assets | $0 | $0 | $0 | $0 | $0 | $0 | $0 | $0 | $0 | $0 | $0 | $0 | |
| Sales of Long-term Assets | $0 | $0 | $0 | $0 | $0 | $0 | $0 | $0 | $0 | $0 | $0 | $0 | |
| New Investment Received | $0 | $0 | $0 | $0 | $0 | $0 | $0 | $0 | $0 | $0 | $0 | $0 | |
| Subtotal Cash Received | $0 | $2,245 | $2,900 | $4,899 | $6,254 | $6,145 | $5,885 | $5,750 | $6,223 | $5,999 | $6,201 | $6,490 | |
| Expenditures | Month 1 | Month 2 | Month 3 | Month 4 | Month 5 | Month 6 | Month 7 | Month 8 | Month 9 | Month 10 | Month 11 | Month 12 | |
| Expenditures from Operations | |||||||||||||
| Cash Spending | $0 | $0 | $1,600 | $4,100 | $4,100 | $4,100 | $4,100 | $4,100 | $4,100 | $4,100 | $4,100 | $4,100 | |
| Bill Payments | $32 | $960 | $968 | $1,213 | $1,575 | $1,575 | $1,575 | $1,575 | $1,575 | $1,575 | $1,575 | $1,575 | |
| Subtotal Spent on Operations | $32 | $960 | $2,568 | $5,313 | $5,675 | $5,675 | $5,675 | $5,675 | $5,675 | $5,675 | $5,675 | $5,675 | |
| Additional Cash Spent | |||||||||||||
| Sales Tax, VAT, HST/GST Paid Out | $0 | $0 | $0 | $0 | $0 | $0 | $0 | $0 | $0 | $0 | $0 | $0 | |
| Principal Repayment of Current Borrowing | $0 | $0 | $0 | $0 | $0 | $0 | $0 | $0 | $0 | $0 | $0 | $0 | |
| Other Liabilities Principal Repayment | $0 | $0 | $0 | $0 | $0 | $0 | $0 | $0 | $0 | $0 | $0 | $0 | |
| Long-term Liabilities Principal Repayment | $0 | $0 | $0 | $0 | $0 | $0 | $0 | $0 | $0 | $0 | $0 | $0 | |
| Purchase Other Current Assets | $0 | $0 | $0 | $0 | $0 | $0 | $0 | $0 | $0 | $0 | $0 | $0 | |
| Purchase Long-term Assets | $0 | $0 | $0 | $0 | $0 | $0 | $0 | $0 | $0 | $0 | $0 | $0 | |
| Dividends | $0 | $0 | $0 | $0 | $0 | $0 | $0 | $0 | $0 | $0 | $0 | $0 | |
| Subtotal Cash Spent | $32 | $960 | $2,568 | $5,313 | $5,675 | $5,675 | $5,675 | $5,675 | $5,675 | $5,675 | $5,675 | $5,675 | |
| Net Cash Flow | ($32) | $1,285 | $332 | ($414) | $579 | $470 | $210 | $75 | $548 | $324 | $526 | $815 | |
| Cash Balance | $5,068 | $6,353 | $6,685 | $6,272 | $6,851 | $7,321 | $7,531 | $7,606 | $8,154 | $8,478 | $9,004 | $9,819 | |
| Pro Forma Balance Sheet | |||||||||||||
| Month 1 | Month 2 | Month 3 | Month 4 | Month 5 | Month 6 | Month 7 | Month 8 | Month 9 | Month 10 | Month 11 | Month 12 | ||
| Assets | Starting Balances | ||||||||||||
| Current Assets | |||||||||||||
| Cash | $5,100 | $5,068 | $6,353 | $6,685 | $6,272 | $6,851 | $7,321 | $7,531 | $7,606 | $8,154 | $8,478 | $9,004 | $9,819 |
| Other Current Assets | $0 | $0 | $0 | $0 | $0 | $0 | $0 | $0 | $0 | $0 | $0 | $0 | $0 |
| Total Current Assets | $5,100 | $5,068 | $6,353 | $6,685 | $6,272 | $6,851 | $7,321 | $7,531 | $7,606 | $8,154 | $8,478 | $9,004 | $9,819 |
| Long-term Assets | |||||||||||||
| Long-term Assets | $4,700 | $4,700 | $4,700 | $4,700 | $4,700 | $4,700 | $4,700 | $4,700 | $4,700 | $4,700 | $4,700 | $4,700 | $4,700 |
| Accumulated Depreciation | $0 | $78 | $156 | $234 | $312 | $390 | $468 | $546 | $624 | $702 | $780 | $858 | $936 |
| Total Long-term Assets | $4,700 | $4,622 | $4,544 | $4,466 | $4,388 | $4,310 | $4,232 | $4,154 | $4,076 | $3,998 | $3,920 | $3,842 | $3,764 |
| Total Assets | $9,800 | $9,690 | $10,897 | $11,151 | $10,660 | $11,161 | $11,553 | $11,685 | $11,682 | $12,152 | $12,398 | $12,846 | $13,583 |
| Liabilities and Capital | Month 1 | Month 2 | Month 3 | Month 4 | Month 5 | Month 6 | Month 7 | Month 8 | Month 9 | Month 10 | Month 11 | Month 12 | |
| Current Liabilities | |||||||||||||
| Accounts Payable | $0 | $928 | $928 | $1,160 | $1,523 | $1,523 | $1,523 | $1,523 | $1,523 | $1,523 | $1,523 | $1,523 | $1,523 |
| Current Borrowing | $0 | $0 | $0 | $0 | $0 | $0 | $0 | $0 | $0 | $0 | $0 | $0 | $0 |
| Other Current Liabilities | $0 | $0 | $0 | $0 | $0 | $0 | $0 | $0 | $0 | $0 | $0 | $0 | $0 |
| Subtotal Current Liabilities | $0 | $928 | $928 | $1,160 | $1,523 | $1,523 | $1,523 | $1,523 | $1,523 | $1,523 | $1,523 | $1,523 | $1,523 |
| Long-term Liabilities | $0 | $0 | $0 | $0 | $0 | $0 | $0 | $0 | $0 | $0 | $0 | $0 | $0 |
| Total Liabilities | $0 | $928 | $928 | $1,160 | $1,523 | $1,523 | $1,523 | $1,523 | $1,523 | $1,523 | $1,523 | $1,523 | $1,523 |
| Paid-in Capital | $10,000 | $10,000 | $10,000 | $10,000 | $10,000 | $10,000 | $10,000 | $10,000 | $10,000 | $10,000 | $10,000 | $10,000 | $10,000 |
| Accumulated Surplus/Deficit | ($200) | ($200) | ($200) | ($200) | ($200) | ($200) | ($200) | ($200) | ($200) | ($200) | ($200) | ($200) | ($200) |
| Surplus/Deficit | $0 | ($1,038) | $169 | $191 | ($663) | ($162) | $230 | $362 | $359 | $829 | $1,075 | $1,523 | $2,260 |
| Total Capital | $9,800 | $8,762 | $9,969 | $9,991 | $9,137 | $9,638 | $10,030 | $10,162 | $10,159 | $10,629 | $10,875 | $11,323 | $12,060 |
| Total Liabilities and Capital | $9,800 | $9,690 | $10,897 | $11,151 | $10,660 | $11,161 | $11,553 | $11,685 | $11,682 | $12,152 | $12,398 | $12,846 | $13,583 |
| Net Worth | $9,800 | $8,762 | $9,969 | $9,991 | $9,137 | $9,638 | $10,030 | $10,162 | $10,159 | $10,629 | $10,875 | $11,323 | $12,060 |

