
The Nightclub
Executive Summary
The Nightclub will be the premier, high-energy, themed dance and nightclub in Waldport, YourState. Our goal is to remain a step ahead of our competition through an exemplary service provision. We expect our guests to have more fun during their leisure time. We will provide more video and electronic technology per square footage than anyone else in the region. A simple, yet unique, themed menu and atmosphere will create a sense of ‘belonging’ for locals and tourists alike. Our operating credo is: “happy enthusiastic employees create happy enthusiastic guests.”
The main objectives of the development of this new venue are:
- Capitalize on excellent location opportunity with swift commitment to the new Town Square development.
- To launch the venue with a highly publicized grand opening event in the summer of Year 1.
- To maintain tight control of costs, operations, and cash flow through diligent management and automated computer control.
- To maintain a food cost below 33% of food revenue.
- To maintain a total beverage cost below 25% of beverage revenue.
- To exceed $3 million in annual sales by the fourth year of plan implementation.
The keys to success in achieving our goals are:
- Provide exceptional service that leaves an impression.
- Consistent entertainment atmosphere and product quality.
- Managing our internal finances and cash flow to enable upward capital growth.
- Strict control of all costs, at all times, without exception.
Company Summary
The key elements of The Nightclub’s concept are as follows:
- Entertainment and dance based themes — The company will focus on themes that have mass appeal.
- Distinctive design features — The Nightclub will be characterized by the elaborate dance club situated in a spectator setting which comfortably accommodates 350 guests. The area will also offer three private sky boxes which can be combined for use in a conference or private party setting. This room is intended for special events and daily use. The adjoining dining room and bar would present an inviting and relaxing atmosphere, which displays a collection of musical and dance memorabilia. A live dj will coordinate the events and entertain the patrons with music and games during music breaks and off-times.
- Location, location, location — One of the major advantages that The Nightclub will have over its competition will be its location in the new, high-profile Your Town Center.
- Gaming — The Nightclub will provide several interactive style video games and pool tables to provide for both additional entertainment and revenue.
- Quality food — All would be lost without special attention being paid to the level of food quality. A simple menu offering foods similar to those found at a premier venue. Traditional ‘bar’ appetizers will be on hand for people craving nachos, wings, or quesadillas while they drink and enjoy themselves.
- Exceptional service — In order to reach and maintain a unique image of quality, the Nightclub will provide attentive and friendly service through a high ratio of service personnel to customers, and will also invest in the training and supervision of its employees. We estimate nearly one service staff member for every 35 guests.
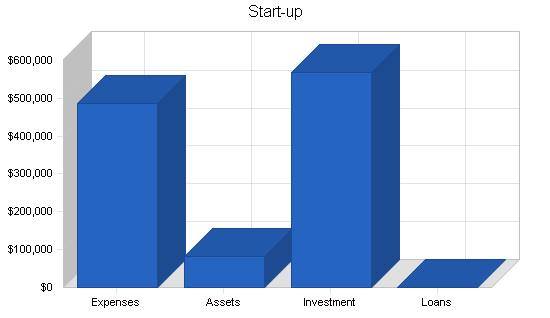
2.1 Start-up Summary
The company is seeking a loan for start-up purposes for a new entertainment venue in Waldport.
Funds needed to accomplish goal referenced above will be $x.x million. The applicant will require the entire $x.x million to finish project build-out.
We will utilize the anticipated loans in the amount of $x.x million to build out the approximate 10,000 square foot space and purchase equipment necessary for the start-up of a new nightclub venue. The following tables and charts illustrate the capital requirements.
| Start-up Funding | |
| Start-up Expenses to Fund | $485,250 |
| Start-up Assets to Fund | $82,500 |
| Total Funding Required | $567,750 |
| Assets | |
| Non-cash Assets from Start-up | $7,500 |
| Cash Requirements from Start-up | $75,000 |
| Additional Cash Raised | $0 |
| Cash Balance on Starting Date | $75,000 |
| Total Assets | $82,500 |
| Liabilities and Capital | |
| Liabilities | |
| Current Borrowing | $0 |
| Long-term Liabilities | $0 |
| Accounts Payable (Outstanding Bills) | $0 |
| Other Current Liabilities (interest-free) | $0 |
| Total Liabilities | $0 |
| Capital | |
| Planned Investment | |
| Investor 1 | $250,000 |
| Investor 2 | $250,000 |
| Other | $67,750 |
| Additional Investment Requirement | $0 |
| Total Planned Investment | $567,750 |
| Loss at Start-up (Start-up Expenses) | ($485,250) |
| Total Capital | $82,500 |
| Total Capital and Liabilities | $82,500 |
| Total Funding | $567,750 |
| Start-up | |
| Requirements | |
| Start-up Expenses | |
| Air Cond. Upgrade | $25,000 |
| Audio/Lighting Lease Payment | $2,750 |
| Bar Equipment | $9,500 |
| Bar Supply | $5,500 |
| Cash Reserves | $125,000 |
| Exterior Signage | $15,000 |
| Fees and Permits | $35,000 |
| FFE | $75,000 |
| Impact Fees | $7,500 |
| Initial Marketing | $22,500 |
| Interior Refit | $45,000 |
| Kitchen Upgrade | $12,500 |
| Legal | $7,500 |
| Opening Salaries Deposits | $25,000 |
| Paper Products | $2,500 |
| Point of Sales Systems | $35,000 |
| Restroom Upgrade | $35,000 |
| Total Start-up Expenses | $485,250 |
| Start-up Assets | |
| Cash Required | $75,000 |
| Start-up Inventory | $7,500 |
| Other Current Assets | $0 |
| Long-term Assets | $0 |
| Total Assets | $82,500 |
| Total Requirements | $567,750 |
2.2 Company Ownership
The Nightclub is a privately-held LLC, the details of which have not been solidified as of the date of this publication. The LLC consists of three principals DD, HK, BK.
D D holds a BS in business administration from the The State University. He has held restaurant management positions for the PepsiCo Corporation. He successfully opened and managed two nightclubs, and went on to open other operations including a sports bar. He is currently in his fifth year in the hotel industry, where he manages a successful sales department.
HK holds a BA in Industrial Media Management, with a concentration in marketing. She has held a financial analyst position with Lockheed Martin and L3 Communications for two years.
BK has been managing a staff for eight years. He is currently in his fifth year in the automotive industry, where he is a successful finance manager.
Services
The emergence of the Main Street area of Waldport represents a unique opportunity for a high-energy, dance-themed venue. The development’s central location, demographics, and lack of direct competition are major advantages to this project. The proposed venue will provide a local solution to the lack of social atmosphere and live sports venues geared primarily toward the 21-35 age group in the Waldport area and will help keep late night entertainment expenditures within the localized region.
The new venue will specialize in high-energy themes, a quality video and gaming area, and will offer beer, wine and an array of liquors and mixed drinks. In addition, the venue will sell non-alcoholic beverages such as soft drinks, juices and bottled water. A “casual” food menu consisting mostly of appetizers and small entrees ranging in cost from six to nine dollars will also be available. The initial hours of operation will be 11:00 P.M. to 2:00 A.M., four nights a week. The establishment will draw primarily from the Waldport market while attracting guests from the area’s other surrounding cities and towns.
Market Analysis Summary
The concept and management of the Nightclub has been well received, and has been offered key placement at the center of Waldport’s new First & Main Town Center development. This commercial center spans 138 acres and promises an immediate primary trade population of 332,000 people with a secondary population of 164,000 people. The Boulevard at the Avenue average daily traffic counts are currently 53,000, and will increase to 72,000 by 2003 following the Boulevard’s connection northward to I-25 in 2001. At the center of the complex will be a 16-screen Cinemark and IMAX theater opening March, 2000. The Center’s planners having met the Nightclub’s management and have reviewed the concept. They have indicated that the Nightclub is “exactly” what they were looking for and wish to place it directly in front of the theater. The annual projected traffic for what Cinemark is calling their ‘flagship’ location is 1.4 million people, which exceeds their current Tinseltown location at the arena.

The Nightclub will be a 10,000 square foot unit, which will also house the company’s corporate business office. The dance club and bar will accommodate 750 people. With Waldport’s rapidly growing population, the variety of the Nightclub from across the country would create mass appeal for all of the Nightclub’s customers. The store will be equipped with state-of-the-art audio and video systems like none other found in Your City. It will serve the need for a true nightclub in Waldport. The general appearance will be clean, open, and pleasing to the customer. The demographics are favorable, with minimal competition from other dance-themed venues and bars.
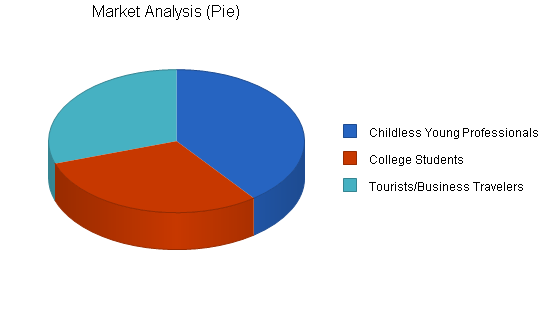
4.1 Market Segmentation
We see The Nightclub as appealing to three major market segments. Fortunately, the long, late night hours of operation help The Nightclub lend itself to multiple segment appeal. Our market segmentation scheme allows some room for estimates and nonspecific definitions.
- Childless Young Professionals–Due to our proximity to the IMAX and Cinemark theaters, we must appeal to single adults and young couples. Whether it is a group of friends or a couple out to see a movie together, these people need a place to eat/drink either before and/or after their movie. These customers will range in age from 27 to 40. The Nightclub will appeal to this category by switching the tempo and entertainment to be more appealing to adults as it gets later into the evening. We also anticipate a 15% annual growth rate in tandem with the growth rate of Waldport and through increased popularity.
- College Students–By creating an environment that is appealing to college students, we secure a natural progression between the high school student and the young professional. Through word of mouth, the Nightclub expects realize an increase of five percent annually from this segment.
- Tourists and Business Travelers–More and more business and travelers and tourists are finding themselves in Waldport every year as is made evident by the increased demand and subsequent expansion of the local airport. We plan to reach these people through direct marketing to local hotel patrons. We anticipate a 20% annual growth rate in this segment. As our relationships grow with the local hotels, so too will the word of mouth recommendations from the hotel staff as well as the patronizing of our restaurant by their families. Our future plan is to publish a simple website in order to create awareness to any traveler who wants to take an advanced look at the club before their visit.
The following chart and table outline the target market segments for the Nightclub, and include annual growth projections.
| Market Analysis | |||||||
| Year 1 | Year 2 | Year 3 | Year 4 | Year 5 | |||
| Potential Customers | Growth | CAGR | |||||
| Childless Young Professionals | 15% | 132,000 | 151,800 | 174,570 | 200,756 | 230,869 | 15.00% |
| College Students | 5% | 100,000 | 105,000 | 110,250 | 115,763 | 121,551 | 5.00% |
| Tourists/Business Travelers | 20% | 100,000 | 120,000 | 144,000 | 172,800 | 207,360 | 20.00% |
| Total | 13.95% | 332,000 | 376,800 | 428,820 | 489,319 | 559,780 | 13.95% |
4.2 Target Market Segment Strategy
Our strategy is based on serving our niche markets exceptionally well. The nightclub enthusiast, the tourist and business traveler, the local nightclub crowd, the local service industry as well as groups going out together, can all enjoy The Nightclub experience.
The marketing strategy is essential to the main strategy:
- Emphasize exceptional service.
- Create awareness of The Nightclub’s unique features.
- Focus on our target markets.
We must charge appropriately for the high-end, high-quality service and food that we offer. Our revenue structure has to match our cost structure, so the wages we pay and the training we provide to assure superior quality and service must be balanced by the fees we charge.
Part of the superior experience we offer is the simplicity o the menu items. While being unique, they are relatively inexpensive and easy to prepare. While a premium is appropriate for the experience, the pricing has to be balanced in accordance with what we are serving.
All menu items will be moderately priced. We expect an average guest expenditure of $12.50 for beverages and $7.50 for the percentage of our guests who choose to take advantage of our food menu. Our target customer spends more than the industry average for moderately priced establishments. This is due to our creating an atmosphere that encourages longer stays and more spending, while still allowing adequate table turns due to extended hours of appeal.
4.3 Service Business Analysis
High energy and dance themed venues have significantly impacted cities from coast to coast in the nineties. Los Angeles’ Hollywood, New York’s Times Square, and Seattle’s Pioneer Square are just a few examples. Entrancing their audiences with high-powered lights, sound, music, and interactive entertainment, these venues are still one of the highest cash flow businesses in the world. Our localized studies have shown that the average person will spend three to four hours per weekend in this type of an environment and will spend an average of twenty to fifty dollars in that time frame. As we approach the new millennium, this trend shows no signs of declining.
The typical venue of our style is open from 8:00 P.M. to 2:00 A.M., and within this time frame, the venue can achieve gross revenues anywhere from $3,500 to $25,000, nightly. The primary sources of revenue in a venue of this type are high volume traffic, coupled with comparably nominal spending. In addition to alcohol revenues, we will also generate substantial revenues from food sales that can typically range from seven to ten dollars per person, and admission fees that range between five and ten dollars per admit.
Entertainment venues in the late 1980’s and 1990’s focused on high-energy light and sound, multiple source video screens, and participative events. This relatively simple concept is still quite popular today. However, these concepts have greatly evolved with society. In recent years this industry has become more sophisticated with the availability of new technology. Larger metropolitan areas have taken this technology to new heights with sound, lighting, video and interactive designs that create an exciting and memorable experience. Fortunately, no one in Your State area has been a pioneer in this specific segment of the industry as of the date of this report.
Additionally, the nightclub and bar industry is shifting towards a more entertainment-oriented concept. Guests of these venues are not only offered a dynamic place to gather and mingle, but also a place to participate in the entertainment through interactive contests, theme nights, and other events. We intend to heavily utilize entertainment-oriented marketing in an effort to withstand the perpetual shift in trends and cater to as large a client base as possible.
Nightclubs and other drinking establishments rely heavily on their primary suppliers. The primary suppliers are the various beverage distributors that provide the establishment with both alcoholic and non-alcoholic beverages. The alcoholic beverages (beer, wine, and liquor) are the primary sources of income in this industry. Other beverage suppliers also play a crucial role by providing non-alcoholic beverages. These are either served alone or mixed with alcohol.
In the area, all major brands of alcoholic beverages are available, in addition to several regional brands of beer. Initial research shows that the major distributors in the market have a high rating in both product availability and delivery.
4.3.1 Main Competitors
The Nightclub competition lies mainly with other casual facilities and less with conventional and chain entertainment establishments. We need to effectively compete with the widely held idea that you can’t get good service anymore, while maintaining the idea that being out can be a lot of fun. Our polling has indicated that consumers think of atmosphere, price, and quality respectively. Additionally, price was frequently mentioned by pointing out that if the former concerns are present then they are willing to pay more for the experience.
Our review of the market concludes that there are four entertainment venues that can be considered direct competition to the proposed new venue. We do realize that the proposed venue will also compete indirectly for every entertainment dollar spent in the Waldport area.
The main competitors of the Nightclub will be:
Club A
Hours of Operation: 5:00 P.M.-2:00 A.M.
Wednesday through Saturday
Capacity: 300
Wednesday College Night ($1 beers)
-This nightclub appeals to a college crowd seeking cheap drinks.
-The club is known for being dingy and dirty.
Bar B
Hours of Operation: 10:00 A.M.- 2:00 A.M.
Monday through Sunday
Capacity: 400
Thursday College/Ladies Nights
-This club appeals to 25-35 year olds.
-Pool and video games are central focus.
-Dancing is pushed to the back of the club.
Grill C
Hours of Operation: 6:00 P.M.-2:00 A.M.
Wednesday through Saturday
Capacity: 250
-This club’s target customer is 25 to 45 years old / middle class or above.
-This club is known for its older, dressed up crowd and cramped space.
Club D
Hours of Operation: 11:00 A.M.-2:00 A.M.
Monday through Sunday
Capacity: 350
-This club’s target customer is 25 to 45 years old.
-This club is known for live jazz and blues entertainment and their draught beers.
4.3.2 Business Participants
The Nightclub will be part of the restaurant and bar industry, which includes several kinds of businesses:
- Locally Operated Bars and Nightclubs – This genre usually appeals to the local neighborhood clientele. This same client base dictates that the average price structure be drastically scaled down in order to create “regulars.”
- Nightclub Entertainment Complexes – This type of complex represents the concept we will most closely compete with. They are typically placed in high traffic locations and are normally treated as destination entertainment. An admission charge is usually in place and the associated price structure is also most like our proposed structure. Thankfully there is not an abundance if this type of entertainment within our region.
- Conventional Dining – Primarily owned by large national chains, usually less than 10,000 square feet, focused on serving good quality food in a reasonable amount of time in a dining room setting. The service and food quality are superior to that of a fast food establishment. People go there to eat and leave when they’re done eating since there’s rarely a reason to stay.
- Formal Dining – Similar to conventional dining yet offering a higher quality of food and service for the added expense. As with the conventional dining facilities, there is little interaction and when people are done eating, they leave.
- Casual Dining – Commonly building upon conventional dining with the addition of a bar, playing of music and sporting events on numerous televisions. Some establishments offer their own brand of beer made on the premises. The food quality and service are at best, similar to that found in a conventional dining experience.
- Chain Entertainment – Typically manifested in each market through the Hard Rock Cafes, the Planet Hollywoods, etc. We expect to create an atmosphere that thrives on its trendy feel. These chain entertainment venues can not hope to draw the same “hip” clientele.
Strategy and Implementation Summary
In order to place emphasis on exceptional service, our main tactics are bi-monthly service training, employee recognition, and higher service employee to customer ratios. Our specific programs for training include employee for life training for management, customer for life training for employees, and the sharing of success stories among employees and management. Our specific employee recognition programs include employee of the month with a personal parking space, service excellence recognition awards of specific employees attached to advertising. To achieve higher service employee to customer ratios, we include separate beverage servers and bussing personnel, as well as maintaining a comfortable table count for the wait staff.
Our second strategy is emphasizing entertainment. The tactics are interactive entertainment, constant sensory appeal, and unique event viewing. Our specific programs for interactive entertainment and constant sensory appeal are frequent contests, games, music, and karaoke all hosted by an in-house dj who is also in charge of event programming for the main room and lounge. A billiard room will overlook the main area. Billiards was selected due to its widespread popularity (fifth most popular sport in the world, according to CNN). A limited number of video and pinball games, as well as computer dart boards, will compliment the billiard tables in order to offer a less interactive entertainment option. With an adjoining bar and plenty of seating, yet another unique experience could be carved out of a visit to The Nightclub.
Our promise fulfillment strategy may be our most important. The necessary tactics are ongoing value-based training, maintenance, and attention to detail, especially after popularity has been established. Through empowerment of service employees to solve problems without making a customer wait for management consultation we create a win-win situation for the customer and the restaurant. Continuous and never-ending improvement is the order of the day through our regular training sessions and meetings. Since value is equal to service rendered minus the price charged, it is crucial to go beyond the mere serving of food in a room full of lights and sound, you have to create a long-lasting impression.
- Emphasize exceptional service — We MUST prove to guests that exceptional service is still available and should be expected as part of a dining experience. We need to differentiate ourselves from the mediocre service venues.
- Emphasize an entertaining experience — By assuring that all guests will enjoy themselves, we would be securing market share through repeat business.
- Focus on target markets — Our marketing and themes of mass appeal and music based entertainment will attract our target market segments.
- Differentiate and fulfill the above promises.
We can’t just market and sell another dance club, we must actually deliver on our promise of quality, service and a unique guest experience. We need to make sure we have the fun and service intensive staff that we claim to have.
5.1 Marketing Strategy
A high growth area, such as Waldport, has an annual influx of new residents from many other parts of the country. This trend is true of Your State in general.
Many new residents, as well as many existing ones, are members of clubs in other markets. The Nightclub is a place for all. The enabling technology will be an inherent part of The Nightclub’s image.
Advertising budgets and event promotion are ongoing processes of management geared to promote the brand name and keep the Nightclub at the forefront of the dance theme establishments in Waldport’s marketing area.
We depend on radio advertising as our main way to reach new customers. Our strategies and practices will remain constant, as will the way we promote ourselves:
- Advertising — We’ll be developing a core positioning message.
- Grand Opening — We will concentrate a substantial portion of our early advertising budget towards the ‘Grand Opening Event.’
- Direct Marketing — We’ll directly market to local hotels surrounding the powers and the local airport.
The Nightclub will create an identity-oriented marketing strategy with executions particularly in radio media, alongside print ads, and in-store promotions.
A grand opening event will be held to launch The Nightclub in the summer of 2001. A radio advertising blitz will precede the event for three weeks, with ambiguous teasers about an “event like no other” in the city’s history and the forthcoming opening date. Contests will be held on the target radio stations giving away V.I.P. passes (coupons) to the event while at the same time, creating excitement about the opening. We will leverage our relationship with the Dallas Cowboy Cheerleaders to be present on the night of the grand opening. The opening date is tentative at this point and dependent upon construction completion. The budget for the event will be $10,000, and the milestone date will parallel the available opening date, currently June of 2001.
Achievement of the following campaigns will be measured by the polling of customers as to how they heard of The Nightclub for the first ninety days of operation. Budget adjustments will be made as the results dictate.
We will be running regular local radio and newspaper ads to create brand awareness. Our radio ads will be concentrated strongly on Magic FM, the city’s top radio station among our target market segments. Through commercial repetition, a teaser campaign, and the use of catchy phrases, we hope to obtain intellectual ownership of our target market segments: when they think dance club and bar they’ll have to think the Nightclub. Drink specials will also be staples of our radio advertising in order to bring people in. HK will be responsible for ongoing radio ads with a monthly budget of $12,000 per month for the first ninety days, followed by an ongoing budget of $6500 per month.
We will advertise directly to local hotel guests in the local airport and surrounding the Boulevard areas to attract business travelers and tourists with no knowledge of where to go in the evening. Through the use of fliers and table tents to place in hotel rooms, we hope to create visitor awareness of our location and event promotion. Promos such as ‘show your room key and get a free drink’ in conjunction with the room ads would be relatively inexpensive from an advertising standpoint and requires limited ongoing maintenance and expense. BK will be responsible for direct advertising with a start-up budget of $3,000 and a maintenance budget of $1,000 per month. The milestone date will be thirty days after the grand opening event.
Ads will also go into the college newspapers for the local campuses of Your State College and the University of Your State. HK will be responsible for this program. The monthly budget for these ads will be $300. The event date will be in tandem with the grand opening.
Shirts, ball caps, and bumper stickers bearing the Nightclub’s logo will be marketed, as well as given away as prizes, in order to further spread brand awareness. Artistic design will be HK’s responsibility and merchandising will be headed by DD. A start-up budget of $1800 will be in place and a monthly promotional (giveaway) budget will also exist.
5.2 Sales Strategy
Sales projections for this plan are presented in the following topics.
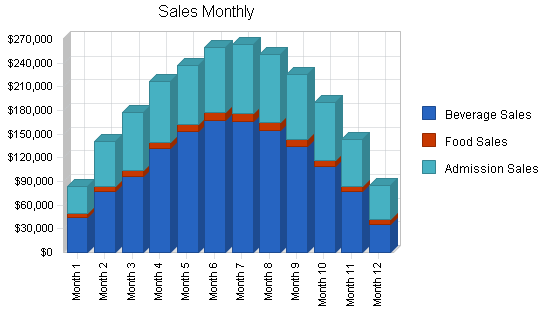
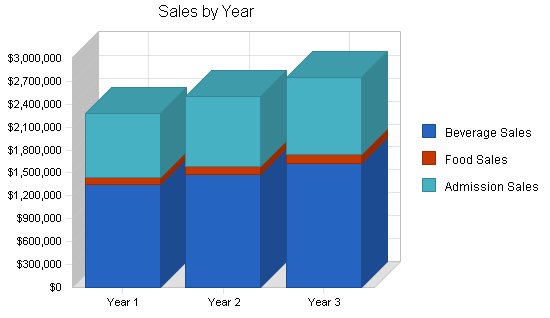
5.2.1 Sales Forecast
This chart represents our forecast for Income on a monthly basis. The table presents yearly expected sales. Complete monthly forecast figures for the first year are presented in the appendix.
| Sales Forecast | |||
| Year 1 | Year 2 | Year 3 | |
| Sales | |||
| Beverage Sales | $1,346,100 | $1,480,710 | $1,628,781 |
| Food Sales | $93,500 | $102,850 | $113,135 |
| Admission Sales | $836,740 | $920,414 | $1,012,455 |
| Total Sales | $2,276,340 | $2,503,974 | $2,754,371 |
| Direct Cost of Sales | Year 1 | Year 2 | Year 3 |
| Beverage Sales | $336,525 | $370,178 | $407,196 |
| Food Sales | $30,855 | $33,941 | $37,335 |
| Admission Sales | $0 | $0 | $0 |
| Subtotal Direct Cost of Sales | $367,380 | $404,119 | $444,531 |
5.2.2 Daily Revenue Forcast
This table illustrates our daily revenue forecast for X,xxx total square feet.
We are assuming a seating capacity for said space of XXX guests. In addition, we expect just less than one complete rotation of this space for food and beverage guests alike.
|
Daily Revenue Breakdown ** |
Mon | Tue | Wed | Thu | Fri | Sat | Sun | Weekly |
| Total Guests Charged Admission | 0 | 0 | 325 | 475 | 675 | 775 | 0 | 2,250 |
| Average Admission Fee | $7 | $7 | $7 | $10 | $10 | $10 | $7 | $9.57 |
| Total Admission Sales | $0 | $0 | $2,275 | $4,750 | $6,750 | $7,750 | $0 | $21,525 |
| Total Bar Guests | 0 | 0 | 350 | 550 | 775 | 1,100 | 0 | 2,775 |
| Average Drinks per Person | 0 | 3 | 3 | 3 | 3 | 3 | 3 | 3.25 |
| Average Beverage Sales per Guest | $12.50 | $12.50 | $10.00 | $12.50 | $12.50 | $12.50 | $12.50 | $12.18 |
| Average Price per Drink | $0 | $3.75 | $3.75 | $3.75 | $3.75 | $3.75 | $3.75 | $3.75 |
| Total Beverage Sales | $0 | $0 | $3,500 | $6,875 | $9,688 | $13,750 | $0 | $33,812 |
| Total Admission and Beverage Sales | $0 | $0 | $5,775 | $11,625 | $16,438 | $21,500 | $0 | $55,337 |
| Total Food Guests | 0 | 0 | 30 | 50 | 70 | 100 | 0 | 250 |
| Average Food Sales per Guest | $5.00 | $5.00 | $7.50 | $7.50 | $7.50 | $7.50 | $5.00 | $45.00 |
| Total Food Sales | $0 | $0 | $225 | $375 | $525 | $750 | $0 | $1,875 |
| Misc. Sales (10% of Gross Sales) | $0 | $0 | $578 | $1,163 | $1,644 | $2,150 | $0 | $5,533 |
| Total Revenue | $0 | $0 | $6,578 | $13,163 | $18,606 | $24,400 | $0 | $62,746 |
**based on 750-person capacity
Management Summary
The management team is an especially close one. One of the presidents has been married to the vice president for seven years. The two co-presidents have worked directly together for three and a half years at four positions. One of the presidents has worked with the bar manager in the past and has known him for nearly ten years. Together we share a single vision: to provide a unique and entertaining experience through exceptional service.
The company will have six managers, including the two presidents, and three managers who have yet to be recruited.
6.1 Management Team
DD, Co-President. D has a bachelors degree in business management, five years management in the restaurant/bar business, consultative experience opening other bars, six subsequent years management in the car industry ending currently with his current position as department manager. D’s specific responsibilities will lie primarily with the coordination of events and oversight of the operations and evening activities of the restaurant and bar.
BK, Co-President. B is pursuing a life-long ambition of restaurant/nightclub ownership. Three years of restaurant kitchen experience and nearly eight years of experience managing people ending with three and a half years of finance management. B is committed to not only creating a successful business but also successfully running it. Even though his hands-on experience in business management is extensive through the finance business, he has spent the last year and a half researching business and business ownership in his spare time. B’s specific responsibilities will be administrative management to include inventory management, accounts payable, purchasing, payroll, and public relations with limited marketing involvement (mostly direct) to other companies.
HK, Vice President. H has a bachelor’s degree in industrial media management. Her experience ranges from radio marketing sales to three years as a financial analyst for L3 Communications. H is a born leader to whom people of all levels flock. H’s responsibilities will be limited to marketing with local radio and newspaper and her day-to-day role in the restaurant will be a mostly silent one.
MC, Bar Manager. M has more than fifteen years bartending and bar management experience. M is eagerly awaiting the opportunity to work at a restaurant/bar where things are done correctly and the customer is put first. In addition to managing the bar, its personnel, and the djs, M will also be third in command under the two co-presidents.
The positions of office, kitchen and dining room managers have yet to be filled at this time. These positions will be openly sought along with the remainder of the staff.
6.2 Management Team Gaps
We believe we have a solid team constructed in order to cover the main points of the business plan. Management growth through training will be an ongoing component of The Nightclub’s priorities.
However, we do realize that we may not have the hands on specific knowledge that may be required to execute pre-opening and opening phases of the venture. We also realize that we may benefit greatly from the retention of a hospitality industry consultant to guide us through the aforementioned time frames, as well as to consult with us through the first two years of our operation.
To this end we have contracted with a hospitality industry specialist consultant. His involvement will exist in several facets, most notably, through providing assistance in launching this venue. This consultant has over 12 years of experience in the hospitality industry and has assisted many first-time operators in getting their proposed venues launched successfully. They will assist in the development of the design, concept, and strategies of the new business. In addition, they will assist in the hiring process of the management staff, DJs, bartenders, waitresses, and security staff. They will also provide educational services for management-level personnel who will be responsible for the day-to-day operations of the club.
Interviews for a general manager, operations manager, and all other personnel will be conducted with the assistance of the consultant. The co-presidents, Mr. D and Mr. K, will make final decisions for each position.
These gaps will be filled as the opening date draws closer.
6.3 Personnel Plan
The Personnel Plan reflects the objective of providing an ample amount of service personnel. Our headcount will remain at thirty unless any unforeseen demands dictate otherwise. Assume a burden rate of 17%.
DAILY STAFFING (750-person capacity)
Hourly Employees
| Day | Position | Quantity | Rate | Avg Hrs | Sub-total | Burden | Total |
| Monday | Staff Cost/Mon. | 0 | $0 | 0 | $0 | $0 | $0 |
| – | – | — | – | – | – | – | – |
| Tuesday | Staff Cost/Tues. | – | – | – | $0 | $0 | $0 |
| – | – | — | – | – | – | – | – |
| Wednesday | Waitress | 2 | $5.00 | 7.5 | $75 | – | – |
| – | Security | 4 | $7.00 | 6.5 | $195 | – | – |
| – | Bartender | 2 | $5.00 | 7.5 | $75 | – | – |
| – | Barback | 1 | $4.50 | 7 | $31 | – | – |
| – | Police Detail | 1 | $15.00 | 0 | $0 | – | – |
| – | Misc. | – | $8.00 | 0 | $0 | – | – |
| – | Staff Cost/Wed. | – | – | – | $376 | $64 | $441 |
| – | – | – | – | – | – | – | – |
| Thursday | Waitress | 3 | $5.00 | 7.5 | $113 | – | – |
| – | Security | 5 | $7.50 | 6.5 | $244 | – | – |
| – | Bartender | 3 | $5.00 | 7.5 | $113 | – | – |
| – | Barback | 1.5 | $4.50 | 7 | $47 | – | – |
| – | Police Detail | 0 | $15.00 | 0 | $0 | – | – |
| – | Misc. | 0 | $15.00 | 0 | $0 | – | – |
| – | Staff Cost/Thur. | – | – | – | $516 | $88 | $604 |
| – | – | – | – | – | – | – | – |
| Friday | Waitress | 4 | $5.00 | 7.5 | $150 | – | – |
| – | Security | 7 | $7.50 | 6.5 | $341 | – | – |
| – | Bartender | 4 | $5.00 | 7.5 | $150 | – | – |
| – | Barback | 2 | $4.50 | 7 | $63 | – | – |
| – | Police Detail | 0 | $15.00 | 0 | $0 | – | – |
| – | Misc. | 0 | $15.00 | 0 | $0 | – | – |
| – | Staff Cost/Fri. | – | – | – | $704 | $120 | $824 |
| – | – | – | – | – | – | – | – |
| Saturday | Waitress | 4 | $5.00 | 7.5 | $150 | – | – |
| – | Security | 9 | $7.50 | 6.5 | $439 | – | – |
| – | Bartender | 5 | $5.00 | 7.5 | $188 | – | – |
| – | Barback | 2 | $4.50 | 7 | $63 | – | – |
| – | Police Detail | 0 | $15.00 | 0 | $0 | – | – |
| – | Misc. | 0 | $15.00 | 0 | $0 | – | – |
| – | Staff Cost/Sat. | – | – | – | $839 | $143 | $982 |
| – | – | – | – | – | – | – | – |
| Sunday | Staff Cost/Sun. | 0 | $0 | 0 | $0 | $0 | $0 |
| Ttl Wkly/Hrly | – | – | – | – | $2,436 | $414 | $2,850 |
Salaried Staff
| Position | Salary | Yearly | Weekly | Burden | Total |
| Manager #1 | Oper Prtnr | $55,000 | $877 | $179 | – |
| Manager #2 | Oper Prtnr | $55,000 | $877 | $179 | – |
| Manager #3 | General Mgr | $50,000 | $798 | $163 | – |
| Manager #4 | PR Mgr | $45,000 | $718 | $147 | – |
| Manager #5 | Bar Mgr | $35,000 | $558 | $114 | – |
| Manager #6 | Asst. | $25,000 | $399 | $81 | – |
| Entertainmnt | DJ | $65,000 | – | – | – |
| Ttl Salaried | – | – | $5,480 | $866 | $6,346 |
| Ttl Weekly Staff | – | – | – | – | $9,196 |
| Personnel Plan | |||
| Year 1 | Year 2 | Year 3 | |
| Salaried Staff | $284,736 | $298,968 | $313,916 |
| Hourly Staff | $107,200 | $112,560 | $118,188 |
| Total People | 0 | 0 | 0 |
| Total Payroll | $391,936 | $411,528 | $432,104 |
Financial Plan
The financial projections for this plan are presented in the tables and charts of the following subtopics.
7.1 Important Assumptions
The financial plan depends on important assumptions, most of which are illustrated in the following table.
The key underlying assumptions are:
- We assume a slow-growth economy of five percent the first year, and three percent thereafter, without major recession.
- We assume that we will grow as managers during the process, this growth will manifest itself as flat line expense growth over the five-year period, leading to increased annual cash flow.
- We assume access to equity capital and financing sufficient to maintain our financial plan as shown in the tables.
- We assume continued popularity of nightclubs in America and the growing demand for high-energy themed and casual dining venues.
| General Assumptions | |||
| Year 1 | Year 2 | Year 3 | |
| Plan Month | 1 | 2 | 3 |
| Current Interest Rate | 10.00% | 10.00% | 10.00% |
| Long-term Interest Rate | 10.00% | 10.00% | 10.00% |
| Tax Rate | 25.42% | 25.00% | 25.42% |
| Other | 0 | 0 | 0 |
7.2 Break-even Analysis
Example Break-Even Analysis formulas are presented in the text below. Business Plan Pro’s interactive table and chart are still linked to the program spreadsheets.
Fixed Costs $X,xxx,xxx
Variable Costs $Xxx,xxx
Revenue (Estimated)$X,xxx,xxx
*S = Gross Sales
S = $ + [($Xxx,xxx/ $X,xxx,xxx) x S]
S = $X,xxx,xxx + [(.xxxx) x S]
S = $X,xxx,xxx
Break Even Point = $X,xxx,xxx
Average Nightly Break Even Revenues – approximately $ X,xxx
Minimum Nightly Required Spending Per Person – $8.75 + $9.75 = $18.50
Minimum Nightly Required Incoming Traffic – Xxx

| Break-even Analysis | |
| Monthly Revenue Break-even | $140,703 |
| Assumptions: | |
| Average Percent Variable Cost | 16% |
| Estimated Monthly Fixed Cost | $117,995 |
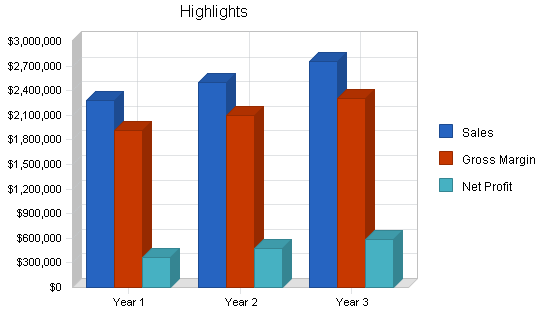
7.3 Projected Profit and Loss
Projected profit and loss statement for the nightclub follows. Three years’ annual totals are shown below. Monthly breakdown for year one appears in the appendix.


| Pro Forma Profit and Loss | |||
| Year 1 | Year 2 | Year 3 | |
| Sales | $2,276,340 | $2,503,974 | $2,754,371 |
| Direct Cost of Sales | $367,380 | $404,119 | $444,531 |
| Other Production Expenses | $0 | $0 | $0 |
| Total Cost of Sales | $367,380 | $404,119 | $444,531 |
| Gross Margin | $1,908,960 | $2,099,855 | $2,309,840 |
| Gross Margin % | 83.86% | 83.86% | 83.86% |
| Expenses | |||
| Payroll | $391,936 | $411,528 | $432,104 |
| Sales and Marketing and Other Expenses | $411,576 | $430,574 | $451,284 |
| Depreciation | $0 | $0 | $0 |
| Fees–Credit Card | $10,764 | $10,982 | $11,202 |
| Fees–Professional | $7,500 | $7,650 | $7,803 |
| Taxes–Admission | $0 | $0 | $0 |
| Taxes–Excise | $391,536 | $399,368 | $407,355 |
| Taxes–Property | $0 | $0 | $0 |
| Leased Equipment | $2,496 | $2,550 | $2,601 |
| Utilities | $36,000 | $36,720 | $37,454 |
| Insurance | $22,500 | $22,950 | $23,409 |
| Rent | $75,000 | $75,000 | $76,500 |
| Payroll Taxes | $66,629 | $69,960 | $73,458 |
| Other | $0 | $0 | $0 |
| Total Operating Expenses | $1,415,937 | $1,467,282 | $1,523,170 |
| Profit Before Interest and Taxes | $493,023 | $632,573 | $786,670 |
| EBITDA | $493,023 | $632,573 | $786,670 |
| Interest Expense | $0 | $0 | $0 |
| Taxes Incurred | $121,122 | $158,143 | $199,945 |
| Net Profit | $371,901 | $474,430 | $586,725 |
| Net Profit/Sales | 16.34% | 18.95% | 21.30% |
7.4 Projected Cash Flow
The following chart illustrates our monthly cash flow for year one. The table shows three years of annual totals. First year monthly figures as presented in the appendix. The months are weighted according to the amount of weeks in that month in a typical calendar year.

| Pro Forma Cash Flow | |||
| Year 1 | Year 2 | Year 3 | |
| Cash Received | |||
| Cash from Operations | |||
| Cash Sales | $2,048,706 | $2,253,577 | $2,478,934 |
| Cash from Receivables | $205,193 | $248,153 | $272,969 |
| Subtotal Cash from Operations | $2,253,899 | $2,501,730 | $2,751,903 |
| Additional Cash Received | |||
| Sales Tax, VAT, HST/GST Received | $0 | $0 | $0 |
| New Current Borrowing | $0 | $0 | $0 |
| New Other Liabilities (interest-free) | $0 | $0 | $0 |
| New Long-term Liabilities | $0 | $0 | $0 |
| Sales of Other Current Assets | $0 | $0 | $0 |
| Sales of Long-term Assets | $0 | $0 | $0 |
| New Investment Received | $0 | $0 | $0 |
| Subtotal Cash Received | $2,253,899 | $2,501,730 | $2,751,903 |
| Expenditures | Year 1 | Year 2 | Year 3 |
| Expenditures from Operations | |||
| Cash Spending | $391,936 | $411,528 | $432,104 |
| Bill Payments | $1,445,416 | $1,583,120 | $1,731,944 |
| Subtotal Spent on Operations | $1,837,352 | $1,994,648 | $2,164,048 |
| Additional Cash Spent | |||
| Sales Tax, VAT, HST/GST Paid Out | $0 | $0 | $0 |
| Principal Repayment of Current Borrowing | $0 | $0 | $0 |
| Other Liabilities Principal Repayment | $0 | $0 | $0 |
| Long-term Liabilities Principal Repayment | $0 | $0 | $0 |
| Purchase Other Current Assets | $0 | $0 | $0 |
| Purchase Long-term Assets | $0 | $0 | $0 |
| Dividends | $0 | $0 | $0 |
| Subtotal Cash Spent | $1,837,352 | $1,994,648 | $2,164,048 |
| Net Cash Flow | $416,547 | $507,082 | $587,855 |
| Cash Balance | $491,547 | $998,629 | $1,586,484 |
7.5 Projected Balance Sheet
The following Balance Sheet indicates healthy growth of net worth and a strong financial position. The monthly estimates are included in the appendix.
| Pro Forma Balance Sheet | |||
| Year 1 | Year 2 | Year 3 | |
| Assets | |||
| Current Assets | |||
| Cash | $491,547 | $998,629 | $1,586,484 |
| Accounts Receivable | $22,441 | $24,685 | $27,153 |
| Inventory | $12,653 | $40,820 | $44,902 |
| Other Current Assets | $0 | $0 | $0 |
| Total Current Assets | $526,640 | $1,064,134 | $1,658,539 |
| Long-term Assets | |||
| Long-term Assets | $0 | $0 | $0 |
| Accumulated Depreciation | $0 | $0 | $0 |
| Total Long-term Assets | $0 | $0 | $0 |
| Total Assets | $526,640 | $1,064,134 | $1,658,539 |
| Liabilities and Capital | Year 1 | Year 2 | Year 3 |
| Current Liabilities | |||
| Accounts Payable | $72,239 | $135,303 | $142,983 |
| Current Borrowing | $0 | $0 | $0 |
| Other Current Liabilities | $0 | $0 | $0 |
| Subtotal Current Liabilities | $72,239 | $135,303 | $142,983 |
| Long-term Liabilities | $0 | $0 | $0 |
| Total Liabilities | $72,239 | $135,303 | $142,983 |
| Paid-in Capital | $567,750 | $567,750 | $567,750 |
| Retained Earnings | ($485,250) | ($113,349) | $361,081 |
| Earnings | $371,901 | $474,430 | $586,725 |
| Total Capital | $454,401 | $928,831 | $1,515,556 |
| Total Liabilities and Capital | $526,640 | $1,064,134 | $1,658,539 |
| Net Worth | $454,401 | $928,831 | $1,515,556 |
7.6 Business Ratios
The Ratios table below outlines important ratios for this Nightclub. The last column, Industry Profile, is derived from the Standard Industrial Classification (SIC) Index code 5813, for Drinking Places.
| Ratio Analysis | ||||
| Year 1 | Year 2 | Year 3 | Industry Profile | |
| Sales Growth | n.a. | 10.00% | 10.00% | 1.90% |
| Percent of Total Assets | ||||
| Accounts Receivable | 4.26% | 2.32% | 1.64% | 4.60% |
| Inventory | 2.40% | 3.84% | 2.71% | 3.10% |
| Other Current Assets | 0.00% | 0.00% | 0.00% | 44.60% |
| Total Current Assets | 100.00% | 100.00% | 100.00% | 52.30% |
| Long-term Assets | 0.00% | 0.00% | 0.00% | 47.70% |
| Total Assets | 100.00% | 100.00% | 100.00% | 100.00% |
| Current Liabilities | 13.72% | 12.71% | 8.62% | 28.20% |
| Long-term Liabilities | 0.00% | 0.00% | 0.00% | 23.10% |
| Total Liabilities | 13.72% | 12.71% | 8.62% | 51.30% |
| Net Worth | 86.28% | 87.29% | 91.38% | 48.70% |
| Percent of Sales | ||||
| Sales | 100.00% | 100.00% | 100.00% | 100.00% |
| Gross Margin | 83.86% | 83.86% | 83.86% | 42.30% |
| Selling, General & Administrative Expenses | 67.36% | 64.67% | 62.20% | 23.40% |
| Advertising Expenses | 8.79% | 8.39% | 8.01% | 2.40% |
| Profit Before Interest and Taxes | 21.66% | 25.26% | 28.56% | 2.80% |
| Main Ratios | ||||
| Current | 7.29 | 7.86 | 11.60 | 1.14 |
| Quick | 7.12 | 7.56 | 11.29 | 0.74 |
| Total Debt to Total Assets | 13.72% | 12.71% | 8.62% | 51.30% |
| Pre-tax Return on Net Worth | 108.50% | 68.10% | 51.91% | 5.20% |
| Pre-tax Return on Assets | 93.62% | 59.44% | 47.43% | 10.60% |
| Additional Ratios | Year 1 | Year 2 | Year 3 | |
| Net Profit Margin | 16.34% | 18.95% | 21.30% | n.a |
| Return on Equity | 81.84% | 51.08% | 38.71% | n.a |
| Activity Ratios | ||||
| Accounts Receivable Turnover | 10.14 | 10.14 | 10.14 | n.a |
| Collection Days | 59 | 34 | 34 | n.a |
| Inventory Turnover | 10.89 | 15.12 | 10.37 | n.a |
| Accounts Payable Turnover | 21.01 | 12.17 | 12.17 | n.a |
| Payment Days | 27 | 23 | 29 | n.a |
| Total Asset Turnover | 4.32 | 2.35 | 1.66 | n.a |
| Debt Ratios | ||||
| Debt to Net Worth | 0.16 | 0.15 | 0.09 | n.a |
| Current Liab. to Liab. | 1.00 | 1.00 | 1.00 | n.a |
| Liquidity Ratios | ||||
| Net Working Capital | $454,401 | $928,831 | $1,515,556 | n.a |
| Interest Coverage | 0.00 | 0.00 | 0.00 | n.a |
| Additional Ratios | ||||
| Assets to Sales | 0.23 | 0.42 | 0.60 | n.a |
| Current Debt/Total Assets | 14% | 13% | 9% | n.a |
| Acid Test | 6.80 | 7.38 | 11.10 | n.a |
| Sales/Net Worth | 5.01 | 2.70 | 1.82 | n.a |
| Dividend Payout | 0.00 | 0.00 | 0.00 | n.a |
Appendix
| Sales Forecast | |||||||||||||
| Month 1 | Month 2 | Month 3 | Month 4 | Month 5 | Month 6 | Month 7 | Month 8 | Month 9 | Month 10 | Month 11 | Month 12 | ||
| Sales | |||||||||||||
| Beverage Sales | 0% | $44,600 | $77,100 | $96,300 | $131,700 | $152,800 | $167,100 | $165,700 | $155,200 | $134,900 | $108,500 | $76,800 | $35,400 |
| Food Sales | 0% | $4,900 | $6,300 | $7,100 | $7,900 | $9,100 | $9,900 | $10,000 | $9,400 | $8,700 | $7,500 | $6,600 | $6,100 |
| Admission Sales | 0% | $34,100 | $56,800 | $74,600 | $76,900 | $75,100 | $82,900 | $88,440 | $87,000 | $82,400 | $74,200 | $60,400 | $43,900 |
| Total Sales | $83,600 | $140,200 | $178,000 | $216,500 | $237,000 | $259,900 | $264,140 | $251,600 | $226,000 | $190,200 | $143,800 | $85,400 | |
| Direct Cost of Sales | Month 1 | Month 2 | Month 3 | Month 4 | Month 5 | Month 6 | Month 7 | Month 8 | Month 9 | Month 10 | Month 11 | Month 12 | |
| Beverage Sales | 25% | $11,150 | $19,275 | $24,075 | $32,925 | $38,200 | $41,775 | $41,425 | $38,800 | $33,725 | $27,125 | $19,200 | $8,850 |
| Food Sales | 33% | $1,617 | $2,079 | $2,343 | $2,607 | $3,003 | $3,267 | $3,300 | $3,102 | $2,871 | $2,475 | $2,178 | $2,013 |
| Admission Sales | $0 | $0 | $0 | $0 | $0 | $0 | $0 | $0 | $0 | $0 | $0 | $0 | |
| Subtotal Direct Cost of Sales | $12,767 | $21,354 | $26,418 | $35,532 | $41,203 | $45,042 | $44,725 | $41,902 | $36,596 | $29,600 | $21,378 | $10,863 | |
| Personnel Plan | |||||||||||||
| Month 1 | Month 2 | Month 3 | Month 4 | Month 5 | Month 6 | Month 7 | Month 8 | Month 9 | Month 10 | Month 11 | Month 12 | ||
| Salaried Staff | 0% | $23,728 | $23,728 | $23,728 | $23,728 | $23,728 | $23,728 | $23,728 | $23,728 | $23,728 | $23,728 | $23,728 | $23,728 |
| Hourly Staff | 0% | $5,100 | $8,700 | $9,400 | $9,500 | $9,900 | $10,600 | $10,900 | $10,700 | $9,500 | $8,500 | $7,600 | $6,800 |
| Total People | 0 | 0 | 0 | 0 | 0 | 0 | 0 | 0 | 0 | 0 | 0 | 0 | |
| Total Payroll | $28,828 | $32,428 | $33,128 | $33,228 | $33,628 | $34,328 | $34,628 | $34,428 | $33,228 | $32,228 | $31,328 | $30,528 | |
| General Assumptions | |||||||||||||
| Month 1 | Month 2 | Month 3 | Month 4 | Month 5 | Month 6 | Month 7 | Month 8 | Month 9 | Month 10 | Month 11 | Month 12 | ||
| Plan Month | 1 | 2 | 3 | 4 | 5 | 6 | 7 | 8 | 9 | 10 | 11 | 12 | |
| Current Interest Rate | 10.00% | 10.00% | 10.00% | 10.00% | 10.00% | 10.00% | 10.00% | 10.00% | 10.00% | 10.00% | 10.00% | 10.00% | |
| Long-term Interest Rate | 10.00% | 10.00% | 10.00% | 10.00% | 10.00% | 10.00% | 10.00% | 10.00% | 10.00% | 10.00% | 10.00% | 10.00% | |
| Tax Rate | 30.00% | 25.00% | 25.00% | 25.00% | 25.00% | 25.00% | 25.00% | 25.00% | 25.00% | 25.00% | 25.00% | 25.00% | |
| Other | 0 | 0 | 0 | 0 | 0 | 0 | 0 | 0 | 0 | 0 | 0 | 0 | |
| Pro Forma Profit and Loss | |||||||||||||
| Month 1 | Month 2 | Month 3 | Month 4 | Month 5 | Month 6 | Month 7 | Month 8 | Month 9 | Month 10 | Month 11 | Month 12 | ||
| Sales | $83,600 | $140,200 | $178,000 | $216,500 | $237,000 | $259,900 | $264,140 | $251,600 | $226,000 | $190,200 | $143,800 | $85,400 | |
| Direct Cost of Sales | $12,767 | $21,354 | $26,418 | $35,532 | $41,203 | $45,042 | $44,725 | $41,902 | $36,596 | $29,600 | $21,378 | $10,863 | |
| Other Production Expenses | $0 | $0 | $0 | $0 | $0 | $0 | $0 | $0 | $0 | $0 | $0 | $0 | |
| Total Cost of Sales | $12,767 | $21,354 | $26,418 | $35,532 | $41,203 | $45,042 | $44,725 | $41,902 | $36,596 | $29,600 | $21,378 | $10,863 | |
| Gross Margin | $70,833 | $118,846 | $151,582 | $180,968 | $195,797 | $214,858 | $219,415 | $209,698 | $189,404 | $160,600 | $122,422 | $74,537 | |
| Gross Margin % | 84.73% | 84.77% | 85.16% | 83.59% | 82.61% | 82.67% | 83.07% | 83.35% | 83.81% | 84.44% | 85.13% | 87.28% | |
| Expenses | |||||||||||||
| Payroll | $28,828 | $32,428 | $33,128 | $33,228 | $33,628 | $34,328 | $34,628 | $34,428 | $33,228 | $32,228 | $31,328 | $30,528 | |
| Sales and Marketing and Other Expenses | $34,298 | $34,298 | $34,298 | $34,298 | $34,298 | $34,298 | $34,298 | $34,298 | $34,298 | $34,298 | $34,298 | $34,298 | |
| Depreciation | $0 | $0 | $0 | $0 | $0 | $0 | $0 | $0 | $0 | $0 | $0 | $0 | |
| Fees–Credit Card | $897 | $897 | $897 | $897 | $897 | $897 | $897 | $897 | $897 | $897 | $897 | $897 | |
| Fees–Professional | $625 | $625 | $625 | $625 | $625 | $625 | $625 | $625 | $625 | $625 | $625 | $625 | |
| Taxes–Admission | $0 | $0 | $0 | $0 | $0 | $0 | $0 | $0 | $0 | $0 | $0 | $0 | |
| Taxes–Excise | $32,628 | $32,628 | $32,628 | $32,628 | $32,628 | $32,628 | $32,628 | $32,628 | $32,628 | $32,628 | $32,628 | $32,628 | |
| Taxes–Property | $0 | $0 | $0 | $0 | $0 | $0 | $0 | $0 | $0 | $0 | $0 | $0 | |
| Leased Equipment | $208 | $208 | $208 | $208 | $208 | $208 | $208 | $208 | $208 | $208 | $208 | $208 | |
| Utilities | $3,000 | $3,000 | $3,000 | $3,000 | $3,000 | $3,000 | $3,000 | $3,000 | $3,000 | $3,000 | $3,000 | $3,000 | |
| Insurance | $1,875 | $1,875 | $1,875 | $1,875 | $1,875 | $1,875 | $1,875 | $1,875 | $1,875 | $1,875 | $1,875 | $1,875 | |
| Rent | $6,250 | $6,250 | $6,250 | $6,250 | $6,250 | $6,250 | $6,250 | $6,250 | $6,250 | $6,250 | $6,250 | $6,250 | |
| Payroll Taxes | 17% | $4,901 | $5,513 | $5,632 | $5,649 | $5,717 | $5,836 | $5,887 | $5,853 | $5,649 | $5,479 | $5,326 | $5,190 |
| Other | $0 | $0 | $0 | $0 | $0 | $0 | $0 | $0 | $0 | $0 | $0 | $0 | |
| Total Operating Expenses | $113,510 | $117,722 | $118,541 | $118,658 | $119,126 | $119,945 | $120,296 | $120,062 | $118,658 | $117,488 | $116,435 | $115,499 | |
| Profit Before Interest and Taxes | ($42,677) | $1,124 | $33,041 | $62,310 | $76,671 | $94,913 | $99,119 | $89,636 | $70,746 | $43,112 | $5,987 | ($40,962) | |
| EBITDA | ($42,677) | $1,124 | $33,041 | $62,310 | $76,671 | $94,913 | $99,119 | $89,636 | $70,746 | $43,112 | $5,987 | ($40,962) | |
| Interest Expense | $0 | $0 | $0 | $0 | $0 | $0 | $0 | $0 | $0 | $0 | $0 | $0 | |
| Taxes Incurred | ($12,803) | $281 | $8,260 | $15,578 | $19,168 | $23,728 | $24,780 | $22,409 | $17,687 | $10,778 | $1,497 | ($10,240) | |
| Net Profit | ($29,874) | $843 | $24,781 | $46,733 | $57,503 | $71,185 | $74,339 | $67,227 | $53,060 | $32,334 | $4,490 | ($30,721) | |
| Net Profit/Sales | -35.73% | 0.60% | 13.92% | 21.59% | 24.26% | 27.39% | 28.14% | 26.72% | 23.48% | 17.00% | 3.12% | -35.97% | |
| Pro Forma Cash Flow | |||||||||||||
| Month 1 | Month 2 | Month 3 | Month 4 | Month 5 | Month 6 | Month 7 | Month 8 | Month 9 | Month 10 | Month 11 | Month 12 | ||
| Cash Received | |||||||||||||
| Cash from Operations | |||||||||||||
| Cash Sales | $75,240 | $126,180 | $160,200 | $194,850 | $213,300 | $233,910 | $237,726 | $226,440 | $203,400 | $171,180 | $129,420 | $76,860 | |
| Cash from Receivables | $0 | $279 | $8,549 | $14,146 | $17,928 | $21,718 | $23,776 | $26,004 | $26,372 | $25,075 | $22,481 | $18,865 | |
| Subtotal Cash from Operations | $75,240 | $126,459 | $168,749 | $208,996 | $231,228 | $255,628 | $261,502 | $252,444 | $229,772 | $196,255 | $151,901 | $95,725 | |
| Additional Cash Received | |||||||||||||
| Sales Tax, VAT, HST/GST Received | 0.00% | $0 | $0 | $0 | $0 | $0 | $0 | $0 | $0 | $0 | $0 | $0 | $0 |
| New Current Borrowing | $0 | $0 | $0 | $0 | $0 | $0 | $0 | $0 | $0 | $0 | $0 | $0 | |
| New Other Liabilities (interest-free) | $0 | $0 | $0 | $0 | $0 | $0 | $0 | $0 | $0 | $0 | $0 | $0 | |
| New Long-term Liabilities | $0 | $0 | $0 | $0 | $0 | $0 | $0 | $0 | $0 | $0 | $0 | $0 | |
| Sales of Other Current Assets | $0 | $0 | $0 | $0 | $0 | $0 | $0 | $0 | $0 | $0 | $0 | $0 | |
| Sales of Long-term Assets | $0 | $0 | $0 | $0 | $0 | $0 | $0 | $0 | $0 | $0 | $0 | $0 | |
| New Investment Received | $0 | $0 | $0 | $0 | $0 | $0 | $0 | $0 | $0 | $0 | $0 | $0 | |
| Subtotal Cash Received | $75,240 | $126,459 | $168,749 | $208,996 | $231,228 | $255,628 | $261,502 | $252,444 | $229,772 | $196,255 | $151,901 | $95,725 | |
| Expenditures | Month 1 | Month 2 | Month 3 | Month 4 | Month 5 | Month 6 | Month 7 | Month 8 | Month 9 | Month 10 | Month 11 | Month 12 | |
| Expenditures from Operations | |||||||||||||
| Cash Spending | $28,828 | $32,428 | $33,128 | $33,228 | $33,628 | $34,328 | $34,628 | $34,428 | $33,228 | $32,228 | $31,328 | $30,528 | |
| Bill Payments | $3,040 | $92,029 | $116,684 | $126,358 | $146,749 | $152,323 | $158,484 | $154,558 | $146,407 | $133,345 | $117,309 | $98,130 | |
| Subtotal Spent on Operations | $31,868 | $124,457 | $149,812 | $159,586 | $180,377 | $186,651 | $193,112 | $188,986 | $179,635 | $165,573 | $148,637 | $128,658 | |
| Additional Cash Spent | |||||||||||||
| Sales Tax, VAT, HST/GST Paid Out | $0 | $0 | $0 | $0 | $0 | $0 | $0 | $0 | $0 | $0 | $0 | $0 | |
| Principal Repayment of Current Borrowing | $0 | $0 | $0 | $0 | $0 | $0 | $0 | $0 | $0 | $0 | $0 | $0 | |
| Other Liabilities Principal Repayment | $0 | $0 | $0 | $0 | $0 | $0 | $0 | $0 | $0 | $0 | $0 | $0 | |
| Long-term Liabilities Principal Repayment | $0 | $0 | $0 | $0 | $0 | $0 | $0 | $0 | $0 | $0 | $0 | $0 | |
| Purchase Other Current Assets | $0 | $0 | $0 | $0 | $0 | $0 | $0 | $0 | $0 | $0 | $0 | $0 | |
| Purchase Long-term Assets | $0 | $0 | $0 | $0 | $0 | $0 | $0 | $0 | $0 | $0 | $0 | $0 | |
| Dividends | $0 | $0 | $0 | $0 | $0 | $0 | $0 | $0 | $0 | $0 | $0 | $0 | |
| Subtotal Cash Spent | $31,868 | $124,457 | $149,812 | $159,586 | $180,377 | $186,651 | $193,112 | $188,986 | $179,635 | $165,573 | $148,637 | $128,658 | |
| Net Cash Flow | $43,372 | $2,002 | $18,937 | $49,410 | $50,851 | $68,977 | $68,391 | $63,458 | $50,137 | $30,682 | $3,264 | ($32,933) | |
| Cash Balance | $118,372 | $120,374 | $139,311 | $188,720 | $239,571 | $308,548 | $376,939 | $440,397 | $490,534 | $521,216 | $524,480 | $491,547 | |
| Pro Forma Balance Sheet | |||||||||||||
| Month 1 | Month 2 | Month 3 | Month 4 | Month 5 | Month 6 | Month 7 | Month 8 | Month 9 | Month 10 | Month 11 | Month 12 | ||
| Assets | Starting Balances | ||||||||||||
| Current Assets | |||||||||||||
| Cash | $75,000 | $118,372 | $120,374 | $139,311 | $188,720 | $239,571 | $308,548 | $376,939 | $440,397 | $490,534 | $521,216 | $524,480 | $491,547 |
| Accounts Receivable | $0 | $8,360 | $22,101 | $31,353 | $38,857 | $44,628 | $48,900 | $51,538 | $50,694 | $46,921 | $40,867 | $32,766 | $22,441 |
| Inventory | $7,500 | $14,044 | $23,489 | $29,060 | $39,085 | $45,323 | $49,546 | $49,198 | $46,092 | $40,256 | $32,560 | $23,516 | $12,653 |
| Other Current Assets | $0 | $0 | $0 | $0 | $0 | $0 | $0 | $0 | $0 | $0 | $0 | $0 | $0 |
| Total Current Assets | $82,500 | $140,776 | $165,965 | $199,723 | $266,662 | $329,523 | $406,994 | $477,674 | $537,183 | $577,711 | $594,643 | $580,762 | $526,640 |
| Long-term Assets | |||||||||||||
| Long-term Assets | $0 | $0 | $0 | $0 | $0 | $0 | $0 | $0 | $0 | $0 | $0 | $0 | $0 |
| Accumulated Depreciation | $0 | $0 | $0 | $0 | $0 | $0 | $0 | $0 | $0 | $0 | $0 | $0 | $0 |
| Total Long-term Assets | $0 | $0 | $0 | $0 | $0 | $0 | $0 | $0 | $0 | $0 | $0 | $0 | $0 |
| Total Assets | $82,500 | $140,776 | $165,965 | $199,723 | $266,662 | $329,523 | $406,994 | $477,674 | $537,183 | $577,711 | $594,643 | $580,762 | $526,640 |
| Liabilities and Capital | Month 1 | Month 2 | Month 3 | Month 4 | Month 5 | Month 6 | Month 7 | Month 8 | Month 9 | Month 10 | Month 11 | Month 12 | |
| Current Liabilities | |||||||||||||
| Accounts Payable | $0 | $88,150 | $112,495 | $121,473 | $141,679 | $147,036 | $153,323 | $149,663 | $141,945 | $129,413 | $114,011 | $95,639 | $72,239 |
| Current Borrowing | $0 | $0 | $0 | $0 | $0 | $0 | $0 | $0 | $0 | $0 | $0 | $0 | $0 |
| Other Current Liabilities | $0 | $0 | $0 | $0 | $0 | $0 | $0 | $0 | $0 | $0 | $0 | $0 | $0 |
| Subtotal Current Liabilities | $0 | $88,150 | $112,495 | $121,473 | $141,679 | $147,036 | $153,323 | $149,663 | $141,945 | $129,413 | $114,011 | $95,639 | $72,239 |
| Long-term Liabilities | $0 | $0 | $0 | $0 | $0 | $0 | $0 | $0 | $0 | $0 | $0 | $0 | $0 |
| Total Liabilities | $0 | $88,150 | $112,495 | $121,473 | $141,679 | $147,036 | $153,323 | $149,663 | $141,945 | $129,413 | $114,011 | $95,639 | $72,239 |
| Paid-in Capital | $567,750 | $567,750 | $567,750 | $567,750 | $567,750 | $567,750 | $567,750 | $567,750 | $567,750 | $567,750 | $567,750 | $567,750 | $567,750 |
| Retained Earnings | ($485,250) | ($485,250) | ($485,250) | ($485,250) | ($485,250) | ($485,250) | ($485,250) | ($485,250) | ($485,250) | ($485,250) | ($485,250) | ($485,250) | ($485,250) |
| Earnings | $0 | ($29,874) | ($29,031) | ($4,250) | $42,483 | $99,986 | $171,171 | $245,511 | $312,738 | $365,798 | $398,132 | $402,622 | $371,901 |
| Total Capital | $82,500 | $52,626 | $53,469 | $78,250 | $124,983 | $182,486 | $253,671 | $328,011 | $395,238 | $448,298 | $480,632 | $485,122 | $454,401 |
| Total Liabilities and Capital | $82,500 | $140,776 | $165,965 | $199,723 | $266,662 | $329,523 | $406,994 | $477,674 | $537,183 | $577,711 | $594,643 | $580,762 | $526,640 |
| Net Worth | $82,500 | $52,626 | $53,469 | $78,250 | $124,983 | $182,486 | $253,671 | $328,011 | $395,238 | $448,298 | $480,632 | $485,122 | $454,401 |


