
E3 Playhouse
Executive Summary
The concept of E3 Playhouse (E3) is to provide an entertainment, education, and restaurant venue in downtown Santa Cruz. The establishment will provide a live entertainment venue; a restaurant; community-based courses in music and the arts; a retail component offering arts-based retail merchandise; and venue rental services for the Santa Cruz area.
E3 Playhouse is in a start-up position, with a beginning date of July 2004. The purpose of this business plan is to estimate start-up and ongoing costs; identify revenue streams; and forecast net cash flow and profits. The company expects to lease venue space in June 2004, and have a three-month build-out of the space. We anticipate opening our doors to the public in mid-September. The company is on a July through June fiscal year.
The company CEO is Michael Horne. Michael has extensive experience managing live entertainment venues in the Santa Cruz area, having successfully owned and operated a similar venue for six years. The management team is headed by owner Wes Anthony. As a professional musician and teacher, Wes is uniquely qualified to develop an entertainment and education venue.
The nightclub and bar industry is shifting toward a more entertainment-oriented concept. Guests of these venues are not only offered a dynamic place to gather and mingle, but also a place to participate in the entertainment through interactive contests, theme nights, and other events. We intend to heavily utilize entertainment-oriented marketing in an effort to withstand the perpetual shift in trends and cater to as large a client base as possible.
The venue is a 6,600 square foot complex, which will also house the company’s corporate business office. The dance club and bar will accommodate 200-400 people. The venue will be equipped with state-of-the-art audio, lighting, and video systems, serving the need for a true entertainment venue in Santa Cruz. The general appearance will be clean, open, and pleasing to the customer. The demographics are favorable, with minimal competition from other dance-themed venues and bars.
E3 will generate sales through seven revenue streams that comprise the company’s products and services:
- Membership Fees
- Educational Courses
- Food and Beverage
- Gate/Entertainment
- Retail Merchandise
- Arcade
- Venue Rental
Managing seven separate revenue streams requires ramping up each one individually, ensuring that each area performs well before developing the next revenue stream. In order of importance, Food/Beverage and Gate/Entertainment are expected to provide the most stable revenue streams.
The venue appeals to four major market segments:
- Young Professionals
- College Students
- Tourists and Business Travelers
- Senior Citizens
The E3 Playhouse’s central downtown Santa Cruz location, demographics, and minimum competition are major advantages for the success of the venture. The proposed venue will provide a local solution to the lack of social atmosphere and live entertainment venues in the region.
The purpose of this business plan is to estimate start-up and ongoing costs; identify revenue streams; and forecast net cash flow and profits. Initial start-up and operating capital of $190,260 is provided as paid-in capital by owner Wes Anthony.
The owner’s total investment is $190,260. We anticipate a start-up date of July 2004, with several months build-out of an appropriate leased space. A grand opening is targeted for September 2004. Our targeted break-even month is July 2005, with an estimated monthly revenue break-even at $66,395, a per-unit variable cost of 60%, and fixed monthly costs of $26,558.
Total net profit for our first year is estimated at approximately negative ($161,000) due to start-up expenses. Our second year forecast shows a positive net profit of approximately $122,400, increasing in our third year to $129,800. Our net cash flow for the first year is projected at $22,000, increasing to $93,000 in our second year and $81,700 in our third year. We project ending our first year with a cash balance of $23,000, increasing to $117,000 in our second year and $198,000 in our third year. We anticipate our accounting net worth at the end of our first year to be approximately negative ($10,000), increasing to a positive $62,000 in our second year and $142,000 in our third year.
The owner is aware of the highly risky nature of launching an entertainment-based restaurant establishment. If the venture fails, the owner’s paid-in capital and expenses may not be recovered. If the venture is undercapitalized and requires more working capital, the owner will consider bringing on investment partners. The owner will also review the return-on-investment for personally providing more paid-in capital. In the event that net profitability cannot be attained, the owner will take sequential steps to exit the venture, as outlined in the Exit Strategy section of the Financial Plan.
1.1 Mission
The mission of E3 Playhouse is to create an entertainment, community education, and dining venue for the residents of Santa Cruz. E3 will be an accessible and affordable venue, offering unique and appealing entertainment for all visitors.
The purpose of E3 Playhouse is to provide the residents of Santa Cruz County, and beyond, with quality entertainment in an enjoyable, pleasant atmosphere. It will provide excellent an place and opportunity for social interaction with dancing, games, educational classes, and special events, with an emphasis on “Live” dance music, including Salsa, Swing, R&B, and Americana. The casual dining ambiance, quality of the food, and excellent service will ensure a large, loyal following of customers. The restaurant will feature a beer and wine bar, along with live entertainment and an arcade area.
1.2 Keys to Success
The E3 Playhouse venue has three keys to success.
- Location–The E3 Playhouse will be strategically located to maximize the revenue derived from the live entertainment consumer. The showcase will be in downtown Santa Cruz. This is an excellent location for multi-purpose entertainment, community education, and restaurant with live music.
- Low Operating Cost–E3 Playhouse will be managed specifically to maintain targeted operating ratios that allow for maximum net profits. For initial construction and build out, E3 Playhouse management will keep construction costs at a minimum. The venue will be housed in a leased building. All operating expenses will be kept to a minimum, with cost of sales and margins reviewed on a monthly basis. Cost of sales is targeted at 40%.
- Wide Range of Services–E3 Playhouse will provide entertainment, community education courses, a full-service restaurant/night club, an arcade area, a retail merchandise area, and venue rental services. The objective will be to maximize the revenue per visitor and extend each visitor’s time spent at the venue.
1.3 Objectives
The purpose of this business plan is to estimate start-up and ongoing costs; identify revenue streams; and forecast net cash flow and profits. The venture will be funded solely through paid-in capital provided by the owner.
The concept of E3 Playhouse is to provide an entertainment, education, and restaurant venue in downtown Santa Cruz. The establishment will provide a live entertainment venue; a restaurant; community-based courses in music and the arts; a retail component offering arts-based retail merchandise; and venue rental services for the Santa Cruz area. The objectives are to:
- Remodel a leased space and launch the venue within a $40,000 start-up budget, and an infusion of capital of $150,000 in the first month. The venue will open within three months of leasing the appropriate space. Leasing is anticipated to begin in June 2004.
- Reach a first-year sales goal of $427,757 and second-year goal of $1,222,164. Annual growth is targeted at a conservative 7% for the third year.
- Maintain a 40% gross margin.


Company Summary
E3 Playhouse is in a start-up position, with a beginning date of July 2004. The company expects to lease venue space in June 2004, a three-month build-out of the space. We anticipate opening our doors to the public in mid-September. The company is on a July through June fiscal year.
2.1 Company Ownership
Established in 2004, E3 Playhouse is operated as a ‘dba’ under the ownership of Equal Time Music, Incorporated. Equal Time Music, Inc. is a California “S” Corporation owned by Wes Anthony. As an “S” Corporation, profits of the corporation ‘pass-through’ to the corporate owner. The owner will pay taxes on the company profits on his personal tax returns.
2.2 Start-up Summary
The corporate owner has contributed $40,260 in paid-in capital for the initial development of E3 Playhouse. Start-up expenses include accounting; legal; consulting services; research and development;and expensed equipment. The company’s start-up position reflects a loss of ($39,260), and total capital and liabilities of $1,000.
The following table summarizes the company’s start-up position.
| Start-up | |
| Requirements | |
| Start-up Expenses | |
| Accounting | $3,500 |
| Legal | $500 |
| Marketing Collateral (bcards, brochures, etc.) | $500 |
| Financial Consultant | $5,000 |
| Rent | $5,760 |
| Research and Development (Time & Expenses) | $9,000 |
| Expensed Equipment | $15,000 |
| Other | $0 |
| Total Start-up Expenses | $39,260 |
| Start-up Assets | |
| Cash Required | $1,000 |
| Start-up Inventory | $0 |
| Other Current Assets | $0 |
| Long-term Assets | $0 |
| Total Assets | $1,000 |
| Total Requirements | $40,260 |
| Start-up Funding | |
| Start-up Expenses to Fund | $39,260 |
| Start-up Assets to Fund | $1,000 |
| Total Funding Required | $40,260 |
| Assets | |
| Non-cash Assets from Start-up | $0 |
| Cash Requirements from Start-up | $1,000 |
| Additional Cash Raised | $0 |
| Cash Balance on Starting Date | $1,000 |
| Total Assets | $1,000 |
| Liabilities and Capital | |
| Liabilities | |
| Current Borrowing | $0 |
| Long-term Liabilities | $0 |
| Accounts Payable (Outstanding Bills) | $0 |
| Other Current Liabilities (interest-free) | $0 |
| Total Liabilities | $0 |
| Capital | |
| Planned Investment | |
| Owner Paid-In Capital | $40,260 |
| Investor 2 | $0 |
| Other | $0 |
| Additional Investment Requirement | $0 |
| Total Planned Investment | $40,260 |
| Loss at Start-up (Start-up Expenses) | ($39,260) |
| Total Capital | $1,000 |
| Total Capital and Liabilities | $1,000 |
| Total Funding | $40,260 |
Products and Services
The venue is a 6,600 square foot complex, which will also house the company’s corporate business office. The dance club and bar will accommodate 200-400 people. The venue will be equipped with state-of-the-art audio, lighting, and video systems, serving the need for a true entertainment venue in Santa Cruz. The general appearance will be clean, open, and pleasing to the customer. The demographics are favorable, with minimal competition from other dance-themed venues and bars.
E3 will generate sales through seven revenue streams that comprise the company’s products and services. The revenue streams have been developed with the goal of lengthening each customer’s stay and maximizing their individual revenue contribution.
The following revenue streams represent E3’s products and services:
- Membership Fees
- Educational Courses
- Food and Beverage
- Gate/Entertainment
- Retail Merchandise
- Arcade
- Venue Rental
Membership Fees:
E3 will sell Memberships on an annual and semi-annual basis. Members will receive discounts on all E3 products and services. Member Benefits include:
-
First Beverage and Appetizer FREE
-
$3 off any Music show and FREE admission to Happy Hour shows plus Guest
-
$3 off any Educational class (per class) and NO Registration fee
-
Birthday Party Gift (1 ticket for Music show, 1 Free Dinner and Dessert, 1 Free Beer Pitcher or 2 Glasses of Wine)
-
Monthly drawing for FREE Music show/Dinner/Beer or Wine for 2 people
-
10% Discount on E3 Playhouse Rental rates for Special Events
-
Four ounce bigger glass of Beer for same price (**for every beer you purchase all year long) (16oz = 20oz or Pitcher = Pitcher + 16oz)
-
One FREE Game Room Certificate
-
FREE Admission for 2 people on a Local music night and for 1 person on a National act
-
FREE Education Workshop Coupon
-
FREE Egg Shaker
-
FREE Magnet
-
10% Discount on Merchandise
Member Card Prices:
-
$100 for one year
-
$60 for 6 months
-
$60 Student and Senior Citizens
-
Free for Kids 15 and under
Educational Courses:
E3 will offer educational courses in music and the arts to the community.
- Music: Drums; Percussion; Bass; Piano; Sax; Clarinet; Flute; Voice; Brass; Strings; Guitar; Group Classes for Jazz, Latin, R&B; Private Lessons for Instruments
- Dance: Salsa, Swing
- Yoga: Beginning; Intermediate; Advanced
- Language: Spanish
- Cooking: Italian; Greek; Asian; Cajun; Latin American
- Workshops: Master Class Workshops; Personal Financial Planning for Musicians; Personal Financial Planning for Individuals; Releasing a CD; Master class with Big Star; Brazilian Vocal Workshops, etc.
Food and Beverage:
E3 will provide ‘casual food’ restaurant services to its customers through contracted restaurant suppliers. The venue currently under lease consideration includes a full kitchen, walk-in refrigerator, and food prep area. The menu will include $5 to $10 items offering simple foods with entrees and appetizers primarily served as bar food. Every Tuesday through Sunday will offer a themed menu. A mix of chefs will rotate for one-to-two month periods.The venue will have a beer and wine liquor license and will also offer fresh juices, smoothies, and other beverages.
Gate/Entertainment:
E3 will sell tickets in the $5 to $20 price range for admission to live musical performances with dance-based themes, focusing on themes with mass appeal. Live musical performances will include regional swing and salsa bands and national acts. The venue will be characterized by distinctive design features, including a spacious dance area which comfortably accommodates 300-400 guests. This room can additionally be used for special events and daily use. The adjoining dining room and bar would present an inviting and relaxing atmosphere including a lounge area that overlooks the dance floor. A live dj will coordinate the events and entertain the patrons with music and games during music breaks and off-times.
The venue includes a state-of-the-art, high-quality audio, lighting, and video system with a 15×10 stage. Backline stage instruments (drums and amplifiers) will be provided.
Retail Merchandise:
The venue will provide space for the retail sale of E3 merchandise of music- and art-focused items. Retail display space will be provided for each band booked at the venue.
Arcade:
E3 will provide an arcade area for customer entertainment, providing several interactive skill games, such as pool tables, ping pong tables, pinball machines, darts, foosball, and video games to provide additional entertainment.
Venue Rental:
E3 will be available as a venue rental for promoters; groups; business meetings; and private parties. Additional services will be provided, as requested, with individualized pricing for each service.Additionally, E3 will offer floor space to mercantile operators to showcase their merchandise.
3.1 Technology
The company’s cash systems will be fully automated, using a centralized software platform for processing cash and credit card purchases. Membership Cards will be barcoded to maintain a customer database, which will be mined for upsells and continuity programs.
The company will maintain an extensive website, offering entertainment calendars for upcoming shows and online registration for community courses.
3.2 Venue Layout/Floor Plan
The owner will build-out an existing restaurant and bar space, with the majority of build-out costs, totaling $20,000, applied toward removing and building several walls. A stage will also be built.
Market Analysis Summary
Santa Cruz is located on California’s Central Coast, approximately 70 miles south of San Francisco. The area’s major industries include tourism, agriculture, manufacturing, and technology. Tourism represents a $513 million industry in Santa Cruz county and generates $14.5 million in local taxes. The region offers excellent transportation; recreational activities; arts and cultural entertainment; food and wine; and lodging for tourists and business travelers. Average travel expenditures per person are $287.48 per trip or $96.67 per day. The average travel group consists of 3.3 people, and the average length of stay is 3.6 nights (Santa Cruz Visitor’s Bureau, 2004).
Santa Cruz is a secondary market, with an influx of visitors from the area’s primary markets including San Jose and San Francisco. Santa Cruz County’s primary population consists of 255,602 people with a secondary population of 135,326 people.
4.1 Market Segmentation
The venue appeals to four major market segments:
Young Professionals— We appeal to single adults and young couples seeking to interact through the social arts and socializing. Young professional customers will range in age from 21 to 51. The venue will appeal to this category by switching the tempo and entertainment to be more appealing to adults as it gets later into the evening. A new 120-unit residential building is under construction directly across the street from the venue, expected to open in Summer 2004. Additional housing developments are undergoing construction throughout the downtown vicinity. This increased population will provide greater foot traffic in the area.
College Students–By creating an environment that is appealing to college students, we secure a natural progression between the high school student and the young professional. The venue is in close proximity to UC Santa Cruz, Cabrillo College, and CSU Monterey Bay.
Tourists and Business Travelers–More and more business travelers and tourists visit the Santa Cruz area every year. We plan to reach these people through direct marketing to local hotel patrons. Tourism generates $513 million in Santa Cruz County every year. The venue is located in the heart of downtown Santa Cruz. The Santa Cruz Boardwalk is one mile away.
Senior Citizens–10% of the Santa Cruz County population is represented by senior citizens. Music events, swing dancing, and course offerings will be scheduled during the early afternoon hours, appealing to the senior citizen population.
The following chart and table outline the target market segments for the venue, including annual growth projections, which we estimate at 2%. We conservatively estimate our target population at 200,000 people. Our sales projections are based on a percentage of this target population.
| Market Analysis | |||||||
| Year 1 | Year 2 | Year 3 | Year 4 | Year 5 | |||
| Potential Customers | Growth | CAGR | |||||
| Overall Population (Santa Cruz County) | 2% | 200,000 | 204,000 | 208,080 | 212,242 | 216,486 | 2.00% |
| Other | 0% | 0 | 0 | 0 | 0 | 0 | 0.00% |
| Total | 2.00% | 200,000 | 204,000 | 208,080 | 212,242 | 216,486 | 2.00% |
4.2 Targeted Population
We estimate that 4% of the targeted population in the Santa Cruz market will visit E3 Playhouse each year, with a frequency of three visits per year. This results in a targeted visitor goal of 24,000 estimated visitors per year.
| Total Population Pool in 2004 |
200,000 |
| Percentage Targeted as E3 Visitors |
4.0% |
| Estimated E3 Visitors |
8,000 |
| Frequency of E3 Visits per Year |
3.0 |
| Estimated Total E3 Visitors |
24,000 |
Daily Visitors Breakdown
24,0000 Visitors per Year = 2,000 Visitors per Month = 80 Visitors per Day
Basic Revenue Breakdown
Based on these targeted visitors, we anticipate using the following breakdown as a basic revenue estimate. A detailed revenue analysis is provided in the Sales Strategy section of the business plan:
80 Visitors/Day x $10 per Person = $800/Day x 25 Days/Month = $20,000 per Month
4.3 Competition and Buying Patterns
Competition
The venue’s direct competition consists of six competitors, two of which are direct competitors:
Rosie McCann’s: Rosie McCann’s offers a game room, live music, and a full bar and menu. The venue caters to the 21-51 age range.
Bruno’s: Bruno’s offers seating for 200, provides a full bar and menu, dance lessons, and a DJ. The venue caters to the 21-51 age range.
Additional competitors are:
The Kuumbwa: The Kuumbwa is a good size venue with seating for 200 guests. The venue appeals to a wide range of visitors and offers a simple one-entree menu.
The Catalyst: The Catalyst is considered more of a large concert venue, with two stages and seating for 600 people. The venue appeals to the 16-26 age range, and offers a pub-food menu. The Catalyst has a full liquor license.
The Blue Lagoon: The Blue Lagoon is a DJ venue with a 200-person capacity, appealing to a 21-30 age range. The Blue Lagoon has a full liquor license and does not offer a menu.
E3 provides month-long Educational Courses and Workshops for the community. Direct competitors for these types of offerings include:
- Santa Cruz Parks & Recreation
- Santa Cruz Adult School
Buying Patterns
The major reason for the customers to return to a specific entertainment venue is pleasant atmosphere, good food and service. E3 Playhouse will gear its programming activities, marketing, and pricing policies to establish a loyal client base.
Strategy and Implementation Summary
The E3 Playhouse’s central downtown Santa Cruz location, demographics, and minimum competition are major advantages for the success of the venture. The proposed venue will provide a local solution to the lack of social atmosphere and live entertainment venues in the region.
The Santa Cruz area lacks an entertainment venue that offers seating for 200-400 guests. The region has a distinct need for a live music and dance venue. The area also is lacking in a venue that offers educational courses to the community. The E3 venue will appeal to a wide age range with events offered that will appeal to 16-70 year olds.
E3 will appeal to the large student population in the region, the large tourism industry in the Santa Cruz area, and the local population seeking mainstream entertainment venue. The venue will also benefit from visitors from surrounding population centers such as San Jose, Monterey, and San Francisco. The Santa Cruz vicinity also provides a strong business population seeking venue rental and entertainment opportunities.
5.1 Value Proposition
E3 will focus on offering exceptional service to its customers. To reach and maintain a unique, high-quality image, the venue will provide attentive and friendly service and will invest in on-going training of its employees. Our second strategy is emphasizing entertainment. The tactics are interactive entertainment, constant sensory appeal, and unique event viewing. Finally, we will focus on our identified target markets, stressing the following concepts:
Emphasize Exceptional Service–We must prove to guests that exceptional service is still available and should be expected as part of a entertainment experience. We will differentiate ourselves from the mediocre service venues.
Emphasize an Entertaining Experience–By assuring that all guests enjoy themselves, we will secure market share through repeat business.
Focus on Target Markets–Our marketing and themes of mass appeal and music based entertainment will attract our target market segments.
5.2 Marketing Strategy
Our marketing budget is set at 1% of our overall sales revenue. This budget will be used to reach our targeted customers through cost-effective marketing campaigns. On-going processes will be geared to promote the brand name and keep the venue at the forefront of entertainment establishments in the Santa Cruz area. Our marketing efforts will focus on the following channels for reaching new and repeat customers:
- Website
- Neighborhood Marketing
- Radio
- Television
- Email/Newsletter
- In-store Promotions
Our first three months will focus on our grand opening event. An aggressive, comprehensive marketing campaign will precede the grand opening. A radio advertising campaign will precede the event. Contests will be held on the target radio stations giving away V.I.P. passes (coupons) to the event while at the same time creating excitement about the opening. We will initiate a regular local radio, TV, and print campaign to create brand awareness.
Website
A website is an important component of our advertising and marketing campaign, allowing us to stay in contact with our customers and provide up-to-date information regarding all of our programs. We will launch a website within the first month of operations, and develop the website’s content over the first six-months. The site will include upcoming entertainment schedules, along with course descriptions and online registration for our educational classes.
Print Advertising
Through commercial repetition, a teaser campaign, and the use of catchy phrases, we will focus on our target market segments.
- Sentinel – daily
- Good Times – weekly
- Metro – weekly
Neighborhood Marketing
We will advertise directly to local hotel guests and surrounding businesses in the downtown area to attract business travelers and tourists. Through the use of fliers and table tents placed in hotel rooms, we will create visitor awareness of our location and event promotion. Promos such as ‘show your room key and get a free drink’ in conjunction with the room ads would be relatively inexpensive from an advertising standpoint and requires limited ongoing maintenance and expense. Print ads will appear in the local and college newspapers serving the region.
Radio Advertising
- KUSP – Public Radio
- KZSC – College Radio
- KPIG – Commercial Radio
Television Advertising
- KRUZ – Channels 4 and 7; local broadcast and regional cable
In-Store Promotions
Shirts, ball caps, shakers, magnets, and bumper stickers bearing the company logo will be marketed, as well as given away as prizes to spread brand awareness.
Email/Newsletter
Loyal, repeat customers are critical to our success. To drive repeat business revenue, we will maintain an ‘opt-in’ database of customers. This valuable database will be used to distribute monthly email newsletters. The newsletter will be a vehicle to announce our upcoming programs and specials. The newsletter will provide timely information regarding entertainment schedules, educational course offerings, and special Members announcements.
5.2.1 Marketing Plan
The following table details our Sales and Marketing plan for the first six months, including the venue’s grand opening.
We have targeted an average of 1% of sales as our on-going Sales and Marketing budget. This allocation is included into the “Sales & Marketing and Other Expenses” in the Profit and Loss table in the Financial section of this business plan. Marketing expenses during the 6 months of the project rollout are estimated at a substantially higher level and are summarized in the table below for each type of advertising. This rollout allows us to manage costs and cash flow. The timeline coincides with our sales revenue ramp-up strategy.
We anticipate developing our radio advertising in August, prior to our grand opening in September. Website development will also begin in August, as does print advertising, followed by television advertising in September. We anticipate beginning a neighborhood marketing campaign in October, an in-store promotion campaign in November, and an email/newsletter campaign in December.
5.3 Service Business Analysis
The nightclub and bar industry is shifting toward a more entertainment-oriented concept. Guests of these venues are not only offered a dynamic place to gather and mingle, but also a place to participate in the entertainment through interactive contests, theme nights, and other events. We intend to heavily utilize entertainment-oriented marketing in an effort to withstand the perpetual shift in trends and cater to as large a client base as possible.
5.4 Competitive Edge
E3 Playhouse’s competitive advantage is derived from several factors. The following differentiate it from its competitors.
- Location–One of the major advantages that E3 will have over its competition will be its downtown location in Santa Cruz.
- Quality Service–E3 Playhouse will provide a wide range of entertainment, catering, and community education services, and we will strive to maintain high service quality that will help us develop a loyal clientele.
- Low Overhead Cost–E3 Playhouse will be managed specifically to maintain targeted operating ratios that allow for maximum net profits. For initial construction and build out, E3 Playhouse management will keep construction costs minimized. The venue will be in a leased building. All operating expenses will be kept to a minimum, with cost of sales and margins reviewed on a monthly basis. Cost of sales target is 40%.
5.5 Sales Strategy
Sales revenue for E3 will be generated through seven separate product and service areas:
- Membership Fees
- Educational Courses
- Food and Beverage
- Gate/Entertainment
- Retail Merchandise
- Arcade
- Venue Rental
Managing seven separate revenue streams requires ramping up each one individually, ensuring that each area performs well before developing the next revenue stream. In order of importance, Food/Beverage and Entertainment are expected to provide the most stable revenue streams. Both of these revenue streams will be developed first, followed by Membership Fees, Educational Courses, Retail Merchandise, Arcade, and Venue Rental.
5.5.1 Revenue Model
Each of these areas is detailed as a component of a revenue model. While the financial model of each of the revenue streams shows a full sales potential, we are taking a very conservative approach during the first year of operation and assuming that we will actually reach only about 35% of those potential first-year revenues during that time.By the second year we will reach the full sales potential of the venue and our third year model assumes a 7% growth over the second year.
The financial tables of this business plan utilize the total of these components as the Combined Annual Revenue Streams.
5.5.1.1 Membership Fee Model
Membership Fees are based on the assumption that E3 will have 24,000 customer visits annually. We anticipate selling three types of Memberships:
- Annual Membership at $100 each
- Semi-Annual Membership at $60 each
- Senior Citizen Discount at $40 each
- Student Discount at $60 each
We are additionally anticipating a 15 and Under discount offered for free.
Members will receive discounts on all E3 products and services. Member Benefits include:
-
First Beverage and Appetizer FREE
-
$3 off any Music show and FREE admission to Happy Hour shows plus Guest
-
$3 off any Educational class (per class) and NO Registration fee
-
Birthday Party Gift (1 ticket for Music show, 1 Free Dinner and Dessert, 1 Free Beer Pitcher or 2 Glasses of Wine)
-
Monthly drawing for FREE Music show/Dinner/Beer or Wine for 2 people
-
10% Discount on E3 Playhouse Rental rates for Special Events
-
Four ounce bigger glass of Beer for same price (**for every beer you purchase all year long) (16oz = 20oz or Pitcher = Pitcher + 16oz)
-
One FREE Game Room Certificate
-
FREE Admission for 2 people on a Local music night and for 1 person on a National act
-
FREE Education Workshop Coupon
-
FREE Egg Shaker
-
FREE Magnet
-
10% Discount on Merchandise
Sales are based on a percentage of visitors purchasing the Memberships. The following table reflects our current projections for the first year of sales revenue generated from Memberships, totaling $369,600 for the year.
5.5.1.2 Educational Courses Model
Educational Courses are offered to the general community for music and art classes taught by local professionals. We anticipate providing two classrooms dedicated to the purpose, with one 15×15 group room and one 8×8 private room. Each course is comprised of four classes. E3 members are offered a price discount for each course. Course participants that are not E3 members will be charged a course registration fee. The following table reflects our first year sales projections for Education Courses, totaling $103,644 for the year.
- Music: Drums; Percussion; Bass; Piano; Sax; Clarinet; Flute; Voice; Brass; Strings; Guitar; Group Classes for Jazz, Latin, R&B; Private Lessons for Instruments
- Dance: Salsa, Swing
- Yoga: Beginning; Intermediate; Advanced
- Language: Spanish
- Cooking: Italian; Greek; Asian; Cajun; Latin
- Workshops: Master Class Workshops; Personal Financial Planning for Musicians; Personal Financial for Individuals; Releasing a CD; Master class with Big Star; Brazilian Vocal Workshops, etc.
5.5.1.3 Food and Beverage Model
Food and Beverage sales are based on the assumption that 50% of the 24,000 visitors per year will purchase food while visiting E3 Playhouse, and 75% will purchase an average of one beverage. This results in 12,000 units of food and 24,000 beverages. We estimate that the average food check will be $7, while the average beverage check will be $8. Based on these assumptions, we estimate the annual food and beverage revenue for the first year will be $276,000.
5.5.1.4 Gate/Entertainment Model
Sales Revenue for tickets sold for live music entertainment is based on the average ticket price of $10, with an average of 75 tickets sold per show for 288 shows per year. We anticipate two types of entertainment shows: national and local entertainment groups. We are scheduling one national group per week, and five local groups per week. These assumptions support the annual revenue forecast of $216,000 for live entertainment ticket sales.
5.5.1.5 Retail Merchandise Model
Retail Merchandise revenue is based on a range of merchandise pricing and the number of anticipated units sold annually. The model allows for flexibility within the range of merchandise. Initially, lower priced products are expected to sell at a higher volume than higher priced merchandise. Based on our initial assumptions, we anticipate that retail merchandise will provide $18,720 in sales revenue for our first year.
5.5.1.6 Arcade Model
Arcade revenue is based on the assumption that 30% of our visitors will play arcade games during their visit, resulting in 7,200 arcade visitors. We anticipate an average of $5 in revenue per each arcade visitor, resulting in annual revenue of $36,000.
The arcade area will include high revenue games such as:
- Pool tables
- Ping pong tables
- Pinball machines
- Darts
- Foosball
- Video games
5.5.1.7 Venue Rental Model
We will offer three types of Venue Rentals: Event Rentals; Kitchen Rentals; and Mercantile Rentals.
Event Rentals
Event Rentals will include revenue from offering additional services. We anticipate four monthly rentals at $700 per rental. Additional revenue sources within the Event Rentals category include bar revenue from each event (100 people per event @ $8 average bar ticket = $3,200 per month) and venue rental services for each event. These services include charging ‘cost plus’ for the following items:
- Sound
- Lights
- Security
- Crew
- Hospitality
- Kitchen
- Advertising
- Tickets
- ASCAP/BMI
- Backline
- Accommodations
Kitchen Rentals
Kitchen Rentals will be provided to local chefs and bakers at times during the day when our kitchen is available. We anticipate kitchen rentals eight days during each month at $50 per day.
Mercantile Rental
Mercantile Rental will offer 25 square foot units of merchandise space to local area retailers that offer products that resonate with our music and art focus. We plan to provide three spaces, initially leased at $150 per month and increasing to 10% of each retailer’s gross revenues as sales permit.
Our Venue Rental forecast results in annual revenue of $106,200 for the first year.
5.5.1.8 Cumulative Revenue
Our combined revenue streams reflect a potential gross annual income of $1,222,164, however, we conservatively estimate that we’ll reach only approximately 35% of our annual sales potential during the first year due to the ramp-up period.
Each revenue table in this business plan is interactive, allowing us to adjust the revenue streams as data becomes available. We will utilize this tool during our day-to-day operations in order to understand our position and plan accordingly.
The data from these tables is imported into the Sales Forecast table in the next section of this business plan.
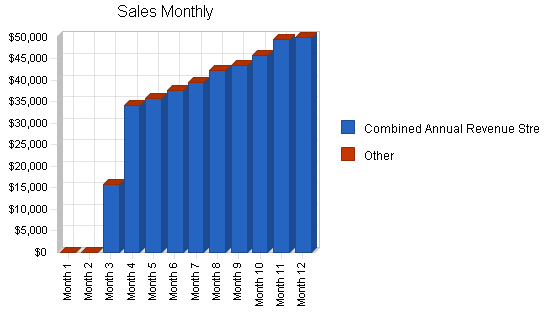
5.5.2 Sales Forecast
E3 will generate sales through seven revenue streams that comprise the company’s products and services:
- Membership Fees
- Educational Courses
- Food and Beverage
- Gate/Entertainment
- Retail Merchandise
- Arcade
- Venue Rental
The company is forecasting a conservative revenue ramp-up period while marketing and word-of-mouth advertising efforts are established during the first year. As mentioned above, our conservative assumptions estimate that we’ll reach only 35% of our sales potential during the first year. The full sales potential of the venue will be reached during the second year of operations. This allows for a more conservative cash flow forecast and better manage revenue expectations. The first year of sales is forecasted to generate $394,157 in sales revenue, with a cost of sales of $236,494. We anticipate opening our doors with a Grand Opening in mid-September, consequently there will be no sales in July or August, and only 1/2 month’s revenue in September.
In the second year, sales are expected to increase to $1,222,164 with a cost of sales of $733,298. This increase includes twelve months of revenue at 100% of projections, as we assume our ramp-up period is over and we are operating at full potential.
The third year shows an increase in sales to $1,307,715 with a cost of sales of $784,629, assuming a 7% growth rate.
The following table highlights the company’s 3-Year revenue forecast. A 12-month detail is provided in the Appendix of the business plan.

| Sales Forecast | |||
| Year 1 | Year 2 | Year 3 | |
| Sales | |||
| Combined Annual Revenue Streams | $394,157 | $1,222,164 | $1,307,715 |
| Other | $0 | $0 | $0 |
| Total Sales | $394,157 | $1,222,164 | $1,307,715 |
| Direct Cost of Sales | Year 1 | Year 2 | Year 3 |
| Combined Annual Revenue Streams | $236,494 | $733,298 | $784,629 |
| Other | $0 | $0 | $0 |
| Subtotal Direct Cost of Sales | $236,494 | $733,298 | $784,629 |
Management Summary
The company CEO is Michael Horne. Michael has eight years of experience as the owner and manager of Palookaville, a live entertainment venue in the Santa Cruz area. The management team is headed by owner Wes Anthony. As a professional musician and teacher, Wes is uniquely qualified to develop an entertainment and education venue. Wes holds a Masters degree in Music from CSU San Diego and has extensive restaurant experience as a cook, waiter, and bartender.
Administration and Operations
Each revenue stream is managed by a Division Chief. Each of these staff positions is detailed in the Personnel plan. The Division Chiefs are responsible for the day-to-day operations of the venue. The Division Chiefs will report directly to Wes Anthony, who will assume all administrative and management responsibilities.
Finance
The company’s bookkeeping, payroll, and tax reporting will be outsourced. This cost is represented in the Profit & Loss under the General And Administrative line item. The company’s accountant is Bob Mason, CPA. Bob is owner of Coast Financial Services of Santa Cruz, CA. Coast Financial will additionally provide payroll services support.
Consulting Services
Additional marketing and employee training will be provided Jon Taffer. Jon specializes in providing hospitality business development for owner/operators through his award-winning business evaluation and rejuvenation services. Jon can provide a full market study and competitive assessment for the venue.
6.1 Personnel Plan
Total personnel costs for the first year is $124,000. Personnel costs increase in the second year of operations, based on a full 12-month of operations, to $170,000. Third year personnel costs are estimated at $192,000. Personnel costs represent the least amount of staffing required to operate the facility. Additional staff will be hired as net profits allow. Personnel interviewing and hiring will begin in August, as detailed in the Milestones table of this section.
Managers paid at $10.00 per hour and assistants paid at $6.50 per hour. Employees will be paid an additional bonus as net profits allow. The wait staff and bartending staff will additionally receive tips where appropriate.
The company will have two division chief managers and four part-time employees initially. All employees will be cross-trained to assist each division as needed. The first two weeks in September are designated as initial training weeks.
Managers
Venue Rental, Food and Beverage, and Arcade Manager: August Polacco
August Polacco is a professional musician with over 40 years experience. He has a sales and marketing career of over 20 years supplementing his musical endeavors, and the direct experience of managing a band’s retail merchandise. In addition, a personal quest for a deeper understanding of human nature led to his participation in Landmark Education’s programs, which provided a model of effective communication and leadership skills and a lifetime of new possibilities. August is uniquely qualified to meet the anticipated demands of the E3 Playhouse.
Entertainment and Education Manager: Michael P. Lazarus
Michael is a professional musician, educator, and owner of Latin Pulse Music, Inc., an online-based musical services company. With degrees in both music and electrical engineering, he continues to provide financial and technical advice to support the launch and ongoing management of the E3 concept. LPM, Inc. will be used as the outsourced solution to meet the scheduling and booking needs of E3’s live entertainment division. While always leveraging against his experience as a touring and recording artist, his activities as an event producer have provided a complete perspective, especially when it comes to contract negotiations with entertainers. Michael currently teaches a comprehensive electric bass method at Sylvan Music in Santa Cruz and at a private studio in San Francisco.
Assistants
Assistants will provide staffing for all divisions, including Entertainment, Education, Food and Beverage, Venue Rentals, and Retail and Arcade. Assistants will also provide general staff needs for events, such as: Clean-up Person; Bouncers; Dishwashers; Ticker Takers; Security; Bartenders, and Audio Video.
- Dan Robbins
- Scott Nordgren
- Mark Sveen
- Clayton Ramsay
Additional assistance will be provided on a temporary basis, as needed, by the following individuals (booked under “Other” in the personnel table).
- Paul Logan
- Rion Strane
- Dave Byron
- Steve Robertson
- Doug Rowan
- Matt Cole
- Jimmy Ray Montoya
- Ferdouse Khaleque
- Steve Gray
- Israel Keller
Music and Education Faculty
Instructors and faculty for E3’s music and education course offerings will be compensated on a percentage basis of the revenue for each course. The average margin for these staffing costs are accounted for as a cost of sales in the Sales forecast of this business plan. Each instructor will be paid as an independent contractor.
The faculty will include the following instructors.
Drums: Steve Robertson; Martin Binder; Steve Vahle; Michael Horne
Percussion: Jose Reyes; Steve Vahle; Gary Keough
Bass: Michael Lazarus; Dan Robbins; Paul Logan
Piano: Rob Malkin; Bryan Yoshida; Eddie Mendenhall; Murray Lowe
Dancing: Ferdouce Khaleque; Aaron and Alexandra; Mario
Sax, Clarinet, Flute: Wes Anthony; Scott Nordgren
Voice: Luanna; Wally Trinidad
Brass: Robin Anderson; Tim Welch; Jeff Lewis
Strings: Nikki Welch; Dan Robbins
Guitar: Dave Byron; Marc Sveen; Clayton Ramsay
Spanish: Clayton Ramsay; Kire
Yoga: Kelly Blaser
| Personnel Plan | |||
| Year 1 | Year 2 | Year 3 | |
| Owner | $30,000 | $50,000 | $60,000 |
| Managers (2) | $38,500 | $42,000 | $42,000 |
| Full-time staff (4) | $49,500 | $54,000 | $54,000 |
| Temp staff | $6,000 | $24,000 | $36,000 |
| Total People | 8 | 9 | 10 |
| Total Payroll | $124,000 | $170,000 | $192,000 |
| Milestones | |||||
| Milestone | Start Date | End Date | Budget | Manager | Department |
| Advisory Board Development | 3/1/2004 | 3/30/2004 | $0 | ABC | Department |
| Accounting and Legal Retained | 4/1/2004 | 4/1/2004 | $0 | ABC | Department |
| Incorporation and DBA Application | 4/15/2004 | 5/1/2004 | $0 | ABC | Department |
| DNS Number Obtained | 4/16/2004 | 4/16/2004 | $0 | ABC | Department |
| Employer ID Number Obtained | 5/1/2004 | 5/30/2004 | $0 | ABC | Department |
| Lease Negotiations | 5/1/2004 | 6/1/2024 | $0 | ABC | Department |
| Establish Payroll Payment Account with PayChex | 5/6/2004 | 5/15/2004 | $0 | ABC | Department |
| Investor Development Meetings | 5/15/2004 | 10/31/2004 | $0 | ABC | Department |
| Marketing Campaign Begins | 6/1/2004 | 12/31/2004 | $0 | ABC | Department |
| Initial Entertainment Bookings | 6/1/2004 | 9/15/2004 | $0 | ABC | Department |
| Initial Course Offerings and Instructers Developed | 6/1/2004 | 9/15/2004 | $0 | ABC | Department |
| Lease Improvements / Building Build-Out | 6/1/2004 | 9/15/2004 | $0 | ABC | Department |
| Building Construction Permits | 6/1/2004 | 6/1/2004 | $0 | ABC | Department |
| City of Santa Cruz Business License & Fict. Name | 6/1/2004 | 6/1/2004 | $0 | ABC | Department |
| City of Santa Cruz Use Permit | 6/1/2004 | 6/30/2004 | $0 | ABC | Department |
| State of CA Liquor License Application or Transfer | 6/1/2004 | 8/31/2004 | $0 | ABC | Department |
| City of Santa Cruz Fire Inspection | 6/15/2004 | 6/30/2004 | $0 | ABC | Department |
| City of Santa Cruz Industrial Wastewater Permit | 6/15/2004 | 6/30/2004 | $0 | ABC | Department |
| County of Santa Cruz Business Property Statement | 7/1/2004 | 7/1/2004 | $0 | ABC | Department |
| County of Santa Cruz Health Permit | 7/1/2004 | 7/1/2004 | $0 | ABC | Department |
| Stae of CA Employer Registration | 7/15/2004 | 7/15/2004 | $0 | ABC | Department |
| State of CA Sales & Use Permit | 7/20/2004 | 7/20/2004 | $0 | ABC | Department |
| Employee Recruitment Begins | 8/1/2004 | 9/15/2004 | $0 | ABC | Department |
| Equipment and Furnishings | 8/1/2004 | 9/15/2004 | $0 | ABC | Department |
| Kitchen Management & Inventory Developed | 8/5/2004 | 9/15/2004 | $0 | ABC | Department |
| Retail Merchandise Inventory Ordered | 8/15/2004 | 9/15/2004 | $0 | ABC | Department |
| Venue Rental Development | 8/20/2004 | 9/15/2004 | $0 | ABC | Department |
| Membership Program Developed | 8/20/2004 | 8/20/2004 | $0 | ABC | Department |
| Employee Training / John Taffer | 9/1/2004 | 9/15/2004 | $0 | ABC | Department |
| Grand Opening | 9/1/2004 | 9/15/2004 | $0 | ABC | Department |
| Totals | $0 | ||||
Financial Plan
The purpose of this business plan is to estimate start-up and ongoing costs; identify revenue streams; and forecast net cash flow and profits. The venture will be funded solely through paid-in capital provided by the owner.
We estimate our monthly revenue break-even at $66,395, with a per-unit variable cost of 60% and fixed monthly costs of $26,558. Total net profit for our first year is estimated at a negative ($161,031) due to start-up expenses. Our second year forecast shows a positive net profit of $122,498, increasing in our third year to $129,891. Start-up expenses of $40,260 and initial working capital of $150,000 has been provided by owner Wes Anthony.
Our net cash flow for the first year is projected at $22,084, increasing to $103,664 in our second year and $82,157 in our third year. We project ending our first year with a cash balance of $23,084, increasing to $126,748 in our second year and $208,905 in our third year. We anticipate our accounting net worth at the end of our first year to be a negative ($10,031), increasing to $62,468 in our second year and $142,359 in our third year.
The owner is aware of the highly risky nature of launching an entertainment-based restaurant establishment. If the venture fails, the owner’s paid-in capital and expenses may not be recovered. If the venture is undercapitalized and requires more working capital, the owner will consider bringing on investment partners. The owner will also review the return-on-investment for personally providing more paid-in capital. In the event that net profitability cannot be attained, the owner will take sequential steps to exit the venture, as outlined in the Exit Strategy section of the Financial Plan.
The owner’s initial investment of $40,260 in start-up capital, along with paid-in capital of $150,000, results in a total investment of $190,260.
7.1 Important Assumptions
The company does not anticipate securing a conventional loan for funding purposes. Our tax rate is initially set at 0% pending further analysis.
Our payroll expense begins in August 2004 as we prepare for our grand opening. Payroll taxes and employee benefits are forecast at 7% of payroll and identified in the Profit and Loss table of this financial plan.
New accounts payable begin in July 2004 with the leasing of space and initial build-out expenses. We anticipate accounts payable for inventory to begin in July 2004.
Our collections days are estimated at 2 days based on credit card (15% of sales) and cash (85% of sales) merchant account processing. We estimate our payment days to be 30 days to our accounts payable. Our inventory turnover is estimated at 7 days.
All purchased equipment, as well as the build-out costs, will be expensed, which will reduce the asset base of the company.
7.2 Break-even Analysis
We estimate our monthly revenue break-even at $66,395, with a per-unit variable cost of 60% and fixed monthly costs of $26,558. Our targeted break-even month is October 2005.

| Break-even Analysis | |
| Monthly Revenue Break-even | $64,958 |
| Assumptions: | |
| Average Percent Variable Cost | 60% |
| Estimated Monthly Fixed Cost | $25,983 |
7.3 Projected Profit and Loss
We anticipate a gross margin of 40% beginning with sales revenue generated in Sept 2004. Gross margin for our first year is projected at approximately $157,600, increasing in our second year to approximately $488,800 and $523,000 in our third year.
Total net profit for our first year is estimated at approximately negative ($161,000) due to start-up expenses. Our second year forecast shows a positive net profit of approximately $122,400, increasing in our third year to $129,800.
Our sales and marketing expense will begin in July 2004 as we start marketing efforts for our grand opening in September 2004. We anticipate a budget of 1% of our gross sales to support our marketing efforts.
Payroll begins in August 2004, along with payroll taxes and employee benefits estimated at 7%. We plan to spend the month of August training all employees prior to our grand opening.
Start-up Costs
We have allocated $20,000 toward lease improvements and our build-out of the leased space prior to our grand opening. This amount includes construction costs for renovating the existing space to accommodate a stage area, along with making minor space adjustments within the venue.
Equipment and Furnishings are allocated at $30,000 for our first year. Equipment includes Lighting, Sound, and Audio Video expenditures for the build-out of the venue.
Rent is based on securing a 6,600 square foot facility with a monthly rent of approximately $8,000. To secure the lease we anticipate paying first month’s rent and security deposit in July 2004. We plan to negotiate favorable tenant improvement allowances with the owner, including a percentage of the monthly rent discounted as a build-out credit. For this reason, the P&L reflects a monthly rent of $6,000 for the first year.
We anticipate outsourcing most of our general and administrative functions, such as payroll and other day-to-day concerns. This allocation is included in the Profit & Loss as a General And Administrative cost, set initially at $750 per month.
We have allocated an additional $500 per month above operating expenses for ‘Other’ unanticipated costs. This allocation begins in our first month of operations and is regarded as an ongoing monthly expense.


| Pro Forma Profit and Loss | |||
| Year 1 | Year 2 | Year 3 | |
| Sales | $394,157 | $1,222,164 | $1,307,715 |
| Direct Cost of Sales | $236,494 | $733,298 | $784,629 |
| Other Costs of Goods | $0 | $0 | $0 |
| Total Cost of Sales | $236,494 | $733,298 | $784,629 |
| Gross Margin | $157,663 | $488,866 | $523,086 |
| Gross Margin % | 40.00% | 40.00% | 40.00% |
| Expenses | |||
| Payroll | $124,000 | $170,000 | $192,000 |
| Sales & Marketing and Other Expenses | $25,514 | $46,967 | $50,255 |
| Depreciation | $0 | $0 | $0 |
| Building Build-Out ($20,000) | $20,000 | $2,000 | $2,000 |
| Lights, Audio, Bumper | $30,000 | $2,000 | $2,000 |
| Permits & Licenses (Beer & Wine) | $5,000 | $500 | $500 |
| Rent | $69,000 | $96,000 | $96,000 |
| Utilities | $9,000 | $12,000 | $12,000 |
| Legal and Accounting | $6,000 | $6,000 | $6,000 |
| Consulting | $500 | $1,000 | $1,000 |
| Insurance | $6,000 | $6,000 | $6,000 |
| Payroll Taxes & Employee Benefits | $1,786 | $3,288 | $3,518 |
| General and Adminstrative Expenses | $9,000 | $9,000 | $9,000 |
| Other | $6,000 | $3,000 | $3,000 |
| Total Operating Expenses | $311,800 | $357,755 | $383,273 |
| Profit Before Interest and Taxes | ($154,137) | $131,111 | $139,813 |
| EBITDA | ($154,137) | $131,111 | $139,813 |
| Interest Expense | $0 | $0 | $0 |
| Taxes Incurred | $0 | $0 | $0 |
| Net Profit | ($154,137) | $131,111 | $139,813 |
| Net Profit/Sales | -39.11% | 10.73% | 10.69% |
7.4 Projected Cash Flow
Initial capital of $40,260 has been provided by the owner. Additional working capital requirements of $150,000 until we achieve break-even are also provided by the owner.
Break-even is expected in October of 2005. In the event that break-even is not achieved in that month, the owner will review the risk and return for providing additional equity. Additionally, the owner may consider bringing on investment partners to generate working capital.
The owner anticipates paying out $50,000 dollar dividends starting at the end of the second year of operation, when the company reaches its full sales potential.
Our net cash flow for the first year is projected at $22,084, increasing to approximately $103,600 in our second year and $82,000 in our third year. We project ending our first year with a cash balance of $23,000, increasing to almost $117,000 in our second year and approximately $198,600 in our third year.

| Pro Forma Cash Flow | |||
| Year 1 | Year 2 | Year 3 | |
| Cash Received | |||
| Cash from Operations | |||
| Cash Sales | $394,157 | $1,222,164 | $1,307,715 |
| Subtotal Cash from Operations | $394,157 | $1,222,164 | $1,307,715 |
| Additional Cash Received | |||
| Sales Tax, VAT, HST/GST Received | $0 | $0 | $0 |
| New Current Borrowing | $0 | $0 | $0 |
| New Other Liabilities (interest-free) | $0 | $0 | $0 |
| New Long-term Liabilities | $0 | $0 | $0 |
| Sales of Other Current Assets | $0 | $0 | $0 |
| Sales of Long-term Assets | $0 | $0 | $0 |
| New Investment Received | $150,000 | $0 | $0 |
| Subtotal Cash Received | $544,157 | $1,222,164 | $1,307,715 |
| Expenditures | Year 1 | Year 2 | Year 3 |
| Expenditures from Operations | |||
| Cash Spending | $124,000 | $170,000 | $192,000 |
| Bill Payments | $391,847 | $899,739 | $974,181 |
| Subtotal Spent on Operations | $515,847 | $1,069,739 | $1,166,181 |
| Additional Cash Spent | |||
| Sales Tax, VAT, HST/GST Paid Out | $0 | $0 | $0 |
| Principal Repayment of Current Borrowing | $0 | $0 | $0 |
| Other Liabilities Principal Repayment | $0 | $0 | $0 |
| Long-term Liabilities Principal Repayment | $0 | $0 | $0 |
| Purchase Other Current Assets | $0 | $0 | $0 |
| Purchase Long-term Assets | $0 | $0 | $0 |
| Dividends | $0 | $50,000 | $50,000 |
| Subtotal Cash Spent | $515,847 | $1,119,739 | $1,216,181 |
| Net Cash Flow | $28,310 | $102,425 | $91,535 |
| Cash Balance | $29,310 | $131,735 | $223,270 |
7.5 Projected Balance Sheet
With a starting cash balance of $1,000, we anticipate that our total assets for our first year will be approximately $30,500, increasing to $149,900 in our second year and $223,500 in our third year. We anticipate our liabilities to total $40,600 in our first year, increasing to approximately $77,700 in our second year and $81,100 in our third year.
We anticipate our accounting net worth at the end of our first year to be approximately negative ($10,000), increasing to a positive $62,400 in our second year and $142,300 in our third year.
| Pro Forma Balance Sheet | |||
| Year 1 | Year 2 | Year 3 | |
| Assets | |||
| Current Assets | |||
| Cash | $29,310 | $131,735 | $223,270 |
| Inventory | $7,494 | $23,235 | $24,862 |
| Other Current Assets | $0 | $0 | $0 |
| Total Current Assets | $36,804 | $154,971 | $248,132 |
| Long-term Assets | |||
| Long-term Assets | $0 | $0 | $0 |
| Accumulated Depreciation | $0 | $0 | $0 |
| Total Long-term Assets | $0 | $0 | $0 |
| Total Assets | $36,804 | $154,971 | $248,132 |
| Liabilities and Capital | Year 1 | Year 2 | Year 3 |
| Current Liabilities | |||
| Accounts Payable | $39,940 | $76,997 | $80,345 |
| Current Borrowing | $0 | $0 | $0 |
| Other Current Liabilities | $0 | $0 | $0 |
| Subtotal Current Liabilities | $39,940 | $76,997 | $80,345 |
| Long-term Liabilities | $0 | $0 | $0 |
| Total Liabilities | $39,940 | $76,997 | $80,345 |
| Paid-in Capital | $190,260 | $190,260 | $190,260 |
| Retained Earnings | ($39,260) | ($243,397) | ($162,286) |
| Earnings | ($154,137) | $131,111 | $139,813 |
| Total Capital | ($3,137) | $77,974 | $167,787 |
| Total Liabilities and Capital | $36,804 | $154,971 | $248,132 |
| Net Worth | ($3,137) | $77,974 | $167,787 |
7.6 Exit Strategy and Risk Assessment
The owner is aware of the highly risky nature of launching an entertainment-based restaurant establishment. If the venture fails, the owner’s paid-in capital and expenses may not be recovered.
The venture’s actual revenue will be tracked against projections on a month-to-month basis. If net profitability is not in-line with forecasts, management and operational adjustments will be made to address the issues.
If the venture is undercapitalized and requires more working capital, the owner will consider bringing on investment partners. The owner will also review the return-on-investment for personally providing more paid-in capital.
In the event that net profitability cannot be attained, the owner will take the following sequential steps to exit the venture:
1. The owner will attempt to sell the venture outright to a suitable buyer.
2. If a buyer cannot be found, the owner will liquidate all viable assets, including the establishment’s liquor license.
3. Capital raised through asset liquidation will be used to reduce possible debt. All debt will be negotiated prior to settlement.
4. If debts cannot be eliminated, the owner will discuss corporate bankruptcy options with legal counsel.
7.7 Business Ratios
The table below summarizes key business ratios of E3 Playhouse and compares with the average for the Entertainment services industry. As the company establishes itself financially, most of our business ratios will come into line with the industry averages.
| Ratio Analysis | ||||
| Year 1 | Year 2 | Year 3 | Industry Profile | |
| Sales Growth | 0.00% | 210.07% | 7.00% | 4.94% |
| Percent of Total Assets | ||||
| Inventory | 20.36% | 14.99% | 10.02% | 3.45% |
| Other Current Assets | 0.00% | 0.00% | 0.00% | 34.79% |
| Total Current Assets | 100.00% | 100.00% | 100.00% | 46.78% |
| Long-term Assets | 0.00% | 0.00% | 0.00% | 53.22% |
| Total Assets | 100.00% | 100.00% | 100.00% | 100.00% |
| Current Liabilities | 108.52% | 49.68% | 32.38% | 25.68% |
| Long-term Liabilities | 0.00% | 0.00% | 0.00% | 26.09% |
| Total Liabilities | 108.52% | 49.68% | 32.38% | 51.77% |
| Net Worth | -8.52% | 50.32% | 67.62% | 48.23% |
| Percent of Sales | ||||
| Sales | 100.00% | 100.00% | 100.00% | 100.00% |
| Gross Margin | 40.00% | 40.00% | 40.00% | 100.00% |
| Selling, General & Administrative Expenses | 67.36% | 64.67% | 62.20% | 75.20% |
| Advertising Expenses | 8.79% | 8.39% | 8.01% | 2.52% |
| Profit Before Interest and Taxes | -39.11% | 10.73% | 10.69% | 2.40% |
| Main Ratios | ||||
| Current | 0.92 | 2.01 | 3.09 | 1.20 |
| Quick | 0.73 | 1.71 | 2.78 | 0.84 |
| Total Debt to Total Assets | 108.52% | 49.68% | 32.38% | 63.28% |
| Pre-tax Return on Net Worth | 4913.71% | 168.15% | 83.33% | 1.80% |
| Pre-tax Return on Assets | -418.81% | 84.60% | 56.35% | 4.89% |
| Additional Ratios | Year 1 | Year 2 | Year 3 | |
| Net Profit Margin | -39.11% | 10.73% | 10.69% | n.a |
| Return on Equity | 0.00% | 168.15% | 83.33% | n.a |
| Activity Ratios | ||||
| Inventory Turnover | 48.00 | 47.73 | 32.63 | n.a |
| Accounts Payable Turnover | 10.81 | 12.17 | 12.17 | n.a |
| Payment Days | 27 | 23 | 29 | n.a |
| Total Asset Turnover | 10.71 | 7.89 | 5.27 | n.a |
| Debt Ratios | ||||
| Debt to Net Worth | 0.00 | 0.99 | 0.48 | n.a |
| Current Liab. to Liab. | 1.00 | 1.00 | 1.00 | n.a |
| Liquidity Ratios | ||||
| Net Working Capital | ($3,137) | $77,974 | $167,787 | n.a |
| Interest Coverage | 0.00 | 0.00 | 0.00 | n.a |
| Additional Ratios | ||||
| Assets to Sales | 0.09 | 0.13 | 0.19 | n.a |
| Current Debt/Total Assets | 109% | 50% | 32% | n.a |
| Acid Test | 0.73 | 1.71 | 2.78 | n.a |
| Sales/Net Worth | 0.00 | 15.67 | 7.79 | n.a |
| Dividend Payout | 0.00 | 0.38 | 0.36 | n.a |
Appendix
| Sales Forecast | |||||||||||||
| Month 1 | Month 2 | Month 3 | Month 4 | Month 5 | Month 6 | Month 7 | Month 8 | Month 9 | Month 10 | Month 11 | Month 12 | ||
| Sales | |||||||||||||
| Combined Annual Revenue Streams | $0 | $0 | $15,800 | $34,300 | $35,900 | $37,700 | $39,500 | $42,400 | $43,400 | $45,700 | $49,500 | $49,957 | |
| Other | $0 | $0 | $0 | $0 | $0 | $0 | $0 | $0 | $0 | $0 | $0 | $0 | |
| Total Sales | $0 | $0 | $15,800 | $34,300 | $35,900 | $37,700 | $39,500 | $42,400 | $43,400 | $45,700 | $49,500 | $49,957 | |
| Direct Cost of Sales | Month 1 | Month 2 | Month 3 | Month 4 | Month 5 | Month 6 | Month 7 | Month 8 | Month 9 | Month 10 | Month 11 | Month 12 | |
| Combined Annual Revenue Streams | 60% | $0 | $0 | $9,480 | $20,580 | $21,540 | $22,620 | $23,700 | $25,440 | $26,040 | $27,420 | $29,700 | $29,974 |
| Other | $0 | $0 | $0 | $0 | $0 | $0 | $0 | $0 | $0 | $0 | $0 | $0 | |
| Subtotal Direct Cost of Sales | $0 | $0 | $9,480 | $20,580 | $21,540 | $22,620 | $23,700 | $25,440 | $26,040 | $27,420 | $29,700 | $29,974 | |
| Personnel Plan | |||||||||||||
| Month 1 | Month 2 | Month 3 | Month 4 | Month 5 | Month 6 | Month 7 | Month 8 | Month 9 | Month 10 | Month 11 | Month 12 | ||
| Owner | $0 | $0 | $3,000 | $3,000 | $3,000 | $3,000 | $3,000 | $3,000 | $3,000 | $3,000 | $3,000 | $3,000 | |
| Managers (2) | $0 | $3,500 | $3,500 | $3,500 | $3,500 | $3,500 | $3,500 | $3,500 | $3,500 | $3,500 | $3,500 | $3,500 | |
| Full-time staff (4) | $0 | $4,500 | $4,500 | $4,500 | $4,500 | $4,500 | $4,500 | $4,500 | $4,500 | $4,500 | $4,500 | $4,500 | |
| Temp staff | $0 | $0 | $0 | $0 | $0 | $0 | $1,000 | $1,000 | $1,000 | $1,000 | $1,000 | $1,000 | |
| Total People | 0 | 7 | 7 | 7 | 7 | 7 | 8 | 8 | 8 | 8 | 8 | 8 | |
| Total Payroll | $0 | $8,000 | $11,000 | $11,000 | $11,000 | $11,000 | $12,000 | $12,000 | $12,000 | $12,000 | $12,000 | $12,000 | |
| Pro Forma Profit and Loss | |||||||||||||
| Month 1 | Month 2 | Month 3 | Month 4 | Month 5 | Month 6 | Month 7 | Month 8 | Month 9 | Month 10 | Month 11 | Month 12 | ||
| Sales | $0 | $0 | $15,800 | $34,300 | $35,900 | $37,700 | $39,500 | $42,400 | $43,400 | $45,700 | $49,500 | $49,957 | |
| Direct Cost of Sales | $0 | $0 | $9,480 | $20,580 | $21,540 | $22,620 | $23,700 | $25,440 | $26,040 | $27,420 | $29,700 | $29,974 | |
| Other Costs of Goods | $0 | $0 | $0 | $0 | $0 | $0 | $0 | $0 | $0 | $0 | $0 | $0 | |
| Total Cost of Sales | $0 | $0 | $9,480 | $20,580 | $21,540 | $22,620 | $23,700 | $25,440 | $26,040 | $27,420 | $29,700 | $29,974 | |
| Gross Margin | $0 | $0 | $6,320 | $13,720 | $14,360 | $15,080 | $15,800 | $16,960 | $17,360 | $18,280 | $19,800 | $19,983 | |
| Gross Margin % | 0.00% | 0.00% | 40.00% | 40.00% | 40.00% | 40.00% | 40.00% | 40.00% | 40.00% | 40.00% | 40.00% | 40.00% | |
| Expenses | |||||||||||||
| Payroll | $0 | $8,000 | $11,000 | $11,000 | $11,000 | $11,000 | $12,000 | $12,000 | $12,000 | $12,000 | $12,000 | $12,000 | |
| Sales & Marketing and Other Expenses | $2,126 | $2,126 | $2,126 | $2,126 | $2,126 | $2,126 | $2,126 | $2,126 | $2,126 | $2,126 | $2,126 | $2,126 | |
| Depreciation | $0 | $0 | $0 | $0 | $0 | $0 | $0 | $0 | $0 | $0 | $0 | $0 | |
| Building Build-Out ($20,000) | $10,000 | $10,000 | $0 | $0 | $0 | $0 | $0 | $0 | $0 | $0 | $0 | $0 | |
| Lights, Audio, Bumper | $10,000 | $10,000 | $10,000 | $0 | $0 | $0 | $0 | $0 | $0 | $0 | $0 | $0 | |
| Permits & Licenses (Beer & Wine) | $5,000 | $0 | $0 | $0 | $0 | $0 | $0 | $0 | $0 | $0 | $0 | $0 | |
| Rent | $12,000 | $0 | $3,000 | $6,000 | $6,000 | $6,000 | $6,000 | $6,000 | $6,000 | $6,000 | $6,000 | $6,000 | |
| Utilities | $750 | $750 | $750 | $750 | $750 | $750 | $750 | $750 | $750 | $750 | $750 | $750 | |
| Legal and Accounting | $500 | $500 | $500 | $500 | $500 | $500 | $500 | $500 | $500 | $500 | $500 | $500 | |
| Consulting | $500 | $0 | $0 | $0 | $0 | $0 | $0 | $0 | $0 | $0 | $0 | $0 | |
| Insurance | $500 | $500 | $500 | $500 | $500 | $500 | $500 | $500 | $500 | $500 | $500 | $500 | |
| Payroll Taxes & Employee Benefits | 7% | $149 | $149 | $149 | $149 | $149 | $149 | $149 | $149 | $149 | $149 | $149 | $149 |
| General and Adminstrative Expenses | 15% | $750 | $750 | $750 | $750 | $750 | $750 | $750 | $750 | $750 | $750 | $750 | $750 |
| Other | $500 | $500 | $500 | $500 | $500 | $500 | $500 | $500 | $500 | $500 | $500 | $500 | |
| Total Operating Expenses | $42,775 | $33,275 | $29,275 | $22,275 | $22,275 | $22,275 | $23,275 | $23,275 | $23,275 | $23,275 | $23,275 | $23,275 | |
| Profit Before Interest and Taxes | ($42,775) | ($33,275) | ($22,955) | ($8,555) | ($7,915) | ($7,195) | ($7,475) | ($6,315) | ($5,915) | ($4,995) | ($3,475) | ($3,292) | |
| EBITDA | ($42,775) | ($33,275) | ($22,955) | ($8,555) | ($7,915) | ($7,195) | ($7,475) | ($6,315) | ($5,915) | ($4,995) | ($3,475) | ($3,292) | |
| Interest Expense | $0 | $0 | $0 | $0 | $0 | $0 | $0 | $0 | $0 | $0 | $0 | $0 | |
| Taxes Incurred | $0 | $0 | $0 | $0 | $0 | $0 | $0 | $0 | $0 | $0 | $0 | $0 | |
| Net Profit | ($42,775) | ($33,275) | ($22,955) | ($8,555) | ($7,915) | ($7,195) | ($7,475) | ($6,315) | ($5,915) | ($4,995) | ($3,475) | ($3,292) | |
| Net Profit/Sales | 0.00% | 0.00% | -145.28% | -24.94% | -22.05% | -19.08% | -18.92% | -14.89% | -13.63% | -10.93% | -7.02% | -6.59% | |
| Pro Forma Cash Flow | |||||||||||||
| Month 1 | Month 2 | Month 3 | Month 4 | Month 5 | Month 6 | Month 7 | Month 8 | Month 9 | Month 10 | Month 11 | Month 12 | ||
| Cash Received | |||||||||||||
| Cash from Operations | |||||||||||||
| Cash Sales | $0 | $0 | $15,800 | $34,300 | $35,900 | $37,700 | $39,500 | $42,400 | $43,400 | $45,700 | $49,500 | $49,957 | |
| Subtotal Cash from Operations | $0 | $0 | $15,800 | $34,300 | $35,900 | $37,700 | $39,500 | $42,400 | $43,400 | $45,700 | $49,500 | $49,957 | |
| Additional Cash Received | |||||||||||||
| Sales Tax, VAT, HST/GST Received | 0.00% | $0 | $0 | $0 | $0 | $0 | $0 | $0 | $0 | $0 | $0 | $0 | $0 |
| New Current Borrowing | $0 | $0 | $0 | $0 | $0 | $0 | $0 | $0 | $0 | $0 | $0 | $0 | |
| New Other Liabilities (interest-free) | $0 | $0 | $0 | $0 | $0 | $0 | $0 | $0 | $0 | $0 | $0 | $0 | |
| New Long-term Liabilities | $0 | $0 | $0 | $0 | $0 | $0 | $0 | $0 | $0 | $0 | $0 | $0 | |
| Sales of Other Current Assets | $0 | $0 | $0 | $0 | $0 | $0 | $0 | $0 | $0 | $0 | $0 | $0 | |
| Sales of Long-term Assets | $0 | $0 | $0 | $0 | $0 | $0 | $0 | $0 | $0 | $0 | $0 | $0 | |
| New Investment Received | $150,000 | $0 | $0 | $0 | $0 | $0 | $0 | $0 | $0 | $0 | $0 | $0 | |
| Subtotal Cash Received | $150,000 | $0 | $15,800 | $34,300 | $35,900 | $37,700 | $39,500 | $42,400 | $43,400 | $45,700 | $49,500 | $49,957 | |
| Expenditures | Month 1 | Month 2 | Month 3 | Month 4 | Month 5 | Month 6 | Month 7 | Month 8 | Month 9 | Month 10 | Month 11 | Month 12 | |
| Expenditures from Operations | |||||||||||||
| Cash Spending | $0 | $8,000 | $11,000 | $11,000 | $11,000 | $11,000 | $12,000 | $12,000 | $12,000 | $12,000 | $12,000 | $12,000 | |
| Bill Payments | $1,426 | $42,192 | $25,437 | $30,275 | $34,577 | $33,092 | $34,201 | $35,308 | $37,160 | $37,517 | $39,123 | $41,537 | |
| Subtotal Spent on Operations | $1,426 | $50,192 | $36,437 | $41,275 | $45,577 | $44,092 | $46,201 | $47,308 | $49,160 | $49,517 | $51,123 | $53,537 | |
| Additional Cash Spent | |||||||||||||
| Sales Tax, VAT, HST/GST Paid Out | $0 | $0 | $0 | $0 | $0 | $0 | $0 | $0 | $0 | $0 | $0 | $0 | |
| Principal Repayment of Current Borrowing | $0 | $0 | $0 | $0 | $0 | $0 | $0 | $0 | $0 | $0 | $0 | $0 | |
| Other Liabilities Principal Repayment | $0 | $0 | $0 | $0 | $0 | $0 | $0 | $0 | $0 | $0 | $0 | $0 | |
| Long-term Liabilities Principal Repayment | $0 | $0 | $0 | $0 | $0 | $0 | $0 | $0 | $0 | $0 | $0 | $0 | |
| Purchase Other Current Assets | $0 | $0 | $0 | $0 | $0 | $0 | $0 | $0 | $0 | $0 | $0 | $0 | |
| Purchase Long-term Assets | $0 | $0 | $0 | $0 | $0 | $0 | $0 | $0 | $0 | $0 | $0 | $0 | |
| Dividends | $0 | $0 | $0 | $0 | $0 | $0 | $0 | $0 | $0 | $0 | $0 | $0 | |
| Subtotal Cash Spent | $1,426 | $50,192 | $36,437 | $41,275 | $45,577 | $44,092 | $46,201 | $47,308 | $49,160 | $49,517 | $51,123 | $53,537 | |
| Net Cash Flow | $148,574 | ($50,192) | ($20,637) | ($6,975) | ($9,677) | ($6,392) | ($6,701) | ($4,908) | ($5,760) | ($3,817) | ($1,623) | ($3,580) | |
| Cash Balance | $149,574 | $99,383 | $78,746 | $71,771 | $62,093 | $55,701 | $49,000 | $44,092 | $38,331 | $34,514 | $32,890 | $29,310 | |
| Pro Forma Balance Sheet | |||||||||||||
| Month 1 | Month 2 | Month 3 | Month 4 | Month 5 | Month 6 | Month 7 | Month 8 | Month 9 | Month 10 | Month 11 | Month 12 | ||
| Assets | Starting Balances | ||||||||||||
| Current Assets | |||||||||||||
| Cash | $1,000 | $149,574 | $99,383 | $78,746 | $71,771 | $62,093 | $55,701 | $49,000 | $44,092 | $38,331 | $34,514 | $32,890 | $29,310 |
| Inventory | $0 | $0 | $0 | $2,370 | $5,145 | $5,385 | $5,655 | $5,925 | $6,360 | $6,510 | $6,855 | $7,425 | $7,494 |
| Other Current Assets | $0 | $0 | $0 | $0 | $0 | $0 | $0 | $0 | $0 | $0 | $0 | $0 | $0 |
| Total Current Assets | $1,000 | $149,574 | $99,383 | $81,116 | $76,916 | $67,478 | $61,356 | $54,925 | $50,452 | $44,841 | $41,369 | $40,315 | $36,804 |
| Long-term Assets | |||||||||||||
| Long-term Assets | $0 | $0 | $0 | $0 | $0 | $0 | $0 | $0 | $0 | $0 | $0 | $0 | $0 |
| Accumulated Depreciation | $0 | $0 | $0 | $0 | $0 | $0 | $0 | $0 | $0 | $0 | $0 | $0 | $0 |
| Total Long-term Assets | $0 | $0 | $0 | $0 | $0 | $0 | $0 | $0 | $0 | $0 | $0 | $0 | $0 |
| Total Assets | $1,000 | $149,574 | $99,383 | $81,116 | $76,916 | $67,478 | $61,356 | $54,925 | $50,452 | $44,841 | $41,369 | $40,315 | $36,804 |
| Liabilities and Capital | Month 1 | Month 2 | Month 3 | Month 4 | Month 5 | Month 6 | Month 7 | Month 8 | Month 9 | Month 10 | Month 11 | Month 12 | |
| Current Liabilities | |||||||||||||
| Accounts Payable | $0 | $41,349 | $24,432 | $29,121 | $33,476 | $31,953 | $33,026 | $34,070 | $35,912 | $36,216 | $37,739 | $40,160 | $39,940 |
| Current Borrowing | $0 | $0 | $0 | $0 | $0 | $0 | $0 | $0 | $0 | $0 | $0 | $0 | $0 |
| Other Current Liabilities | $0 | $0 | $0 | $0 | $0 | $0 | $0 | $0 | $0 | $0 | $0 | $0 | $0 |
| Subtotal Current Liabilities | $0 | $41,349 | $24,432 | $29,121 | $33,476 | $31,953 | $33,026 | $34,070 | $35,912 | $36,216 | $37,739 | $40,160 | $39,940 |
| Long-term Liabilities | $0 | $0 | $0 | $0 | $0 | $0 | $0 | $0 | $0 | $0 | $0 | $0 | $0 |
| Total Liabilities | $0 | $41,349 | $24,432 | $29,121 | $33,476 | $31,953 | $33,026 | $34,070 | $35,912 | $36,216 | $37,739 | $40,160 | $39,940 |
| Paid-in Capital | $40,260 | $190,260 | $190,260 | $190,260 | $190,260 | $190,260 | $190,260 | $190,260 | $190,260 | $190,260 | $190,260 | $190,260 | $190,260 |
| Retained Earnings | ($39,260) | ($39,260) | ($39,260) | ($39,260) | ($39,260) | ($39,260) | ($39,260) | ($39,260) | ($39,260) | ($39,260) | ($39,260) | ($39,260) | ($39,260) |
| Earnings | $0 | ($42,775) | ($76,050) | ($99,005) | ($107,560) | ($115,475) | ($122,670) | ($130,145) | ($136,460) | ($142,375) | ($147,370) | ($150,845) | ($154,137) |
| Total Capital | $1,000 | $108,225 | $74,950 | $51,995 | $43,440 | $35,525 | $28,330 | $20,855 | $14,540 | $8,625 | $3,630 | $155 | ($3,137) |
| Total Liabilities and Capital | $1,000 | $149,574 | $99,383 | $81,116 | $76,916 | $67,478 | $61,356 | $54,925 | $50,452 | $44,841 | $41,369 | $40,315 | $36,804 |
| Net Worth | $1,000 | $108,225 | $74,950 | $51,995 | $43,440 | $35,525 | $28,330 | $20,855 | $14,540 | $8,625 | $3,630 | $155 | ($3,137) |

