
Infotext Strategy Letter
Executive Summary
The Infotext Strategy Letter is the core element of a monthly subscription service including the newsletter and website privileges. This is an expansion project for us. It will serve our business in several ways:
- Establish and validate the expertise.
- Generate visibility, leads, additional consulting clients.
- Offer an additional source of revenue.
This business plan focuses on the newsletter as if it were a separate entity. It is confidential, to be used internally as a guide to this new business expansion within our existing business.

1.1 Objectives
- 300 subscribers by the end of the first year, 1,000 by the end of the third year.
- 65% renewals.
- Cancellations of no more than 10%.
1.2 Keys to Success
- Excellence in fulfilling the promise – completely confidential, reliable, trustworthy expertise and information.
- Developing visibility to generate new business leads.
- Leveraging from a single pool of expertise into multiple revenue generation opportunities – the newsletter and subscription website, retainer consulting, project consulting, market research, and market research published reports.
1.3 Mission
The Infotext Strategy Letter provides high-tech marketers with important news, insights, advance notice of trends, case studies, and pragmatic real world advice about developments related to the worldwide marketing of high-tech products. It includes a monthly newsletter delivered electronically and an information archive delivered on the World Wide Web as a password-protected secure site.
Company Summary
For this internal expansion plan the details of our company are not relevant. We do intend to develop this new business, if approved, using a balance of one in-house salary and outside vendors for editing and some significant production work.
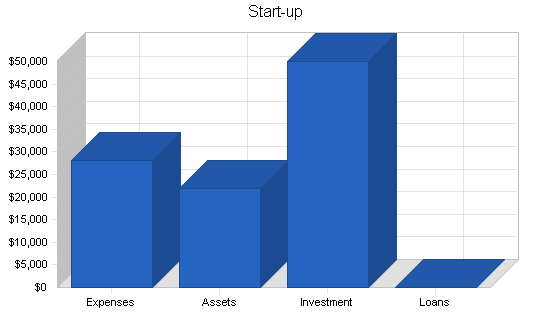
2.1 Start-up Summary
What’s important to understand is that this expansion requires some internal investment. We will need some legal work, some computer equipment, and office space. We also have to support the cash flow involved in hiring our main person, and the working capital involved in getting this business rolling.
| Start-up | |
| Requirements | |
| Start-up Expenses | |
| Legal | $500 |
| Hiring manager | $1,000 |
| Initial layout design | $3,000 |
| Website vendors | $17,500 |
| Initial mailing | $5,000 |
| Other | $1,000 |
| Total Start-up Expenses | $28,000 |
| Start-up Assets | |
| Cash Required | $15,000 |
| Other Current Assets | $7,000 |
| Long-term Assets | $0 |
| Total Assets | $22,000 |
| Total Requirements | $50,000 |
| Start-up Funding | |
| Start-up Expenses to Fund | $28,000 |
| Start-up Assets to Fund | $22,000 |
| Total Funding Required | $50,000 |
| Assets | |
| Non-cash Assets from Start-up | $7,000 |
| Cash Requirements from Start-up | $15,000 |
| Additional Cash Raised | $0 |
| Cash Balance on Starting Date | $15,000 |
| Total Assets | $22,000 |
| Liabilities and Capital | |
| Liabilities | |
| Current Borrowing | $0 |
| Long-term Liabilities | $0 |
| Accounts Payable (Outstanding Bills) | $0 |
| Other Current Liabilities (interest-free) | $0 |
| Total Liabilities | $0 |
| Capital | |
| Planned Investment | |
| Internal investment | $50,000 |
| Other | $0 |
| Additional Investment Requirement | $0 |
| Total Planned Investment | $50,000 |
| Loss at Start-up (Start-up Expenses) | ($28,000) |
| Total Capital | $22,000 |
| Total Capital and Liabilities | $22,000 |
| Total Funding | $50,000 |
Services
The related services include the Infotext Strategy Letter, to be delivered monthly, and the Infotext website, which is available to subscribers.
3.1 Service Description
- The Newsletter: Our target subscriber wants timely information about new developments in high-tech channel marketing including technology changes, economic trends, ideas and innovations, case studies, and interviews with industry leaders. We need to find the news that’s useful and relevant, but buried. Our subscriber is paying us $500 per year to find what’s important, and streamline their work of staying up to date with what’s going on and what’s new. The time function is a critical selling point – our subscriber saves time, but has the reassurance of knowing what’s going on.
- The Website: The website contains archives of past articles, reports gathered from the rest of Acme Consulting, audio with interviews, and compilation of links, related information, etc. It is a valuable resource that contributes to the value of the subscription.
3.2 Competitive Comparison
The competition comes in several forms:
- [Name omitted] – The quintessential high-tech newsletter, the one that others imitate. We won’t go straight up against this, because we have a different focus, narrowed more on the channels and marketing of high technology. This one should have a website attached to the subscription, but doesn’t.
- [Name omitted] – Like us, with a direct link to management consulting. They have built the website add-on very much like what we propose, but the newsletter is too general and fails to provide vital, focused information.
- The third general kind of competitor is the international market research company: International Data Corporation (IDC), Dataquest, Stanford Research Institute, etc. These companies are formidable competitors for published market research and market forums, and most of them also provide website information and newsletter subscriptions.
- The fourth kind of competition is the market-focus specific smaller house. For example: ChannelCorp in Vancouver BC, Channel Marketing in the US.
3.3 Fulfillment
- The key fulfillment and delivery will be provided by a newsletter and website editor-in-chief who will be responsible for the content. The newsletter will be delivered monthly. The subscribers can choose whether they want email delivery or hard copy delivery or both. The hard copy must be very well produced, edited, and always on time.
- We will turn to qualified vendors for freelance back-up in editing and production.
3.4 Technology
- The website will be built on Cold Fusion structure, to facilitate content management. Our editor will be qualified to manage the website through work with third-party vendors.
- The newsletter will be developed in Windows using Adobe products and delivered as an html newsletter, Adobe Acrobat document, or hard-copy newsletter.
- Complete desktop publishing facilities are an obvious necessity.
Market Analysis Summary
The Infotext Strategy Letter will be focusing on high-technology manufacturers of computer hardware and software, services, and networking, who want to sell into markets in the United States, Europe, and Latin America. These are mostly larger companies, and occasionally medium-sized companies.
Our most important group of potential customers are executives in larger corporations. These are marketing managers, general managers, sales managers, sometimes charged with international focus and sometimes charged with market or even specific channel focus. They do not want to waste their time or risk their money looking for bargain information or questionable expertise. As they go into markets looking at new opportunities, they are very sensitive to risking their company’s name and reputation.
4.1 Market Segmentation
Large manufacturer corporations – Our most important market segment is the large manufacturer of high-technology products, such as Apple, Hewlett-Packard, IBM, Microsoft, Siemens, or Olivetti. These companies will be calling on Acme for development functions that are better spun off than managed in-house, for market research, and for market forums.
Medium-sized growth companies – Particularly in software, multimedia, and some related high-growth fields, Acme will offer an attractive development alternative to the company that is management constrained and unable to address opportunities in new markets and new market segments.

| Market Analysis | |||||||
| Year 1 | Year 2 | Year 3 | Year 4 | Year 5 | |||
| Potential Customers | Growth | CAGR | |||||
| U.S. High Tech | 10% | 5,000 | 5,500 | 6,050 | 6,655 | 7,321 | 10.00% |
| European High Tech | 15% | 1,000 | 1,150 | 1,323 | 1,521 | 1,749 | 15.00% |
| Latin America | 35% | 250 | 338 | 456 | 616 | 832 | 35.07% |
| Other | 2% | 10,000 | 10,200 | 10,404 | 10,612 | 10,824 | 2.00% |
| Total | 6.27% | 16,250 | 17,188 | 18,233 | 19,404 | 20,726 | 6.27% |
4.2 Service Business Analysis
The newsletter “industry” is pulverized and disorganized, with thousands of smaller information vendors for every one of the few dozen well-known companies.
Newsletter publishers range from major international name-brand consulting and marketing research companies to dozens of individual experts.
4.2.1 Business Participants
There are some newsletters published by well-established major names in management consulting. Some of these are by accounting companies (e.g. Deloitte Touche Tohmatsu, PricewaterhouseCoopers) and some from management consulting (McKinsey, Bain). These newsletters tend to exist as marketing programs related to developing consulting leads. < P>
At the intermediate level are some function-specific or market-specific newsletters, many of them published by the market research firms (IDC, Dataquest) or channel development firms (ChannelCorp, Channel Strategies, ChannelMark).

Some newsletters are little more than adventuring by experts who want to market their expertise while temporarily out of work. There are however some long-term expertise-based newsletters put out by individuals, that nonetheless manage to earn long-term branding as high quality publications.
4.2.2 Distributing a Service
Newsletters, like consulting, will be sold and purchased mainly on a word-of-mouth basis, with relationships and previous experience being, by far, the most important factor.
The major name-brand newsletters have developed marketing programs involving direct mail, email, etc. They also work hard at searcher placement for their websites, and distribute in some cases through industry associations, business associations, Chambers of Commerce and industry, etc.
One of our advantages, we believe, will be the distribution through hard copy and/or email, at the subscriber’s option.
4.2.3 Competition and Buying Patterns
The key element in purchase decisions made at the Acme client level is trust in the professional reputation and reliability of the consulting firm behind the newsletter. Reliable delivery, on-time delivery, and valuable content are all vital. Our make or break will be whether or not the subscribers read the newsletter and/or use the website.
4.2.4 Main Competitors
The high-level prestige newsletters:
Strengths: International locations managed by owner-partners with a high level of presentation and understanding of general business. Enviable reputations which make purchase of newsletters an easy decision for a manager, often without regard to prices.
Weaknesses: General business knowledge doesn’t substitute for the specific market, channel, and distribution expertise of our newsletter, focusing on high-technology markets and products only.
The international market research companies’ newsletters:
Strengths: International offices, specific market knowledge, permanent staff developing market research information on permanent basis, good relationships with potential subscriber companies.
Weaknesses: Market numbers are not marketing, not channel development nor market development. Although these companies compete for some of the business our newsletter is after, they cannot really offer the same level of business understanding at a high level.
Market specific or function specific newsletters:
Strengths: Expertise in market or functional areas. Acme should not try to compete with [name omitted] or [name omitted] in their markets with market research, or with ChannelCorp in channel management.
Weaknesses: The inability to spread beyond a specific focus, or to rise above a specific focus, to provide actual management expertise, experience, and wisdom beyond the specifics.
4.3 Target Market Segment Strategy
As indicated by the previous table and chart, we must focus on a few thousand well-chosen potential subscribers in the United States, Europe, and Latin America. These few thousand high-tech manufacturing companies are the key customers for Acme.
Strategy and Implementation Summary
The Infotext Strategy Letter will focus on three geographical markets – the United States, Europe, and Latin America; and in limited product segments – personal computers, software, networks, telecommunications, personal organizers, and technology integration products.
The target subscriber is usually a manager in a larger corporation, and occasionally an owner or president of a medium-sized corporation in a high-growth period.
5.1 Sales Strategy
The sales forecast monthly summary is included in the appendix. The annual sales projections are included here. Subscribers, renewals, and cancellations, as well as sales units, are detailed in the General Assumptions table in the Financial Chapter.
For purposes of planning, we assume that a cancellation costs $300 on average. Cancellations will come at various times during the year, but on average a cancellation in the third month is a good guess.

| Sales Forecast | |||||
| Year 1 | Year 2 | Year 3 | Year 4 | Year 5 | |
| Sales | |||||
| Newsletter subscriptions | $151,206 | $211,720 | $296,250 | $414,750 | $580,650 |
| Cancellations | ($1,800) | ($2,700) | ($4,800) | ($8,100) | ($12,300) |
| Total Sales | $149,406 | $209,020 | $291,450 | $406,650 | $568,350 |
| Direct Cost of Sales | Year 1 | Year 2 | Year 3 | Year 4 | Year 5 |
| Outside editing | $7,959 | $0 | $0 | $0 | $0 |
| Outside Production | $7,959 | $0 | $0 | $0 | $0 |
| Physical Production | $11,938 | $13,000 | $14,000 | $15,000 | $17,000 |
| Other | $9,700 | $10,000 | $10,000 | $10,000 | $10,000 |
| Subtotal Direct Cost of Sales | $37,555 | $23,000 | $24,000 | $25,000 | $27,000 |
5.2 Milestones
Our detailed milestones are shown in the following table and chart. The related budgets are included with the expenses shown in the projected Profit and Loss statement, which is in the financial analysis that comes in Chapter 7 of this plan; or in the direct cost of sales portion of the sales forecast, for outside vendors.

| Milestones | |||||
| Milestone | Start Date | End Date | Budget | Manager | Department |
| Business plan | 6/1/2002 | 7/19/2002 | $0 | Hattusa M | Devpt |
| Hiring main manager | 7/19/2002 | 8/31/2002 | $1,000 | Hattusa M | Devpt |
| Initial layout design | 9/1/2002 | 9/30/2002 | $3,000 | TBD | Newsletter |
| Website prototype | 9/1/2002 | 11/15/2002 | $10,000 | TBD | Newsletter |
| Coverage plan, first year | 10/1/2002 | 12/15/2002 | $0 | TBD | Newsletter |
| Initial mailing | 11/15/2002 | 12/15/2002 | $5,000 | Arcadia F | Marketing |
| Website launch | 11/15/2002 | 12/15/2002 | $7,500 | TBD | Newsletter |
| Newsletter launch | 12/31/2002 | 1/10/2003 | $7,500 | Arcadia F | Marketing |
| Initial marketing | 1/10/2003 | 3/31/2003 | $10,000 | Arcadia F | Marketing |
| Initial content, first issue | 10/1/2002 | 11/31/2002 | $0 | TBD | Newsletter |
| Totals | $44,000 | ||||
Management Summary
The initial management team depends on a single well-chosen main content editor, who is responsible for the newsletter and website content. Editing and production work will be provided by third-party vendors.
6.1 Personnel Plan
The detailed monthly personnel plan for the first year is included in the appendix. The annual personnel estimates are included here.
| Personnel Plan | |||||
| Year 1 | Year 2 | Year 3 | Year 4 | Year 5 | |
| Newsletter manager | $66,000 | $69,000 | $72,000 | $76,000 | $80,000 |
| Editorial | $0 | $50,000 | $50,000 | $120,000 | $120,000 |
| Secretarial | $5,250 | $10,000 | $11,000 | $12,000 | $13,000 |
| Other | $0 | $5,000 | $15,000 | $16,000 | $17,000 |
| Total People | 2 | 2 | 2 | 2 | 2 |
| Total Payroll | $71,250 | $134,000 | $148,000 | $224,000 | $230,000 |
Financial Plan
Our financial plan is based on conservative estimates and assumptions. We will need to plan on initial investment to make the financials work.
7.1 Important Assumptions
The following table summarizes key financial assumptions including sales entirely on invoice basis, and present-day interest rates. The annual numbers are shown here, monthlies in the appendix.
Additional assumptions include 45-day average collection days, expenses mainly on net 30 basis, and 35 days on average for payment of invoices.
| General Assumptions | |||||
| Year 1 | Year 2 | Year 3 | Year 4 | Year 5 | |
| Plan Month | 1 | 2 | 3 | 4 | 5 |
| Current Interest Rate | 8.00% | 8.00% | 8.00% | 8.00% | 8.00% |
| Long-term Interest Rate | 10.00% | 10.00% | 10.00% | 10.00% | 10.00% |
| Tax Rate | 25.42% | 25.00% | 25.42% | 25.00% | 25.42% |
| New subscriptions | 383 | 37 | 383 | 37 | 383 |
| Renewals | 0 | 0 | 0 | 0 | 0 |
| Cancellations | 6 | 1 | 6 | 1 | 6 |
| Subscribers | 377 | 377 | 377 | 377 | 377 |
7.2 Break-even Analysis
The following table and chart summarize the break-even analysis, including monthly units and sales break-even points.

| Break-even Analysis | |
| Monthly Revenue Break-even | $10,889 |
| Assumptions: | |
| Average Percent Variable Cost | 25% |
| Estimated Monthly Fixed Cost | $8,152 |
7.3 Projected Profit and Loss
The detailed monthly pro-forma income statement for the first year is included in the appendix. The annual estimates are included here.


| Pro Forma Profit and Loss | |||||
| Year 1 | Year 2 | Year 3 | Year 4 | Year 5 | |
| Sales | $149,406 | $209,020 | $291,450 | $406,650 | $568,350 |
| Direct Cost of Sales | $37,555 | $23,000 | $24,000 | $25,000 | $27,000 |
| Other | $0 | $0 | $0 | $0 | $0 |
| Total Cost of Sales | $37,555 | $23,000 | $24,000 | $25,000 | $27,000 |
| Gross Margin | $111,851 | $186,020 | $267,450 | $381,650 | $541,350 |
| Gross Margin % | 74.86% | 89.00% | 91.77% | 93.85% | 95.25% |
| Expenses | |||||
| Payroll | $71,250 | $134,000 | $148,000 | $224,000 | $230,000 |
| Marketing | $14,500 | $22,000 | $33,000 | $50,000 | $75,000 |
| Depreciation | $0 | $0 | $0 | $0 | $0 |
| Leased Equipment | $1,200 | $1,000 | $1,000 | $1,000 | $1,000 |
| Insurance | $900 | $1,000 | $1,000 | $1,000 | $1,000 |
| Payroll Taxes | $9,975 | $18,760 | $20,720 | $31,360 | $32,200 |
| Other | $0 | $0 | $0 | $0 | $0 |
| Total Operating Expenses | $97,825 | $176,760 | $203,720 | $307,360 | $339,200 |
| Profit Before Interest and Taxes | $14,026 | $9,260 | $63,730 | $74,290 | $202,150 |
| EBITDA | $14,026 | $9,260 | $63,730 | $74,290 | $202,150 |
| Interest Expense | $1,067 | $4,200 | $4,200 | $400 | $400 |
| Taxes Incurred | $2,944 | $1,265 | $15,131 | $18,473 | $51,278 |
| Net Profit | $10,015 | $3,795 | $44,399 | $55,418 | $150,472 |
| Net Profit/Sales | 6.70% | 1.82% | 15.23% | 13.63% | 26.48% |
7.4 Projected Cash Flow
Cash flow projections are critical to our success. The monthly cash flow is shown in the illustration, with one bar representing the cash flow per month and the other representing the monthly balance. The annual cash flow figures are included here in the following table. Detailed monthly numbers are included in the appendix, and show as well in the following chart.

| Pro Forma Cash Flow | |||||
| Year 1 | Year 2 | Year 3 | Year 4 | Year 5 | |
| Cash Received | |||||
| Cash from Operations | |||||
| Cash Sales | $0 | $0 | $0 | $0 | $0 |
| Cash from Receivables | $128,058 | $200,502 | $279,672 | $390,190 | $545,245 |
| Subtotal Cash from Operations | $128,058 | $200,502 | $279,672 | $390,190 | $545,245 |
| Additional Cash Received | |||||
| Sales Tax, VAT, HST/GST Received | $0 | $0 | $0 | $0 | $0 |
| New Current Borrowing | $15,000 | $100,000 | $0 | $0 | $0 |
| New Other Liabilities (interest-free) | $0 | $0 | $0 | $0 | $0 |
| New Long-term Liabilities | $0 | $0 | $0 | $0 | $0 |
| Sales of Other Current Assets | $0 | $0 | $0 | $0 | $0 |
| Sales of Long-term Assets | $0 | $0 | $0 | $0 | $0 |
| New Investment Received | $0 | $0 | $0 | $0 | $0 |
| Subtotal Cash Received | $143,058 | $300,502 | $279,672 | $390,190 | $545,245 |
| Expenditures | Year 1 | Year 2 | Year 3 | Year 4 | Year 5 |
| Expenditures from Operations | |||||
| Cash Spending | $71,250 | $134,000 | $148,000 | $224,000 | $230,000 |
| Bill Payments | $61,961 | $70,575 | $96,382 | $124,530 | $182,063 |
| Subtotal Spent on Operations | $133,211 | $204,575 | $244,382 | $348,530 | $412,063 |
| Additional Cash Spent | |||||
| Sales Tax, VAT, HST/GST Paid Out | $0 | $0 | $0 | $0 | $0 |
| Principal Repayment of Current Borrowing | $10,000 | $5,000 | $95,000 | $0 | $0 |
| Other Liabilities Principal Repayment | $0 | $0 | $0 | $0 | $0 |
| Long-term Liabilities Principal Repayment | $0 | $0 | $0 | $0 | $0 |
| Purchase Other Current Assets | $0 | $0 | $0 | $0 | $0 |
| Purchase Long-term Assets | $0 | $0 | $0 | $0 | $0 |
| Dividends | $0 | $0 | $0 | $0 | $0 |
| Subtotal Cash Spent | $143,211 | $209,575 | $339,382 | $348,530 | $412,063 |
| Net Cash Flow | ($153) | $90,927 | ($59,710) | $41,659 | $133,183 |
| Cash Balance | $14,847 | $105,774 | $46,064 | $87,723 | $220,906 |
7.5 Projected Balance Sheet
The balance sheet shows healthy growth of net worth, and strong financial position. The monthly estimates are included in the appendix.
| Pro Forma Balance Sheet | |||||
| Year 1 | Year 2 | Year 3 | Year 4 | Year 5 | |
| Assets | |||||
| Current Assets | |||||
| Cash | $14,847 | $105,774 | $46,064 | $87,723 | $220,906 |
| Accounts Receivable | $21,348 | $29,866 | $41,644 | $58,104 | $81,209 |
| Other Current Assets | $7,000 | $7,000 | $7,000 | $7,000 | $7,000 |
| Total Current Assets | $43,195 | $142,640 | $94,708 | $152,828 | $309,115 |
| Long-term Assets | |||||
| Long-term Assets | $0 | $0 | $0 | $0 | $0 |
| Accumulated Depreciation | $0 | $0 | $0 | $0 | $0 |
| Total Long-term Assets | $0 | $0 | $0 | $0 | $0 |
| Total Assets | $43,195 | $142,640 | $94,708 | $152,828 | $309,115 |
| Liabilities and Capital | Year 1 | Year 2 | Year 3 | Year 4 | Year 5 |
| Current Liabilities | |||||
| Accounts Payable | $6,180 | $6,830 | $9,498 | $12,200 | $18,016 |
| Current Borrowing | $5,000 | $100,000 | $5,000 | $5,000 | $5,000 |
| Other Current Liabilities | $0 | $0 | $0 | $0 | $0 |
| Subtotal Current Liabilities | $11,180 | $106,830 | $14,498 | $17,200 | $23,016 |
| Long-term Liabilities | $0 | $0 | $0 | $0 | $0 |
| Total Liabilities | $11,180 | $106,830 | $14,498 | $17,200 | $23,016 |
| Paid-in Capital | $50,000 | $50,000 | $50,000 | $50,000 | $50,000 |
| Retained Earnings | ($28,000) | ($17,985) | ($14,190) | $30,210 | $85,627 |
| Earnings | $10,015 | $3,795 | $44,399 | $55,418 | $150,472 |
| Total Capital | $32,015 | $35,810 | $80,210 | $135,627 | $286,099 |
| Total Liabilities and Capital | $43,195 | $142,640 | $94,708 | $152,828 | $309,115 |
| Net Worth | $32,015 | $35,810 | $80,210 | $135,627 | $286,099 |
7.6 Business Ratios
The following table shows the projected business ratios. We expect to maintain healthy ratios for profitability, risk, and return. Industry profile ratios based on the Standard Industrial Classification (SIC) code 2741, Newsletter Publishing, are shown for comparison.
| Ratio Analysis | ||||||
| Year 1 | Year 2 | Year 3 | Year 4 | Year 5 | Industry Profile | |
| Sales Growth | 0.00% | 39.90% | 39.44% | 39.53% | 39.76% | 11.27% |
| Percent of Total Assets | ||||||
| Accounts Receivable | 49.42% | 20.94% | 43.97% | 38.02% | 26.27% | 36.32% |
| Other Current Assets | 16.21% | 4.91% | 7.39% | 4.58% | 2.26% | 31.17% |
| Total Current Assets | 100.00% | 100.00% | 100.00% | 100.00% | 100.00% | 83.20% |
| Long-term Assets | 0.00% | 0.00% | 0.00% | 0.00% | 0.00% | 16.80% |
| Total Assets | 100.00% | 100.00% | 100.00% | 100.00% | 100.00% | 100.00% |
| Current Liabilities | 25.88% | 74.89% | 15.31% | 11.25% | 7.45% | 31.26% |
| Long-term Liabilities | 0.00% | 0.00% | 0.00% | 0.00% | 0.00% | 20.58% |
| Total Liabilities | 25.88% | 74.89% | 15.31% | 11.25% | 7.45% | 51.84% |
| Net Worth | 74.12% | 25.11% | 84.69% | 88.75% | 92.55% | 48.16% |
| Percent of Sales | ||||||
| Sales | 100.00% | 100.00% | 100.00% | 100.00% | 100.00% | 100.00% |
| Gross Margin | 74.86% | 89.00% | 91.77% | 93.85% | 95.25% | 51.42% |
| Selling, General & Administrative Expenses | 69.36% | 87.90% | 77.94% | 81.99% | 69.89% | 34.28% |
| Advertising Expenses | 24.10% | 19.14% | 15.10% | 0.00% | 0.00% | 2.77% |
| Profit Before Interest and Taxes | 9.39% | 4.43% | 21.87% | 18.27% | 35.57% | 2.19% |
| Main Ratios | ||||||
| Current | 3.86 | 1.34 | 6.53 | 8.89 | 13.43 | 2.32 |
| Quick | 3.86 | 1.34 | 6.53 | 8.89 | 13.43 | 1.50 |
| Total Debt to Total Assets | 25.88% | 74.89% | 15.31% | 11.25% | 7.45% | 56.90% |
| Pre-tax Return on Net Worth | 40.48% | 14.13% | 74.22% | 54.48% | 70.52% | 3.39% |
| Pre-tax Return on Assets | 30.00% | 3.55% | 62.86% | 48.35% | 65.27% | 7.88% |
| Additional Ratios | Year 1 | Year 2 | Year 3 | Year 4 | Year 5 | |
| Net Profit Margin | 6.70% | 1.82% | 15.23% | 13.63% | 26.48% | n.a |
| Return on Equity | 31.28% | 10.60% | 55.35% | 40.86% | 52.59% | n.a |
| Activity Ratios | ||||||
| Accounts Receivable Turnover | 7.00 | 7.00 | 7.00 | 7.00 | 7.00 | n.a |
| Collection Days | 43 | 45 | 45 | 45 | 45 | n.a |
| Accounts Payable Turnover | 11.03 | 10.43 | 10.43 | 10.43 | 10.43 | n.a |
| Payment Days | 32 | 33 | 30 | 31 | 29 | n.a |
| Total Asset Turnover | 3.46 | 1.47 | 3.08 | 2.66 | 1.84 | n.a |
| Debt Ratios | ||||||
| Debt to Net Worth | 0.35 | 2.98 | 0.18 | 0.13 | 0.08 | n.a |
| Current Liab. to Liab. | 1.00 | 1.00 | 1.00 | 1.00 | 1.00 | n.a |
| Liquidity Ratios | ||||||
| Net Working Capital | $32,015 | $35,810 | $80,210 | $135,627 | $286,099 | n.a |
| Interest Coverage | 13.15 | 2.20 | 15.17 | 185.73 | 505.38 | n.a |
| Additional Ratios | ||||||
| Assets to Sales | 0.29 | 0.68 | 0.32 | 0.38 | 0.54 | n.a |
| Current Debt/Total Assets | 26% | 75% | 15% | 11% | 7% | n.a |
| Acid Test | 1.95 | 1.06 | 3.66 | 5.51 | 9.90 | n.a |
| Sales/Net Worth | 4.67 | 5.84 | 3.63 | 3.00 | 1.99 | n.a |
| Dividend Payout | 0.00 | 0.00 | 0.00 | 0.00 | 0.00 | n.a |
Appendix
| Sales Forecast | |||||||||||||
| Month 1 | Month 2 | Month 3 | Month 4 | Month 5 | Month 6 | Month 7 | Month 8 | Month 9 | Month 10 | Month 11 | Month 12 | ||
| Sales | |||||||||||||
| Newsletter subscriptions | 39500% | $13,312 | $12,522 | $8,611 | $8,769 | $10,566 | $11,870 | $12,522 | $13,173 | $14,477 | $15,283 | $15,591 | $14,512 |
| Cancellations | -30000% | $0 | $0 | $0 | $0 | $0 | $0 | ($300) | ($300) | ($300) | ($300) | ($300) | ($300) |
| Total Sales | $13,312 | $12,522 | $8,611 | $8,769 | $10,566 | $11,870 | $12,222 | $12,873 | $14,177 | $14,983 | $15,291 | $14,212 | |
| Direct Cost of Sales | Month 1 | Month 2 | Month 3 | Month 4 | Month 5 | Month 6 | Month 7 | Month 8 | Month 9 | Month 10 | Month 11 | Month 12 | |
| Outside editing | 10% | $500 | $525 | $551 | $579 | $608 | $638 | $670 | $704 | $739 | $776 | $814 | $855 |
| Outside Production | 10% | $500 | $525 | $551 | $579 | $608 | $638 | $670 | $704 | $739 | $776 | $814 | $855 |
| Physical Production | 10% | $750 | $788 | $827 | $868 | $912 | $957 | $1,005 | $1,055 | $1,108 | $1,163 | $1,222 | $1,283 |
| Other | 2% | $7,500 | $200 | $200 | $200 | $200 | $200 | $200 | $200 | $200 | $200 | $200 | $200 |
| Subtotal Direct Cost of Sales | $9,250 | $2,038 | $2,129 | $2,226 | $2,327 | $2,433 | $2,545 | $2,662 | $2,786 | $2,915 | $3,051 | $3,193 | |
| Personnel Plan | |||||||||||||
| Month 1 | Month 2 | Month 3 | Month 4 | Month 5 | Month 6 | Month 7 | Month 8 | Month 9 | Month 10 | Month 11 | Month 12 | ||
| Newsletter manager | 5% | $5,500 | $5,500 | $5,500 | $5,500 | $5,500 | $5,500 | $5,500 | $5,500 | $5,500 | $5,500 | $5,500 | $5,500 |
| Editorial | 0% | $0 | $0 | $0 | $0 | $0 | $0 | $0 | $0 | $0 | $0 | $0 | $0 |
| Secretarial | 5% | $0 | $0 | $0 | $0 | $0 | $0 | $0 | $0 | $0 | $1,750 | $1,750 | $1,750 |
| Other | 5% | $0 | $0 | $0 | $0 | $0 | $0 | $0 | $0 | $0 | $0 | $0 | $0 |
| Total People | 1 | 1 | 1 | 1 | 1 | 1 | 1 | 1 | 1 | 2 | 2 | 2 | |
| Total Payroll | $5,500 | $5,500 | $5,500 | $5,500 | $5,500 | $5,500 | $5,500 | $5,500 | $5,500 | $7,250 | $7,250 | $7,250 | |
| General Assumptions | |||||||||||||
| Month 1 | Month 2 | Month 3 | Month 4 | Month 5 | Month 6 | Month 7 | Month 8 | Month 9 | Month 10 | Month 11 | Month 12 | ||
| Plan Month | 1 | 2 | 3 | 4 | 5 | 6 | 7 | 8 | 9 | 10 | 11 | 12 | |
| Current Interest Rate | 8.00% | 8.00% | 8.00% | 8.00% | 8.00% | 8.00% | 8.00% | 8.00% | 8.00% | 8.00% | 8.00% | 8.00% | |
| Long-term Interest Rate | 10.00% | 10.00% | 10.00% | 10.00% | 10.00% | 10.00% | 10.00% | 10.00% | 10.00% | 10.00% | 10.00% | 10.00% | |
| Tax Rate | 30.00% | 25.00% | 25.00% | 25.00% | 25.00% | 25.00% | 25.00% | 25.00% | 25.00% | 25.00% | 25.00% | 25.00% | |
| New subscriptions | 0 | 34 | 32 | 22 | 22 | 27 | 30 | 32 | 33 | 37 | 39 | 39 | 37 |
| Renewals | 1 | 0 | 0 | 0 | 0 | 0 | 0 | 0 | 0 | 0 | 0 | 0 | 0 |
| Cancellations | 0 | 0 | 0 | 0 | 0 | 0 | 0 | 1 | 1 | 1 | 1 | 1 | 1 |
| Subscribers | 34 | 65 | 87 | 109 | 136 | 166 | 197 | 229 | 265 | 303 | 341 | 377 | |
| Pro Forma Profit and Loss | |||||||||||||
| Month 1 | Month 2 | Month 3 | Month 4 | Month 5 | Month 6 | Month 7 | Month 8 | Month 9 | Month 10 | Month 11 | Month 12 | ||
| Sales | $13,312 | $12,522 | $8,611 | $8,769 | $10,566 | $11,870 | $12,222 | $12,873 | $14,177 | $14,983 | $15,291 | $14,212 | |
| Direct Cost of Sales | $9,250 | $2,038 | $2,129 | $2,226 | $2,327 | $2,433 | $2,545 | $2,662 | $2,786 | $2,915 | $3,051 | $3,193 | |
| Other | $0 | $0 | $0 | $0 | $0 | $0 | $0 | $0 | $0 | $0 | $0 | $0 | |
| Total Cost of Sales | $9,250 | $2,038 | $2,129 | $2,226 | $2,327 | $2,433 | $2,545 | $2,662 | $2,786 | $2,915 | $3,051 | $3,193 | |
| Gross Margin | $4,062 | $10,484 | $6,482 | $6,543 | $8,239 | $9,436 | $9,676 | $10,211 | $11,391 | $12,068 | $12,240 | $11,019 | |
| Gross Margin % | 30.51% | 83.73% | 75.27% | 74.62% | 77.98% | 79.50% | 79.17% | 79.32% | 80.35% | 80.55% | 80.05% | 77.53% | |
| Expenses | |||||||||||||
| Payroll | $5,500 | $5,500 | $5,500 | $5,500 | $5,500 | $5,500 | $5,500 | $5,500 | $5,500 | $7,250 | $7,250 | $7,250 | |
| Marketing | 50% | $3,500 | $3,500 | $3,000 | $500 | $500 | $500 | $500 | $500 | $500 | $500 | $500 | $500 |
| Depreciation | 0% | $0 | $0 | $0 | $0 | $0 | $0 | $0 | $0 | $0 | $0 | $0 | $0 |
| Leased Equipment | 5% | $100 | $100 | $100 | $100 | $100 | $100 | $100 | $100 | $100 | $100 | $100 | $100 |
| Insurance | 5% | $75 | $75 | $75 | $75 | $75 | $75 | $75 | $75 | $75 | $75 | $75 | $75 |
| Payroll Taxes | 14% | $770 | $770 | $770 | $770 | $770 | $770 | $770 | $770 | $770 | $1,015 | $1,015 | $1,015 |
| Other | 5% | $0 | $0 | $0 | $0 | $0 | $0 | $0 | $0 | $0 | $0 | $0 | $0 |
| Total Operating Expenses | $9,945 | $9,945 | $9,445 | $6,945 | $6,945 | $6,945 | $6,945 | $6,945 | $6,945 | $8,940 | $8,940 | $8,940 | |
| Profit Before Interest and Taxes | ($5,884) | $539 | ($2,963) | ($402) | $1,294 | $2,491 | $2,731 | $3,266 | $4,446 | $3,128 | $3,300 | $2,079 | |
| EBITDA | ($5,884) | $539 | ($2,963) | ($402) | $1,294 | $2,491 | $2,731 | $3,266 | $4,446 | $3,128 | $3,300 | $2,079 | |
| Interest Expense | $33 | $100 | $100 | $100 | $100 | $100 | $100 | $100 | $100 | $100 | $100 | $33 | |
| Taxes Incurred | ($1,775) | $110 | ($766) | ($125) | $299 | $598 | $658 | $791 | $1,087 | $757 | $800 | $511 | |
| Net Profit | ($4,142) | $329 | ($2,298) | ($376) | $896 | $1,793 | $1,973 | $2,374 | $3,260 | $2,271 | $2,400 | $1,534 | |
| Net Profit/Sales | -31.11% | 2.63% | -26.68% | -4.29% | 8.48% | 15.11% | 16.15% | 18.44% | 22.99% | 15.16% | 15.70% | 10.80% | |
| Pro Forma Cash Flow | |||||||||||||
| Month 1 | Month 2 | Month 3 | Month 4 | Month 5 | Month 6 | Month 7 | Month 8 | Month 9 | Month 10 | Month 11 | Month 12 | ||
| Cash Received | |||||||||||||
| Cash from Operations | |||||||||||||
| Cash Sales | $0 | $0 | $0 | $0 | $0 | $0 | $0 | $0 | $0 | $0 | $0 | $0 | |
| Cash from Receivables | $0 | $7,099 | $12,890 | $10,436 | $8,695 | $9,728 | $11,261 | $12,057 | $12,569 | $13,568 | $14,607 | $15,147 | |
| Subtotal Cash from Operations | $0 | $7,099 | $12,890 | $10,436 | $8,695 | $9,728 | $11,261 | $12,057 | $12,569 | $13,568 | $14,607 | $15,147 | |
| Additional Cash Received | |||||||||||||
| Sales Tax, VAT, HST/GST Received | 0.00% | $0 | $0 | $0 | $0 | $0 | $0 | $0 | $0 | $0 | $0 | $0 | $0 |
| New Current Borrowing | $5,000 | $10,000 | $0 | $0 | $0 | $0 | $0 | $0 | $0 | $0 | $0 | $0 | |
| New Other Liabilities (interest-free) | $0 | $0 | $0 | $0 | $0 | $0 | $0 | $0 | $0 | $0 | $0 | $0 | |
| New Long-term Liabilities | $0 | $0 | $0 | $0 | $0 | $0 | $0 | $0 | $0 | $0 | $0 | $0 | |
| Sales of Other Current Assets | $0 | $0 | $0 | $0 | $0 | $0 | $0 | $0 | $0 | $0 | $0 | $0 | |
| Sales of Long-term Assets | $0 | $0 | $0 | $0 | $0 | $0 | $0 | $0 | $0 | $0 | $0 | $0 | |
| New Investment Received | $0 | $0 | $0 | $0 | $0 | $0 | $0 | $0 | $0 | $0 | $0 | $0 | |
| Subtotal Cash Received | $5,000 | $17,099 | $12,890 | $10,436 | $8,695 | $9,728 | $11,261 | $12,057 | $12,569 | $13,568 | $14,607 | $15,147 | |
| Expenditures | Month 1 | Month 2 | Month 3 | Month 4 | Month 5 | Month 6 | Month 7 | Month 8 | Month 9 | Month 10 | Month 11 | Month 12 | |
| Expenditures from Operations | |||||||||||||
| Cash Spending | $5,500 | $5,500 | $5,500 | $5,500 | $5,500 | $5,500 | $5,500 | $5,500 | $5,500 | $7,250 | $7,250 | $7,250 | |
| Bill Payments | $0 | $10,360 | $7,394 | $5,580 | $3,880 | $4,101 | $4,522 | $4,725 | $4,965 | $5,361 | $5,456 | $5,617 | |
| Subtotal Spent on Operations | $5,500 | $15,860 | $12,894 | $11,080 | $9,380 | $9,601 | $10,022 | $10,225 | $10,465 | $12,611 | $12,706 | $12,867 | |
| Additional Cash Spent | |||||||||||||
| Sales Tax, VAT, HST/GST Paid Out | $0 | $0 | $0 | $0 | $0 | $0 | $0 | $0 | $0 | $0 | $0 | $0 | |
| Principal Repayment of Current Borrowing | $0 | $0 | $0 | $0 | $0 | $0 | $0 | $0 | $0 | $0 | $0 | $10,000 | |
| Other Liabilities Principal Repayment | $0 | $0 | $0 | $0 | $0 | $0 | $0 | $0 | $0 | $0 | $0 | $0 | |
| Long-term Liabilities Principal Repayment | $0 | $0 | $0 | $0 | $0 | $0 | $0 | $0 | $0 | $0 | $0 | $0 | |
| Purchase Other Current Assets | $0 | $0 | $0 | $0 | $0 | $0 | $0 | $0 | $0 | $0 | $0 | $0 | |
| Purchase Long-term Assets | $0 | $0 | $0 | $0 | $0 | $0 | $0 | $0 | $0 | $0 | $0 | $0 | |
| Dividends | $0 | $0 | $0 | $0 | $0 | $0 | $0 | $0 | $0 | $0 | $0 | $0 | |
| Subtotal Cash Spent | $5,500 | $15,860 | $12,894 | $11,080 | $9,380 | $9,601 | $10,022 | $10,225 | $10,465 | $12,611 | $12,706 | $22,867 | |
| Net Cash Flow | ($500) | $1,240 | ($4) | ($644) | ($685) | $127 | $1,239 | $1,832 | $2,104 | $957 | $1,901 | ($7,720) | |
| Cash Balance | $14,500 | $15,740 | $15,736 | $15,093 | $14,407 | $14,534 | $15,774 | $17,606 | $19,709 | $20,667 | $22,567 | $14,847 | |
| Pro Forma Balance Sheet | |||||||||||||
| Month 1 | Month 2 | Month 3 | Month 4 | Month 5 | Month 6 | Month 7 | Month 8 | Month 9 | Month 10 | Month 11 | Month 12 | ||
| Assets | Starting Balances | ||||||||||||
| Current Assets | |||||||||||||
| Cash | $15,000 | $14,500 | $15,740 | $15,736 | $15,093 | $14,407 | $14,534 | $15,774 | $17,606 | $19,709 | $20,667 | $22,567 | $14,847 |
| Accounts Receivable | $0 | $13,312 | $18,734 | $14,454 | $12,787 | $14,658 | $16,801 | $17,761 | $18,577 | $20,184 | $21,598 | $22,283 | $21,348 |
| Other Current Assets | $7,000 | $7,000 | $7,000 | $7,000 | $7,000 | $7,000 | $7,000 | $7,000 | $7,000 | $7,000 | $7,000 | $7,000 | $7,000 |
| Total Current Assets | $22,000 | $34,812 | $41,473 | $37,191 | $34,880 | $36,066 | $38,335 | $40,534 | $43,182 | $46,894 | $49,265 | $51,850 | $43,195 |
| Long-term Assets | |||||||||||||
| Long-term Assets | $0 | $0 | $0 | $0 | $0 | $0 | $0 | $0 | $0 | $0 | $0 | $0 | $0 |
| Accumulated Depreciation | $0 | $0 | $0 | $0 | $0 | $0 | $0 | $0 | $0 | $0 | $0 | $0 | $0 |
| Total Long-term Assets | $0 | $0 | $0 | $0 | $0 | $0 | $0 | $0 | $0 | $0 | $0 | $0 | $0 |
| Total Assets | $22,000 | $34,812 | $41,473 | $37,191 | $34,880 | $36,066 | $38,335 | $40,534 | $43,182 | $46,894 | $49,265 | $51,850 | $43,195 |
| Liabilities and Capital | Month 1 | Month 2 | Month 3 | Month 4 | Month 5 | Month 6 | Month 7 | Month 8 | Month 9 | Month 10 | Month 11 | Month 12 | |
| Current Liabilities | |||||||||||||
| Accounts Payable | $0 | $11,953 | $8,286 | $6,301 | $4,367 | $4,657 | $5,132 | $5,358 | $5,632 | $6,084 | $6,184 | $6,369 | $6,180 |
| Current Borrowing | $0 | $5,000 | $15,000 | $15,000 | $15,000 | $15,000 | $15,000 | $15,000 | $15,000 | $15,000 | $15,000 | $15,000 | $5,000 |
| Other Current Liabilities | $0 | $0 | $0 | $0 | $0 | $0 | $0 | $0 | $0 | $0 | $0 | $0 | $0 |
| Subtotal Current Liabilities | $0 | $16,953 | $23,286 | $21,301 | $19,367 | $19,657 | $20,132 | $20,358 | $20,632 | $21,084 | $21,184 | $21,369 | $11,180 |
| Long-term Liabilities | $0 | $0 | $0 | $0 | $0 | $0 | $0 | $0 | $0 | $0 | $0 | $0 | $0 |
| Total Liabilities | $0 | $16,953 | $23,286 | $21,301 | $19,367 | $19,657 | $20,132 | $20,358 | $20,632 | $21,084 | $21,184 | $21,369 | $11,180 |
| Paid-in Capital | $50,000 | $50,000 | $50,000 | $50,000 | $50,000 | $50,000 | $50,000 | $50,000 | $50,000 | $50,000 | $50,000 | $50,000 | $50,000 |
| Retained Earnings | ($28,000) | ($28,000) | ($28,000) | ($28,000) | ($28,000) | ($28,000) | ($28,000) | ($28,000) | ($28,000) | ($28,000) | ($28,000) | ($28,000) | ($28,000) |
| Earnings | $0 | ($4,142) | ($3,813) | ($6,110) | ($6,486) | ($5,591) | ($3,797) | ($1,824) | $550 | $3,810 | $6,081 | $8,481 | $10,015 |
| Total Capital | $22,000 | $17,858 | $18,187 | $15,890 | $15,514 | $16,409 | $18,203 | $20,176 | $22,550 | $25,810 | $28,081 | $30,481 | $32,015 |
| Total Liabilities and Capital | $22,000 | $34,812 | $41,473 | $37,191 | $34,880 | $36,066 | $38,335 | $40,534 | $43,182 | $46,894 | $49,265 | $51,850 | $43,195 |
| Net Worth | $22,000 | $17,858 | $18,187 | $15,890 | $15,514 | $16,409 | $18,203 | $20,176 | $22,550 | $25,810 | $28,081 | $30,481 | $32,015 |


