
People's News
Executive Summary
People’s News will be a new, small chain of newsagent kiosks located in Chinatown, New York City. Prepared to launch in 2010, the business will open subway station newsstands selling a combination of English language and Chinese language periodicals as well as drinks and snacks appropriate for both markets. Customers are expected to be residents of Chinatown, commuters, visitors, and tourists, as Chinatown is both a shopping and tourism destination for out-of-towners and NYC residents from other neighborhoods. People’s News is so-named for the People’s Republic of China, and will seek to offer a taste of mainland China periodicals and products to customers. It will also provide introductions to American publications to increase the exposure of Chinese immigrants to American culture and language and to better serve English-speaking customers. People’s News will be owned and managed by Hui Kao, previously a shop owner in China, along with his son, Zhi Kao.
People’s News will sell the following products at its kiosk locations: Chinese magazines and newspapers, Chinese-American magazines and newspapers, American magazines and newspapers, refrigerated beverages, snacks, and candy. Newspapers will be both daily and weekly and magazines will be weekly and monthly.
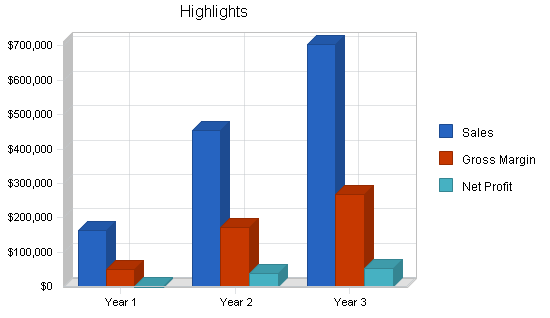
The business will have a small loss in its first year of operations, but will use its positive cash flows in the second and third years to expand to three stores within three years and to provide steady income for Hui and Zhi Kao as well as two other relatives or other employees. Revenue is expected to exceed $700,000 per year when three stores are in operation.
Objectives
People’s News intends to meet the following objectives in its first three years of operation:
- Establish three store locations
- >Provide full-time employment for four individuals (ideally members of the owner’s family)
- Reach revenues of $700,000 per year
Mission
The mission of People’s News is to gain a regular, loyal customer base by selling American and Chinese newspapers, magazines, candy, snacks, and drinks to residents and visitors to Chinatown, New York City. The company intends to remain family-owned and managed, provide employment for as many members of the Kao family as possible and create steady incomes for those family members. The business will increase cultural awareness in two ways: by offering Chinese-American residents greater exposure to American products and periodicals than they can get at other Chinatown newsstands and by offering non-Chinese customers recommendations on Chinese and Chinese-American products and periodicals.
Keys to Success
Keys to success for the newsagent or newsstand business include:
-
Choosing highly-trafficked locations for the stands
-
Offering desirable snacks and beverages as well as reading material for customers who are traveling or about to travel by subway or bus
-
Earning better prices from suppliers through greater volume (expanding to additional locations and centralizing purchasing)
People’s News believes that its particular success will also hinge on ensuring that all employees are bi- or trilingual (English and Mandarin at least and English, Mandarin, and Cantonese at best).
Company Summary
People’s News will be a new, small chain of newsagent kiosks located in Chinatown, New York City. Prepared to launch in 2010, the business will open subway station newsstands selling a combination of English language and Chinese language periodicals as well as drinks and snacks appropriate for both markets. Customers are expected to be residents of Chinatown, commuters, visitors, and tourists, as Chinatown is both a shopping and tourism destination for out-of-towners and NYC residents from other neighborhoods. People’s News is so-named for the People’s Republic of China, and will seek to offer a taste of mainland China periodicals and products to customers. It will also provide introductions to American publications to increase the exposure of Chinese immigrants to American culture and language and to better serve English-speaking customers.
Company Ownership
People’s News will be owned and managed by Hui Kao, previously a shop owner in China. It will be incorporated as a limited liability partnership with Hui Kao owning 80% of the business and his 22-year-old son, Zhi Kao, owning 20% of the business. Hui Kao plans to give his ownership stake to his son, daughter and/or wife upon his retirement or death. The business is designed to be operated primarily by its owners so that wages and dividends can provide steady income.
Start-up Summary
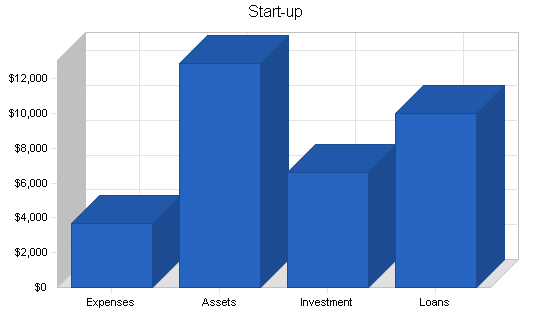
Start-up costs for People’s News are limited. The first location for the store will ideally be an existing kiosk which has been abandoned by a previous tenant. People’s News will work with the New York Metropolitan Transit Authority to find a suitable location in the Chinatown area. The ideal location will be at least 75 square feet and located within a subway station. Legal advice will be purchased for low cost through subsidized help from a local Chinese-American nonprofit. Insurance will be paid in monthly installments for liability and business owner’s insurance to protect against liability to employees, customers and the property of the business. $500 in renovations will be budgeted to make basic repairs, refinish, and repaint to improve the stand’s appearance.
Based on a survey of other newsagent businesses, the kiosk will have an estimated rent of $500 per month, and one month must be rented before launch to allow for set-up and renovation. Permits and licenses include incorporation, a Department of Consumer Affairs license, Community Board permit, and Department of Transportation license.
Start-up assets include the cash required to cover operating losses in the early months of operations, basic start-up inventory of $1,000 ($350 for monthly periodicals, $350 for weekly periodicals, $100 for snacks, $100 for drinks, and $100 for candy), current assets ($500 security deposit on space), long-term assets ($500 for refrigerator, $200 for food/snack displays, $200 for periodical racks, $300 for cash register, and $200 for other sundry items).
| Start-up | |
| Requirements | |
| Start-up Expenses | |
| Legal Advice | $500 |
| Insurance | $200 |
| Renovations | $500 |
| Store Rent | $500 |
| Permits and Licenses | $2,000 |
| Total Start-up Expenses | $3,700 |
| Start-up Assets | |
| Cash Required | $10,000 |
| Start-up Inventory | $1,000 |
| Other Current Assets | $500 |
| Long-term Assets | $1,400 |
| Total Assets | $12,900 |
| Total Requirements | $16,600 |
Products
People’s News will sell the following products at its kiosk locations:
- Chinese magazines and newspapers (Beijing Daily, China Daily, China Youth Daily, People’s Daily, China Press, Caijing magazine and two dozen more)
- Chinese-American magazines and newspapers (approximately a dozen titles)
- American magazines and newspapers (NY Times, Daily News, New York Post, People, Entertainment Weekly, and dozens more)
- Refrigerated Beverages (sodas, juices, energy drinks, iced teas, etc.)
- Snacks (bags of chips, pretzels, Fritos, Chinese crispy snacks, etc.)
- Candy (chocolate bars, gums, breath fresheners, Chinese candy, etc.)
Newspapers will be both daily and weekly and magazines will be weekly and monthly. Publications and product deliveries will be dropped off directly to the primary kiosk location and will be distributed by employees to the other locations, when they are added, in order to earn better prices from suppliers.
Where possible, multiple products or periodicals will be purchased from the same supplier in order to decrease the overall number of suppliers. However, there will be a focus on providing a reasonable level of product diversity, at least on par with other newsagents/newsstands. People’s News cannot offer the same diversity of offerings as a magazine or news store with 100 square feet or more of space, but it will offer extreme convenience due to its locations on subway platforms.

Market Analysis Summary
The market for People’s News products is broken into a few separate groups, each with their own needs:
- Non-English speaking Chinese-American residents of Chinatown
- English speaking Chinese-American residents of Chinatown
- Chinese and Chinese-American tourists from elsewhere
- Other English speaking tourists from outside of New York City
- New York City residents shopping in Chinatown
- New York City commuters passing through or changing trains in Chinatown
The type of customers cannot be influenced by People’s News beyond its selection of location. The business will rely 100% on serving the type of customers who use the subway lines out of Chinatown. These six groups are the primary market segments People’s News will serve.
Market Segmentation
The market’s six groups are estimated based on Census data, NYC tourism data, and NYC commuter data. These groups are all growing, but Chinese tourism to the US and Chinese immigration to NYC is increasing faster than the other segments due to growing openness between the nations.
The following are descriptions of the specific needs of each segment as they relate to People’s News.
- Non-English speaking Chinese-American residents of Chinatown: Desire Chinese-language periodicals (Mandarin and Cantonese at least) that they are familiar with. As they attempt to learn English, many begin to read English-language publications as well.
- English speaking Chinese-American residents of Chinatown: Desire Chinese-language, Chinese-American, and English-language periodicals
- Chinese and Chinese-American tourists from elsewhere: Desire Chinese and Chinese-American snacks, and sometimes periodicals. They pass through the subways on their way to see tourist destinations and are less likely to be reading magazines and newspapers while in New York.
- Other English speaking tourists from outside of New York City: Also will purchase snacks and drinks more commonly. They may want to sample Chinese products when in Chinatown rather than products they can purchase at a newsagent anywhere.
- New York City residents shopping in Chinatown: Potential to buy English-language periodicals and snacks/beverages when they arrive or leave Chinatown from shopping trips.
- New York City commuters passing through or changing trains in Chinatown: Potential to buy English-language periodicals and snacks/beverages when they pass through Chinatown subway stations. This group is larger, but with a lower likelihood of buying if they are merely changing trains.

| Market Analysis | |||||||
| Year 1 | Year 2 | Year 3 | Year 4 | Year 5 | |||
| Potential Customers | Growth | CAGR | |||||
| Non-English speaking Chinese-American residents | 5% | 50,000 | 52,500 | 55,125 | 57,881 | 60,775 | 5.00% |
| English speaking Chinese-American residents | 2% | 60,000 | 61,200 | 62,424 | 63,672 | 64,945 | 2.00% |
| Chinese tourists | 5% | 100,000 | 105,000 | 110,250 | 115,763 | 121,551 | 5.00% |
| English-speaking tourists | 3% | 200,000 | 206,000 | 212,180 | 218,545 | 225,101 | 3.00% |
| NYC residents/shoppers | 3% | 100,000 | 103,000 | 106,090 | 109,273 | 112,551 | 3.00% |
| NYC commuters | 2% | 250,000 | 255,000 | 260,100 | 265,302 | 270,608 | 2.00% |
| Total | 3.00% | 760,000 | 782,700 | 806,169 | 830,436 | 855,531 | 3.00% |
Target Market Segment Strategy
The market segmentation is based on the belief that the key drivers behind a customer’s purchases at a newsstand are related to what brought them to that newsstand. Tourists value the experience of “authentic” products (as well as familiar products at times). Commuters and shoppers value products they can use while on their subway ride (reading materials, snacks, drinks). Residents of Chinatown look for news and magazines on an almost daily basis for education and entertainment. Because the greatest sales will be generated if all of these groups are served to some extent, People’s News will provide English, Mandarin, and Cantonese language periodicals to serve a wide range of customers.
Industry Analysis
Answers.com provides some of the following key information on the newsstand and news dealer industry (SIC 5994 or NAICS 451212):
- 1997 Census showed 2,313 establishments with $853 million in sales and 9,770 people employed
- This averages to $369,000 annual revenue per location
- Outdoor news dealers may be seasonal and close in the winter due to lack of insulation, especially in the northern United States
- Most businesses are small single-proprietor establishments
- Larger chains and franchise operations are increasing
- Most businesses have five or fewer employees
- The industry has been declining over the past several decades due to a trend towards getting news online and on TV
The following passages reveal some of the specific dynamics of the industry and support the People’s News concept and business model:
- “Morning patrons generally limited their purchase to a single newspaper or periodical. Later lunch-hour and afternoon customers lingered over the magazine racks and often made impulse purchases. Many larger newsstands also acted as local bookstores, stocking popular paperbacks and sometimes even hardcover editions. A typical newsstand drew its sales primarily from the sales of daily newspapers, but in cities such as New York or Los Angeles, with many citizens transplanted from other areas of the country or globe, foreign newspapers and magazines were also big sellers. There, the International Herald Tribune, the Times of London, as well as European weeklies such as Paris Match and the German magazine Stern, sold well.”
- “In the late twentieth century, the industry shifted toward more standard business practices as a result of corporate ownership. For example, cash registers appeared at newsstands even though most customers on their way to a job or commuter train did not want to be held up for the few seconds longer these machines require.”
- “A news dealer or newsstand typically made a small profit from every item their establishment sold. A dealer would typically receive a maximum of 20 percent for each daily newspaper sold. Magazines had a higher profit margin because the intense competition between magazine titles and publishing houses resulted in courting the retailer. In addition to the 20 percent sellers received from the sale of each magazine, they would often obtain an additional 10 percent in the form of a retail display allowance. This premium came most often from larger magazine publishing corporations, such as Conde Nast or Time-Warner, as an incentive to keep their magazine titles prominently displayed near the transaction counter. Additional incentives could be paid to the news dealer for positioning a certain magazine overhead above the counter or for allowing poster displays of current issues. Such premiums could become a large part of revenue for major newsstands in New York City, where competition for display space was fierce. The monthly fees could sometimes reach into the thousands of dollars.”
Competition and Buying Patterns
Direct competition for newsagents kiosks comes from the following:
- Convenience stores
- Grocery stores
- Mass-market bookstores
- Magazine stores
- Street newspaper salespeople (without kiosks)
- Specialty stores
Indirect competition comes from:
- Subscriptions to magazines and newspapers
- Television news
- Internet news
- Radio
The primary advantage a subway-location newsstand can offer against these competitors is convenience, as the purchase can take place while waiting for a given subway or in a minute or less when arriving at a location. Other stores generally offer a wider range of products, but shopping and checkout time is increased significantly. This is not true for street newspaper salespeople. This type of competitor offers the lowest level of choice (often only one paper sold) and the fastest and often most convenient transaction. For those who value some choice and high convenience, subway newsstands are at the top of the list.
Indirect competition can erode readership for newspapers and magazines in general, but sales of food items at newsstands counters this element. By offering food and drinks, customers can be enticed to look at the reading material and may make impulse purchases for a few dollars or less to have something to read on their ride.
For those who buy on impulse and for convenience, brand names of the store are not important. The products are packaged and the periodicals are standard products which customers trust, regardless of the name of the store.
Strategy and Implementation Summary
People’s News seeks to serve those who travel through Chinatown, New York City subway stations either as residents, commuters, shoppers, or tourists. This large population includes both Chinese-speaking and English-speaking customers. To best target these customers, People’s News will:
- Offer products familiar to Chinese speakers as well as English speakers
- Hire only bilingual clerks
- Expand to three stores in order to share resources, increase negotiating power relative to suppliers, and build some brand name recognition within Chinatown
Competitive Edge
The People’s News competitive edge is based on its simultaneous focus on Chinese-speaking and English-speaking customers who all come together in New York City’s Chinatown neighborhood. Some Chinese newsagents in Chinatown only speak Mandarin or Cantonese and sell only products familiar to Chinese immigrants from their home country. Some American newsagents sell only the same American products available at newsstands throughout New York City. Offering a bit of both reaches a wider range of customers.
While this edge is not inimitable, it will be a temporary advantage as it is a relatively unique strategy currently. Having the only leased subway kiosk available at each of the other locations does prevent some imitation however, as those who use the same strategy will not have the same advantage of location.
Marketing Strategy
People’s News will use only basic low-cost marketing tactics, as it will primarily make sales through foot traffic:
- Employees and owners will inform friends and family of the business so that they can spread the work upon launch
- A sign with the name “People’s News” will be posted at each location, showing the name in English, Cantonese, and Mandarin, creating some brand recognition once the second and third stores are added
Pricing will be at newsstand market rates for all items. They cannot be offered at the same discounts available at larger establishments, but they will be offered at the same prices as other newsstands.
Sales Strategy
The sales strategy for People’s News is simple. It is based on three elements:
- Good choice of location
- Bilingual or trilingual salespeople (who speak at least English and Cantonese or Mandarin and perhaps all three)
- Swift and friendly service
Members of the Kao family are bilingual (English and Cantonese) and other family members or Chinese-American employees must meet this requirement in order to converse comfortably with Chinese or English-speaking customers.
By serving customers quickly, People’s News will show how much it values their time and acknowledge that those arriving at or leaving a subway platform are in a hurry and not interested in anything more than convenience. However, by smiling and remaining friendly even to brusque or unfriendly customers, People’s News hopes that it will stay at the top of a customer’s list as a place to buy the next time they come through the subway station.
Sales Forecast
The basic categories of sales consist of the following:
Monthly magazines: Average price of $3 and 70% cost of sales. These items have a lower cost of sales than other periodicals, as some publisher allowances are given for prominent placement of their magazines in the racks and designated spots close to registers.
Weekly magazines and newspapers: Average price of $2 and 75% cost of sales. These items have some of the same publisher allowances mentioned for monthly magazines.
Daily newspapers: Average price of $1 and 80% cost of sales. These items are the best sellers but have a low price and high cost of sales. They are a draw to the kiosks however, and this increases sales of the food and drink items.
Beverages, Snacks and Candy: 60% cost of sales. These items will sell both on their own and to those who purchase the periodicals.
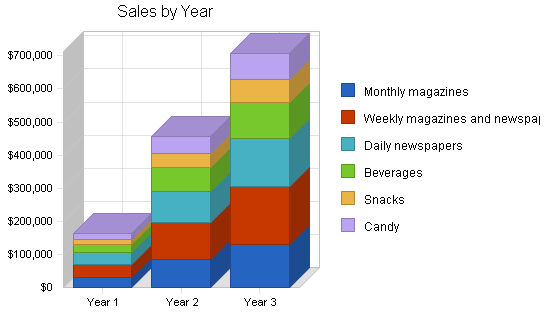
The business will begin with one location in the first year and will roughly double sales in the second year with the establishment of second location. Revenue will grow in the third year as well with the addition of a third location and continued growth in the first two. The establishment of these additional locations will increase the volume of purchases from suppliers and lower the cost of sales of the products sold slightly in the third year.

| Sales Forecast | |||
| Year 1 | Year 2 | Year 3 | |
| Unit Sales | |||
| Monthly magazines | 10,122 | 28,156 | 43,641 |
| Weekly magazines and newspapers | 20,244 | 56,311 | 87,282 |
| Daily newspapers | 33,740 | 93,852 | 145,470 |
| Beverages | 20,244 | 56,311 | 87,282 |
| Snacks | 16,026 | 44,580 | 69,098 |
| Candy | 23,618 | 65,696 | 101,829 |
| Total Unit Sales | 123,994 | 344,906 | 534,604 |
| Unit Prices | Year 1 | Year 2 | Year 3 |
| Monthly magazines | $3.00 | $3.00 | $3.00 |
| Weekly magazines and newspapers | $2.00 | $2.00 | $2.00 |
| Daily newspapers | $1.00 | $1.00 | $1.00 |
| Beverages | $1.25 | $1.25 | $1.25 |
| Snacks | $1.00 | $1.00 | $1.00 |
| Candy | $0.75 | $0.75 | $0.75 |
| Sales | |||
| Monthly magazines | $30,366 | $84,467 | $130,923 |
| Weekly magazines and newspapers | $40,488 | $112,622 | $174,564 |
| Daily newspapers | $33,740 | $93,852 | $145,470 |
| Beverages | $25,305 | $70,389 | $109,103 |
| Snacks | $16,026 | $44,580 | $69,098 |
| Candy | $17,713 | $49,272 | $76,372 |
| Total Sales | $163,638 | $455,182 | $705,532 |
| Direct Unit Costs | Year 1 | Year 2 | Year 3 |
| Monthly magazines | $2.10 | $2.00 | $2.00 |
| Weekly magazines and newspapers | $1.50 | $1.40 | $1.40 |
| Daily newspapers | $0.80 | $0.70 | $0.70 |
| Beverages | $0.75 | $0.65 | $0.65 |
| Snacks | $0.60 | $0.50 | $0.50 |
| Candy | $0.45 | $0.35 | $0.35 |
| Direct Cost of Sales | |||
| Monthly magazines | $21,256 | $56,311 | $87,282 |
| Weekly magazines and newspapers | $30,366 | $78,836 | $122,195 |
| Daily newspapers | $26,992 | $65,696 | $101,829 |
| Beverages | $15,183 | $36,602 | $56,733 |
| Snacks | $9,616 | $22,290 | $34,549 |
| Candy | $10,628 | $22,994 | $35,640 |
| Subtotal Direct Cost of Sales | $114,041 | $282,729 | $438,230 |
Milestones
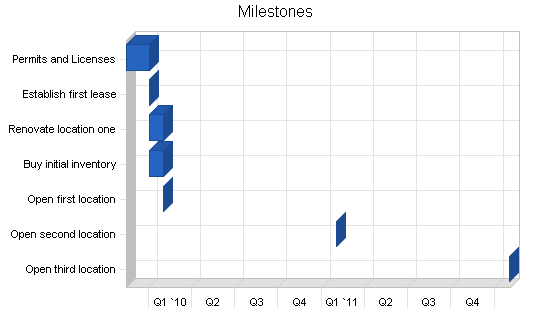
Hui Kao will manage the lease, license, and permit process. He will delegate the renovation of the store and purchasing of initial inventory to his son, Zhi Kao. Additional stores will be launched after one and two years pass. These costs are all represented within startup costs and the three-year cash flow statement.
| Milestones | |||||
| Milestone | Start Date | End Date | Budget | Manager | Department |
| Permits and Licenses | 11/15/2009 | 1/1/2010 | $1,000 | Hui Kao | Hui Kao |
| Establish first lease | 1/1/2010 | 1/1/2010 | $1,000 | Hui Kao | Hui Kao |
| Renovate location one | 1/1/2010 | 1/31/2010 | $500 | Hui Kao | Zhi Kao |
| Buy initial inventory | 1/1/2010 | 1/31/2010 | $1,000 | Hui Kao | Zhi Kao |
| Open first location | 2/1/2010 | 2/1/2010 | $1,400 | Hui Kao | Hui Kao |
| Open second location | 2/1/2011 | 2/1/2011 | $2,400 | Hui Kao | Hui Kao |
| Open third location | 2/1/2012 | 2/1/2012 | $2,400 | Hui Kao | Hui Kao |
| Totals | $9,700 | ||||
Management Summary
Hui Kao will be CEO and Administrative Manager of the company. He will split sales clerk work at the first store with his son, Zhi Kao. Zhi Kao will be an administrative assistant, executing purchases of inventory, renovating and maintaining the location. Hui Kao will focus 50% of his time on administration and supervision in the second year and 75% on those management activities in the third year, reducing his work in the stores to 50% and then 25% of his time.
Hui Kao will handle accounts payable (payroll, suppliers, insurance, rent, utilities, etc.) and bookkeeping. Bank deposits will be made by Hui Kao or Zhi Kao. Deliveries will be distributed between the locations by Zhi Kao after they arrive at the first store.
Zhi Kao will be mentored as a manager-in-training throughout these first three years of operation and will be able to manage all business operations in the absence of Hui Kao by the second year. It is expected that within five more years, Zhi Kao will become CEO of the business when Hui retires.
Hui Kao owned and operated a small grocery store in China for fifteen years and sold periodicals as part of the business. His son, Zhi Kao, worked in the store for five years as a teenager and developed experience in sales and some management tasks.
Personnel Plan
The personnel will begin with one full-time equivalent employee. This will consist of Hui Kao and Zhi Kao both working part-time at the first store location. Administrative work will be performed by both Hui and Zhi Kao during this startup phase. In the second year and third years, additional employees will be added to staff the stores, usually consisting of two part-time workers for each store. Once the three stores are established, Hui Kao will spend part of his time moving between the three stores and providing centralized services. He will receive salary for this role in the third year.
Health insurance cannot be provided by the business upon launch. In the second year it can be provided for employees who work full-time and the cost of insurance is built into the personnel costs listed here. It is expected that three full-time employees will receive health insurance.
| Personnel Plan | |||
| Year 1 | Year 2 | Year 3 | |
| Store 1 Employees | $36,000 | $41,400 | $42,642 |
| Store 2 Employees | $0 | $41,400 | $42,642 |
| Store 3 Employees | $0 | $0 | $42,642 |
| Administrative Manager | $0 | $0 | $10,000 |
| Total People | 1 | 3 | 4 |
| Total Payroll | $36,000 | $82,800 | $137,926 |
Financial Plan
The business is financed primarily through internal resources: personal credit card debt, personal savings, and family loans. Expansion to additional locations will be less costly than the establishment of the business and the first location. This will allow the business to grow based on its own cash flows from operations after the first year.
Start-up Funding
Funding for People’s News is primarily expected to come from the Kao family. Hui Kao, the primary owner, will use his savings and credit cards. Zhi Kao, his eldest son will contribute a lesser amount from his savings. An additional amount will be loaned to the business, interest-free for two years, from one to three relatives of Hui Kao (family who immigrated to the country earlier and are nearing retirement age). Some initial bills will be accounts payable paid within 30 days.
| Start-up Funding | |
| Start-up Expenses to Fund | $3,700 |
| Start-up Assets to Fund | $12,900 |
| Total Funding Required | $16,600 |
| Assets | |
| Non-cash Assets from Start-up | $2,900 |
| Cash Requirements from Start-up | $10,000 |
| Additional Cash Raised | $0 |
| Cash Balance on Starting Date | $10,000 |
| Total Assets | $12,900 |
| Liabilities and Capital | |
| Liabilities | |
| Current Borrowing | $4,000 |
| Long-term Liabilities | $0 |
| Accounts Payable (Outstanding Bills) | $1,000 |
| Other Current Liabilities (interest-free) | $5,000 |
| Total Liabilities | $10,000 |
| Capital | |
| Planned Investment | |
| Hui Kao | $5,000 |
| Zhi Kao | $1,600 |
| Additional Investment Requirement | $0 |
| Total Planned Investment | $6,600 |
| Loss at Start-up (Start-up Expenses) | ($3,700) |
| Total Capital | $2,900 |
| Total Capital and Liabilities | $12,900 |
| Total Funding | $16,600 |
Important Assumptions
This table illustrates the basic general assumptions behind the business, including the scheduled growth in locations.
| General Assumptions | |||
| Year 1 | Year 2 | Year 3 | |
| Plan Month | 1 | 2 | 3 |
| Current Interest Rate | 15.00% | 15.00% | 15.00% |
| Long-term Interest Rate | 10.00% | 10.00% | 10.00% |
| Tax Rate | 0.00% | 30.00% | 30.00% |
| Number of Locations | 1 | 2 | 3 |
Break-even Analysis
The estimated break-even point per month in the first year is shown in the following table. This is due to a high variable cost from this relatively low margin business.

| Break-even Analysis | |
| Monthly Units Break-even | 10,683 |
| Monthly Revenue Break-even | $14,099 |
| Assumptions: | |
| Average Per-Unit Revenue | $1.32 |
| Average Per-Unit Variable Cost | $0.92 |
| Estimated Monthly Fixed Cost | $4,273 |
Projected Profit and Loss
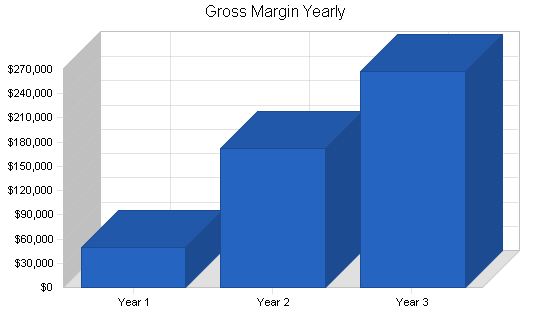
Gross margins will grow in the second year as better prices can be negotiated from suppliers due to the higher volume of sales from two stores.
Some expenses will double with the addition of a new store (payroll as the store must be covered with at least one clerk at all times, depreciation as the depreciable assets purchased for the second store will be the same as the first, rent as the store is expected to be an additional $500 per month, and utilities as each store will require electricity). However, insurance will not double, but is expected to increase by 50%. Renewals of permits and licenses will be made in the second year for the first store and in the third year for the first two stores. New store start-up expenses are one-time expenses applicable to each new store, and are lower than the start-up expenses for the first store and business. These include one month rent at $500, $500 in renovations, and $1,000 in additional permits.
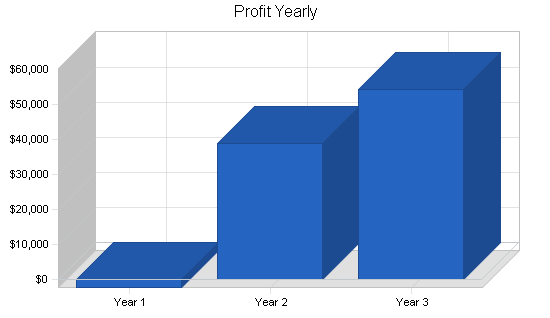
After a small net loss in the first year, the business will become profitable in the second. Net profit will rise in the third, but the addition of salary for the owner’s work as Administrative Manager will reduce the percentage of net profit/sales. This reflects an expense that the owner could use to hire a part-time Administrative Manager if desired.


| Pro Forma Profit and Loss | |||
| Year 1 | Year 2 | Year 3 | |
| Sales | $163,638 | $455,182 | $705,532 |
| Direct Cost of Sales | $114,041 | $282,729 | $438,230 |
| Other Costs of Sales | $0 | $0 | $0 |
| Total Cost of Sales | $114,041 | $282,729 | $438,230 |
| Gross Margin | $49,598 | $172,453 | $267,302 |
| Gross Margin % | 30.31% | 37.89% | 37.89% |
| Expenses | |||
| Payroll | $36,000 | $82,800 | $137,926 |
| Marketing/Promotion | $0 | $0 | $0 |
| Depreciation | $280 | $560 | $840 |
| Rent | $6,000 | $12,000 | $18,000 |
| Utilities | $1,200 | $2,400 | $3,600 |
| Renewal Permits and Licenses | $0 | $1,000 | $2,000 |
| Insurance | $2,400 | $3,600 | $4,500 |
| Payroll Taxes | $5,400 | $12,420 | $20,689 |
| New Store Startup Expenses | $0 | $2,000 | $2,000 |
| Total Operating Expenses | $51,280 | $116,780 | $189,555 |
| Profit Before Interest and Taxes | ($1,682) | $55,673 | $77,747 |
| EBITDA | ($1,402) | $56,233 | $78,587 |
| Interest Expense | $563 | $195 | $15 |
| Taxes Incurred | $0 | $16,643 | $23,320 |
| Net Profit | ($2,245) | $38,835 | $54,412 |
| Net Profit/Sales | -1.37% | 8.53% | 7.71% |
Projected Cash Flow
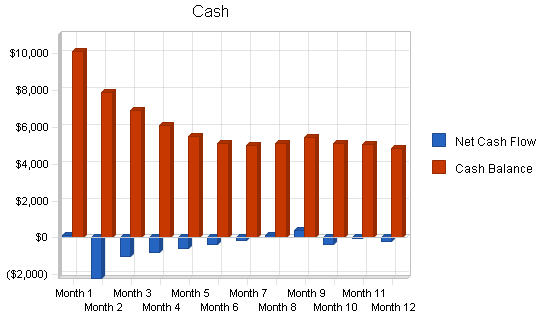
The business will not achieve consistent positive cash flow until the opening of a second store in year two. The experience of the first kiosk will allow for the second to launch with higher sales and many expenses will be shared between the two locations.
Dividends will be taken out in years two and three to further compensate the owners, leaving a cash balance in the company.
With the expansion to a second and third kiosk location, the business will need to pay for additional security deposits ($500 per lease) and other long-term assets for the new business ($1,400 per location).
The credit card borrowing and interest-free borrowing from relatives will be paid off within the first two years.
| Pro Forma Cash Flow | |||
| Year 1 | Year 2 | Year 3 | |
| Cash Received | |||
| Cash from Operations | |||
| Cash Sales | $163,638 | $455,182 | $705,532 |
| Subtotal Cash from Operations | $163,638 | $455,182 | $705,532 |
| Additional Cash Received | |||
| Sales Tax, VAT, HST/GST Received | $14,523 | $40,397 | $62,616 |
| New Current Borrowing | $0 | $0 | $0 |
| New Other Liabilities (interest-free) | $0 | $0 | $0 |
| New Long-term Liabilities | $0 | $0 | $0 |
| Sales of Other Current Assets | $0 | $0 | $0 |
| Sales of Long-term Assets | $0 | $0 | $0 |
| New Investment Received | $0 | $0 | $0 |
| Subtotal Cash Received | $178,161 | $495,579 | $768,147 |
| Expenditures | Year 1 | Year 2 | Year 3 |
| Expenditures from Operations | |||
| Cash Spending | $36,000 | $82,800 | $137,926 |
| Bill Payments | $129,264 | $347,912 | $505,052 |
| Subtotal Spent on Operations | $165,264 | $430,712 | $642,978 |
| Additional Cash Spent | |||
| Sales Tax, VAT, HST/GST Paid Out | $14,523 | $40,397 | $62,616 |
| Principal Repayment of Current Borrowing | $1,500 | $2,400 | $0 |
| Other Liabilities Principal Repayment | $2,000 | $3,000 | $0 |
| Long-term Liabilities Principal Repayment | $0 | $0 | $0 |
| Purchase Other Current Assets | $0 | $500 | $500 |
| Purchase Long-term Assets | $0 | $1,400 | $1,400 |
| Dividends | $0 | $7,000 | $60,000 |
| Subtotal Cash Spent | $183,287 | $485,409 | $767,494 |
| Net Cash Flow | ($5,125) | $10,170 | $653 |
| Cash Balance | $4,875 | $15,045 | $15,698 |
Projected Balance Sheet
Inventory and cash are the primary assets of the business, as there are no accounts receivable from customers. The small locations require a low level of long-term assets in the business as well.
People’s News is launched with the purpose of providing income for the Kao family. For that reason, the goal is not to build the net worth of the business significantly. Dividends are taken out, lowering the cash balance and retained earnings in the business. If the business shuts down, it will cut down on purchases of new inventory to let its current inventory run down, or sell the kiosks with their inventory to a new business owner leased to by the landlord.
| Pro Forma Balance Sheet | |||
| Year 1 | Year 2 | Year 3 | |
| Assets | |||
| Current Assets | |||
| Cash | $4,875 | $15,045 | $15,698 |
| Inventory | $6,416 | $29,206 | $28,302 |
| Other Current Assets | $500 | $1,000 | $1,500 |
| Total Current Assets | $11,791 | $45,251 | $45,500 |
| Long-term Assets | |||
| Long-term Assets | $1,400 | $2,800 | $4,200 |
| Accumulated Depreciation | $280 | $840 | $1,680 |
| Total Long-term Assets | $1,120 | $1,960 | $2,520 |
| Total Assets | $12,911 | $47,211 | $48,021 |
| Liabilities and Capital | Year 1 | Year 2 | Year 3 |
| Current Liabilities | |||
| Accounts Payable | $6,756 | $14,621 | $21,018 |
| Current Borrowing | $2,500 | $100 | $100 |
| Other Current Liabilities | $3,000 | $0 | $0 |
| Subtotal Current Liabilities | $12,256 | $14,721 | $21,118 |
| Long-term Liabilities | $0 | $0 | $0 |
| Total Liabilities | $12,256 | $14,721 | $21,118 |
| Paid-in Capital | $6,600 | $6,600 | $6,600 |
| Retained Earnings | ($3,700) | ($12,945) | ($34,110) |
| Earnings | ($2,245) | $38,835 | $54,412 |
| Total Capital | $655 | $32,490 | $26,902 |
| Total Liabilities and Capital | $12,911 | $47,211 | $48,021 |
| Net Worth | $655 | $32,490 | $26,902 |
Business Ratios
The business will compare well to its industry category (News Dealers and Newsstands; SIC code 5994 NAICS code 451212, with revenue of $500,000 to $999,999). Accounts receivable are almost non-existent in the business as this is generally a cash-only business. Inventory is a large portion of current assets. Long-term assets is a smaller portion than the industry average as subway kiosks are less capital-intensive than free-standing locations. Gross margins are slightly higher than the industry average as it includes some larger chains which can command lower prices from suppliers.
| Ratio Analysis | ||||
| Year 1 | Year 2 | Year 3 | Industry Profile | |
| Sales Growth | n.a. | 178.16% | 55.00% | 0.44% |
| Percent of Total Assets | ||||
| Inventory | 49.70% | 61.86% | 58.94% | 58.22% |
| Other Current Assets | 3.87% | 2.12% | 3.12% | 23.28% |
| Total Current Assets | 91.32% | 95.85% | 94.75% | 84.38% |
| Long-term Assets | 8.68% | 4.15% | 5.25% | 15.62% |
| Total Assets | 100.00% | 100.00% | 100.00% | 100.00% |
| Current Liabilities | 94.93% | 31.18% | 43.98% | 43.34% |
| Long-term Liabilities | 0.00% | 0.00% | 0.00% | 51.42% |
| Total Liabilities | 94.93% | 31.18% | 43.98% | 94.76% |
| Net Worth | 5.07% | 68.82% | 56.02% | 5.24% |
| Percent of Sales | ||||
| Sales | 100.00% | 100.00% | 100.00% | 100.00% |
| Gross Margin | 30.31% | 37.89% | 37.89% | 42.07% |
| Selling, General & Administrative Expenses | 31.68% | 29.35% | 30.17% | 16.64% |
| Advertising Expenses | 0.00% | 0.00% | 0.00% | 1.85% |
| Profit Before Interest and Taxes | -1.03% | 12.23% | 11.02% | 2.21% |
| Main Ratios | ||||
| Current | 0.96 | 3.07 | 2.15 | 1.80 |
| Quick | 0.44 | 1.09 | 0.81 | 0.45 |
| Total Debt to Total Assets | 94.93% | 31.18% | 43.98% | 94.76% |
| Pre-tax Return on Net Worth | -342.64% | 170.76% | 288.94% | 113.35% |
| Pre-tax Return on Assets | -17.39% | 117.51% | 161.87% | 5.94% |
| Additional Ratios | Year 1 | Year 2 | Year 3 | |
| Net Profit Margin | -1.37% | 8.53% | 7.71% | n.a |
| Return on Equity | -342.64% | 119.53% | 202.26% | n.a |
| Activity Ratios | ||||
| Inventory Turnover | 24.00 | 15.87 | 15.24 | n.a |
| Accounts Payable Turnover | 19.99 | 24.33 | 24.33 | n.a |
| Payment Days | 13 | 11 | 13 | n.a |
| Total Asset Turnover | 12.67 | 9.64 | 14.69 | n.a |
| Debt Ratios | ||||
| Debt to Net Worth | 18.71 | 0.45 | 0.79 | n.a |
| Current Liab. to Liab. | 1.00 | 1.00 | 1.00 | n.a |
| Liquidity Ratios | ||||
| Net Working Capital | ($465) | $30,530 | $24,382 | n.a |
| Interest Coverage | -2.99 | 285.50 | 5,183.14 | n.a |
| Additional Ratios | ||||
| Assets to Sales | 0.08 | 0.10 | 0.07 | n.a |
| Current Debt/Total Assets | 95% | 31% | 44% | n.a |
| Acid Test | 0.44 | 1.09 | 0.81 | n.a |
| Sales/Net Worth | 249.77 | 14.01 | 26.23 | n.a |
| Dividend Payout | 0.00 | 0.18 | 1.10 | n.a |
Appendix
| Sales Forecast | |||||||||||||
| Month 1 | Month 2 | Month 3 | Month 4 | Month 5 | Month 6 | Month 7 | Month 8 | Month 9 | Month 10 | Month 11 | Month 12 | ||
| Unit Sales | |||||||||||||
| Monthly magazines | 600 | 636 | 674 | 715 | 757 | 803 | 851 | 902 | 956 | 1,014 | 1,075 | 1,139 | |
| Weekly magazines and newspapers | 1,200 | 1,272 | 1,348 | 1,429 | 1,515 | 1,606 | 1,702 | 1,804 | 1,913 | 2,027 | 2,149 | 2,278 | |
| Daily newspapers | 2,000 | 2,120 | 2,247 | 2,382 | 2,525 | 2,676 | 2,837 | 3,007 | 3,188 | 3,379 | 3,582 | 3,797 | |
| Beverages | 1,200 | 1,272 | 1,348 | 1,429 | 1,515 | 1,606 | 1,702 | 1,804 | 1,913 | 2,027 | 2,149 | 2,278 | |
| Snacks | 950 | 1,007 | 1,067 | 1,131 | 1,199 | 1,271 | 1,348 | 1,428 | 1,514 | 1,605 | 1,701 | 1,803 | |
| Candy | 1,400 | 1,484 | 1,573 | 1,667 | 1,767 | 1,874 | 1,986 | 2,105 | 2,231 | 2,365 | 2,507 | 2,658 | |
| Total Unit Sales | 7,350 | 7,791 | 8,258 | 8,754 | 9,279 | 9,836 | 10,426 | 11,052 | 11,715 | 12,418 | 13,163 | 13,952 | |
| Unit Prices | Month 1 | Month 2 | Month 3 | Month 4 | Month 5 | Month 6 | Month 7 | Month 8 | Month 9 | Month 10 | Month 11 | Month 12 | |
| Monthly magazines | $3.00 | $3.00 | $3.00 | $3.00 | $3.00 | $3.00 | $3.00 | $3.00 | $3.00 | $3.00 | $3.00 | $3.00 | |
| Weekly magazines and newspapers | $2.00 | $2.00 | $2.00 | $2.00 | $2.00 | $2.00 | $2.00 | $2.00 | $2.00 | $2.00 | $2.00 | $2.00 | |
| Daily newspapers | $1.00 | $1.00 | $1.00 | $1.00 | $1.00 | $1.00 | $1.00 | $1.00 | $1.00 | $1.00 | $1.00 | $1.00 | |
| Beverages | $1.25 | $1.25 | $1.25 | $1.25 | $1.25 | $1.25 | $1.25 | $1.25 | $1.25 | $1.25 | $1.25 | $1.25 | |
| Snacks | $1.00 | $1.00 | $1.00 | $1.00 | $1.00 | $1.00 | $1.00 | $1.00 | $1.00 | $1.00 | $1.00 | $1.00 | |
| Candy | $0.75 | $0.75 | $0.75 | $0.75 | $0.75 | $0.75 | $0.75 | $0.75 | $0.75 | $0.75 | $0.75 | $0.75 | |
| Sales | |||||||||||||
| Monthly magazines | $1,800 | $1,908 | $2,022 | $2,144 | $2,272 | $2,409 | $2,553 | $2,707 | $2,869 | $3,041 | $3,224 | $3,417 | |
| Weekly magazines and newspapers | $2,400 | $2,544 | $2,697 | $2,858 | $3,030 | $3,212 | $3,404 | $3,609 | $3,825 | $4,055 | $4,298 | $4,556 | |
| Daily newspapers | $2,000 | $2,120 | $2,247 | $2,382 | $2,525 | $2,676 | $2,837 | $3,007 | $3,188 | $3,379 | $3,582 | $3,797 | |
| Beverages | $1,500 | $1,590 | $1,685 | $1,787 | $1,894 | $2,007 | $2,128 | $2,255 | $2,391 | $2,534 | $2,686 | $2,847 | |
| Snacks | $950 | $1,007 | $1,067 | $1,131 | $1,199 | $1,271 | $1,348 | $1,428 | $1,514 | $1,605 | $1,701 | $1,803 | |
| Candy | $1,050 | $1,113 | $1,180 | $1,251 | $1,326 | $1,405 | $1,489 | $1,579 | $1,674 | $1,774 | $1,880 | $1,993 | |
| Total Sales | $9,700 | $10,282 | $10,899 | $11,553 | $12,246 | $12,981 | $13,760 | $14,585 | $15,460 | $16,388 | $17,371 | $18,413 | |
| Direct Unit Costs | Month 1 | Month 2 | Month 3 | Month 4 | Month 5 | Month 6 | Month 7 | Month 8 | Month 9 | Month 10 | Month 11 | Month 12 | |
| Monthly magazines | 70.00% | $2.10 | $2.10 | $2.10 | $2.10 | $2.10 | $2.10 | $2.10 | $2.10 | $2.10 | $2.10 | $2.10 | $2.10 |
| Weekly magazines and newspapers | 75.00% | $1.50 | $1.50 | $1.50 | $1.50 | $1.50 | $1.50 | $1.50 | $1.50 | $1.50 | $1.50 | $1.50 | $1.50 |
| Daily newspapers | 80.00% | $0.80 | $0.80 | $0.80 | $0.80 | $0.80 | $0.80 | $0.80 | $0.80 | $0.80 | $0.80 | $0.80 | $0.80 |
| Beverages | 60.00% | $0.75 | $0.75 | $0.75 | $0.75 | $0.75 | $0.75 | $0.75 | $0.75 | $0.75 | $0.75 | $0.75 | $0.75 |
| Snacks | 60.00% | $0.60 | $0.60 | $0.60 | $0.60 | $0.60 | $0.60 | $0.60 | $0.60 | $0.60 | $0.60 | $0.60 | $0.60 |
| Candy | 60.00% | $0.45 | $0.45 | $0.45 | $0.45 | $0.45 | $0.45 | $0.45 | $0.45 | $0.45 | $0.45 | $0.45 | $0.45 |
| Direct Cost of Sales | |||||||||||||
| Monthly magazines | $1,260 | $1,336 | $1,416 | $1,501 | $1,591 | $1,686 | $1,787 | $1,895 | $2,008 | $2,129 | $2,256 | $2,392 | |
| Weekly magazines and newspapers | $1,800 | $1,908 | $2,022 | $2,144 | $2,272 | $2,409 | $2,553 | $2,707 | $2,869 | $3,041 | $3,224 | $3,417 | |
| Daily newspapers | $1,600 | $1,696 | $1,798 | $1,906 | $2,020 | $2,141 | $2,270 | $2,406 | $2,550 | $2,703 | $2,865 | $3,037 | |
| Beverages | $900 | $954 | $1,011 | $1,072 | $1,136 | $1,204 | $1,277 | $1,353 | $1,434 | $1,521 | $1,612 | $1,708 | |
| Snacks | $570 | $604 | $640 | $679 | $720 | $763 | $809 | $857 | $908 | $963 | $1,021 | $1,082 | |
| Candy | $630 | $668 | $708 | $750 | $795 | $843 | $894 | $947 | $1,004 | $1,064 | $1,128 | $1,196 | |
| Subtotal Direct Cost of Sales | $6,760 | $7,166 | $7,596 | $8,051 | $8,534 | $9,046 | $9,589 | $10,165 | $10,774 | $11,421 | $12,106 | $12,832 | |
| Personnel Plan | |||||||||||||
| Month 1 | Month 2 | Month 3 | Month 4 | Month 5 | Month 6 | Month 7 | Month 8 | Month 9 | Month 10 | Month 11 | Month 12 | ||
| Store 1 Employees | $3,000 | $3,000 | $3,000 | $3,000 | $3,000 | $3,000 | $3,000 | $3,000 | $3,000 | $3,000 | $3,000 | $3,000 | |
| Store 2 Employees | $0 | $0 | $0 | $0 | $0 | $0 | $0 | $0 | $0 | $0 | $0 | $0 | |
| Store 3 Employees | $0 | $0 | $0 | $0 | $0 | $0 | $0 | $0 | $0 | $0 | $0 | $0 | |
| Administrative Manager | $0 | $0 | $0 | $0 | $0 | $0 | $0 | $0 | $0 | $0 | $0 | $0 | |
| Total People | 1 | 1 | 1 | 1 | 1 | 1 | 1 | 1 | 1 | 1 | 1 | 1 | |
| Total Payroll | $3,000 | $3,000 | $3,000 | $3,000 | $3,000 | $3,000 | $3,000 | $3,000 | $3,000 | $3,000 | $3,000 | $3,000 | |
| Pro Forma Profit and Loss | |||||||||||||
| Month 1 | Month 2 | Month 3 | Month 4 | Month 5 | Month 6 | Month 7 | Month 8 | Month 9 | Month 10 | Month 11 | Month 12 | ||
| Sales | $9,700 | $10,282 | $10,899 | $11,553 | $12,246 | $12,981 | $13,760 | $14,585 | $15,460 | $16,388 | $17,371 | $18,413 | |
| Direct Cost of Sales | $6,760 | $7,166 | $7,596 | $8,051 | $8,534 | $9,046 | $9,589 | $10,165 | $10,774 | $11,421 | $12,106 | $12,832 | |
| Other Costs of Sales | $0 | $0 | $0 | $0 | $0 | $0 | $0 | $0 | $0 | $0 | $0 | $0 | |
| Total Cost of Sales | $6,760 | $7,166 | $7,596 | $8,051 | $8,534 | $9,046 | $9,589 | $10,165 | $10,774 | $11,421 | $12,106 | $12,832 | |
| Gross Margin | $2,940 | $3,116 | $3,303 | $3,502 | $3,712 | $3,934 | $4,170 | $4,421 | $4,686 | $4,967 | $5,265 | $5,581 | |
| Gross Margin % | 30.31% | 30.31% | 30.31% | 30.31% | 30.31% | 30.31% | 30.31% | 30.31% | 30.31% | 30.31% | 30.31% | 30.31% | |
| Expenses | |||||||||||||
| Payroll | $3,000 | $3,000 | $3,000 | $3,000 | $3,000 | $3,000 | $3,000 | $3,000 | $3,000 | $3,000 | $3,000 | $3,000 | |
| Marketing/Promotion | $0 | $0 | $0 | $0 | $0 | $0 | $0 | $0 | $0 | $0 | $0 | $0 | |
| Depreciation | $23 | $23 | $23 | $23 | $23 | $23 | $23 | $23 | $23 | $23 | $23 | $23 | |
| Rent | $500 | $500 | $500 | $500 | $500 | $500 | $500 | $500 | $500 | $500 | $500 | $500 | |
| Utilities | $100 | $100 | $100 | $100 | $100 | $100 | $100 | $100 | $100 | $100 | $100 | $100 | |
| Renewal Permits and Licenses | $0 | $0 | $0 | $0 | $0 | $0 | $0 | $0 | $0 | $0 | $0 | $0 | |
| Insurance | $200 | $200 | $200 | $200 | $200 | $200 | $200 | $200 | $200 | $200 | $200 | $200 | |
| Payroll Taxes | 15% | $450 | $450 | $450 | $450 | $450 | $450 | $450 | $450 | $450 | $450 | $450 | $450 |
| New Store Startup Expenses | $0 | $0 | $0 | $0 | $0 | $0 | $0 | $0 | $0 | $0 | $0 | $0 | |
| Total Operating Expenses | $4,273 | $4,273 | $4,273 | $4,273 | $4,273 | $4,273 | $4,273 | $4,273 | $4,273 | $4,273 | $4,273 | $4,273 | |
| Profit Before Interest and Taxes | ($1,333) | ($1,157) | ($970) | ($772) | ($562) | ($339) | ($103) | $147 | $413 | $694 | $992 | $1,308 | |
| EBITDA | ($1,310) | ($1,134) | ($947) | ($748) | ($538) | ($316) | ($80) | $171 | $436 | $717 | $1,015 | $1,331 | |
| Interest Expense | $50 | $50 | $50 | $50 | $50 | $50 | $50 | $50 | $50 | $44 | $38 | $31 | |
| Taxes Incurred | $0 | $0 | $0 | $0 | $0 | $0 | $0 | $0 | $0 | $0 | $0 | $0 | |
| Net Profit | ($1,383) | ($1,207) | ($1,020) | ($822) | ($612) | ($389) | ($153) | $97 | $363 | $650 | $954 | $1,276 | |
| Net Profit/Sales | -14.26% | -11.74% | -9.36% | -7.11% | -4.99% | -3.00% | -1.11% | 0.67% | 2.35% | 3.97% | 5.49% | 6.93% | |
| Pro Forma Cash Flow | |||||||||||||
| Month 1 | Month 2 | Month 3 | Month 4 | Month 5 | Month 6 | Month 7 | Month 8 | Month 9 | Month 10 | Month 11 | Month 12 | ||
| Cash Received | |||||||||||||
| Cash from Operations | |||||||||||||
| Cash Sales | $9,700 | $10,282 | $10,899 | $11,553 | $12,246 | $12,981 | $13,760 | $14,585 | $15,460 | $16,388 | $17,371 | $18,413 | |
| Subtotal Cash from Operations | $9,700 | $10,282 | $10,899 | $11,553 | $12,246 | $12,981 | $13,760 | $14,585 | $15,460 | $16,388 | $17,371 | $18,413 | |
| Additional Cash Received | |||||||||||||
| Sales Tax, VAT, HST/GST Received | 8.88% | $861 | $913 | $967 | $1,025 | $1,087 | $1,152 | $1,221 | $1,294 | $1,372 | $1,454 | $1,542 | $1,634 |
| New Current Borrowing | $0 | $0 | $0 | $0 | $0 | $0 | $0 | $0 | $0 | $0 | $0 | $0 | |
| New Other Liabilities (interest-free) | $0 | $0 | $0 | $0 | $0 | $0 | $0 | $0 | $0 | $0 | $0 | $0 | |
| New Long-term Liabilities | $0 | $0 | $0 | $0 | $0 | $0 | $0 | $0 | $0 | $0 | $0 | $0 | |
| Sales of Other Current Assets | $0 | $0 | $0 | $0 | $0 | $0 | $0 | $0 | $0 | $0 | $0 | $0 | |
| Sales of Long-term Assets | $0 | $0 | $0 | $0 | $0 | $0 | $0 | $0 | $0 | $0 | $0 | $0 | |
| New Investment Received | $0 | $0 | $0 | $0 | $0 | $0 | $0 | $0 | $0 | $0 | $0 | $0 | |
| Subtotal Cash Received | $10,561 | $11,195 | $11,866 | $12,578 | $13,333 | $14,133 | $14,981 | $15,880 | $16,832 | $17,842 | $18,913 | $20,048 | |
| Expenditures | Month 1 | Month 2 | Month 3 | Month 4 | Month 5 | Month 6 | Month 7 | Month 8 | Month 9 | Month 10 | Month 11 | Month 12 | |
| Expenditures from Operations | |||||||||||||
| Cash Spending | $3,000 | $3,000 | $3,000 | $3,000 | $3,000 | $3,000 | $3,000 | $3,000 | $3,000 | $3,000 | $3,000 | $3,000 | |
| Bill Payments | $6,568 | $9,495 | $8,904 | $9,360 | $9,844 | $10,357 | $10,900 | $11,476 | $12,087 | $12,731 | $13,410 | $14,131 | |
| Subtotal Spent on Operations | $9,568 | $12,495 | $11,904 | $12,360 | $12,844 | $13,357 | $13,900 | $14,476 | $15,087 | $15,731 | $16,410 | $17,131 | |
| Additional Cash Spent | |||||||||||||
| Sales Tax, VAT, HST/GST Paid Out | $861 | $913 | $967 | $1,025 | $1,087 | $1,152 | $1,221 | $1,294 | $1,372 | $1,454 | $1,542 | $1,634 | |
| Principal Repayment of Current Borrowing | $0 | $0 | $0 | $0 | $0 | $0 | $0 | $0 | $0 | $500 | $500 | $500 | |
| Other Liabilities Principal Repayment | $0 | $0 | $0 | $0 | $0 | $0 | $0 | $0 | $0 | $500 | $500 | $1,000 | |
| Long-term Liabilities Principal Repayment | $0 | $0 | $0 | $0 | $0 | $0 | $0 | $0 | $0 | $0 | $0 | $0 | |
| Purchase Other Current Assets | $0 | $0 | $0 | $0 | $0 | $0 | $0 | $0 | $0 | $0 | $0 | $0 | |
| Purchase Long-term Assets | $0 | $0 | $0 | $0 | $0 | $0 | $0 | $0 | $0 | $0 | $0 | $0 | |
| Dividends | $0 | $0 | $0 | $0 | $0 | $0 | $0 | $0 | $0 | $0 | $0 | $0 | |
| Subtotal Cash Spent | $10,429 | $13,408 | $12,871 | $13,386 | $13,931 | $14,509 | $15,121 | $15,771 | $16,459 | $18,185 | $18,952 | $20,265 | |
| Net Cash Flow | $132 | ($2,213) | ($1,005) | ($808) | ($598) | ($376) | ($140) | $109 | $374 | ($343) | ($39) | ($218) | |
| Cash Balance | $10,132 | $7,919 | $6,914 | $6,106 | $5,508 | $5,132 | $4,992 | $5,101 | $5,474 | $5,132 | $5,093 | $4,875 | |
| Pro Forma Balance Sheet | |||||||||||||
| Month 1 | Month 2 | Month 3 | Month 4 | Month 5 | Month 6 | Month 7 | Month 8 | Month 9 | Month 10 | Month 11 | Month 12 | ||
| Assets | Starting Balances | ||||||||||||
| Current Assets | |||||||||||||
| Cash | $10,000 | $10,132 | $7,919 | $6,914 | $6,106 | $5,508 | $5,132 | $4,992 | $5,101 | $5,474 | $5,132 | $5,093 | $4,875 |
| Inventory | $1,000 | $3,380 | $3,583 | $3,798 | $4,026 | $4,267 | $4,523 | $4,795 | $5,082 | $5,387 | $5,710 | $6,053 | $6,416 |
| Other Current Assets | $500 | $500 | $500 | $500 | $500 | $500 | $500 | $500 | $500 | $500 | $500 | $500 | $500 |
| Total Current Assets | $11,500 | $14,012 | $12,002 | $11,211 | $10,632 | $10,275 | $10,155 | $10,286 | $10,683 | $11,361 | $11,342 | $11,646 | $11,791 |
| Long-term Assets | |||||||||||||
| Long-term Assets | $1,400 | $1,400 | $1,400 | $1,400 | $1,400 | $1,400 | $1,400 | $1,400 | $1,400 | $1,400 | $1,400 | $1,400 | $1,400 |
| Accumulated Depreciation | $0 | $23 | $47 | $70 | $93 | $117 | $140 | $163 | $187 | $210 | $233 | $257 | $280 |
| Total Long-term Assets | $1,400 | $1,377 | $1,353 | $1,330 | $1,307 | $1,283 | $1,260 | $1,237 | $1,213 | $1,190 | $1,167 | $1,143 | $1,120 |
| Total Assets | $12,900 | $15,389 | $13,355 | $12,541 | $11,938 | $11,558 | $11,415 | $11,523 | $11,896 | $12,552 | $12,509 | $12,789 | $12,911 |
| Liabilities and Capital | Month 1 | Month 2 | Month 3 | Month 4 | Month 5 | Month 6 | Month 7 | Month 8 | Month 9 | Month 10 | Month 11 | Month 12 | |
| Current Liabilities | |||||||||||||
| Accounts Payable | $1,000 | $4,872 | $4,045 | $4,252 | $4,470 | $4,702 | $4,948 | $5,208 | $5,484 | $5,777 | $6,084 | $6,410 | $6,756 |
| Current Borrowing | $4,000 | $4,000 | $4,000 | $4,000 | $4,000 | $4,000 | $4,000 | $4,000 | $4,000 | $4,000 | $3,500 | $3,000 | $2,500 |
| Other Current Liabilities | $5,000 | $5,000 | $5,000 | $5,000 | $5,000 | $5,000 | $5,000 | $5,000 | $5,000 | $5,000 | $4,500 | $4,000 | $3,000 |
| Subtotal Current Liabilities | $10,000 | $13,872 | $13,045 | $13,252 | $13,470 | $13,702 | $13,948 | $14,208 | $14,484 | $14,777 | $14,084 | $13,410 | $12,256 |
| Long-term Liabilities | $0 | $0 | $0 | $0 | $0 | $0 | $0 | $0 | $0 | $0 | $0 | $0 | $0 |
| Total Liabilities | $10,000 | $13,872 | $13,045 | $13,252 | $13,470 | $13,702 | $13,948 | $14,208 | $14,484 | $14,777 | $14,084 | $13,410 | $12,256 |
| Paid-in Capital | $6,600 | $6,600 | $6,600 | $6,600 | $6,600 | $6,600 | $6,600 | $6,600 | $6,600 | $6,600 | $6,600 | $6,600 | $6,600 |
| Retained Earnings | ($3,700) | ($3,700) | ($3,700) | ($3,700) | ($3,700) | ($3,700) | ($3,700) | ($3,700) | ($3,700) | ($3,700) | ($3,700) | ($3,700) | ($3,700) |
| Earnings | $0 | ($1,383) | ($2,590) | ($3,610) | ($4,432) | ($5,044) | ($5,433) | ($5,585) | ($5,488) | ($5,126) | ($4,476) | ($3,521) | ($2,245) |
| Total Capital | $2,900 | $1,517 | $310 | ($710) | ($1,532) | ($2,144) | ($2,533) | ($2,685) | ($2,588) | ($2,226) | ($1,576) | ($621) | $655 |
| Total Liabilities and Capital | $12,900 | $15,389 | $13,355 | $12,541 | $11,938 | $11,558 | $11,415 | $11,523 | $11,896 | $12,552 | $12,509 | $12,789 | $12,911 |
| Net Worth | $2,900 | $1,517 | $310 | ($710) | ($1,532) | ($2,144) | ($2,533) | ($2,685) | ($2,588) | ($2,226) | ($1,576) | ($621) | $655 |


