
MusicWest
Executive Summary
An exciting opportunity currently exists for a full service musical instrument retailer in Albuquerque. Although there are a number of musical instrument retailers in this city of over 500,000 people, there are currently only three very small school band and orchestral instrument dealers; these stores have small selections and short hours. At the other end of the spectrum (stores with a more guitar and electrical focus), big chains are competing on prices at the expense of customer service.
MusicWest will offer the buying public a superior shopping alternative, with a huge selection of school band and orchestra instruments, plus guitars, keyboards and accessories, at reasonable prices. Our products will be supported by skilled repair services and a knowledgeable and friendly staff, as focused on educating the customer as on closing the sale. We will exploit our competitors’ weaknesses by offering ongoing music community events, from free lessons, to music clubs, to after-sale follow up to turn one-time shoppers into lifelong customers. Our unique marketing schemes include “You Play, We Pay” (whereby a portion of instrument sales and rentals are donated to local school band programs) and “100% Money Back” trade up programs, where customers receive 100% of their purchase price toward upgrading their instrument within one year.
MusicWest will focus on the novice, hobbyist, and semi-professional musician; these three groups are seeking value, customer service, and knowledgeable assistance in making what can be a rather significant purchase. MusicWest will gain a reasonably large percentage of market share in a short period by immediately differentiating ourselves from our competitors. We will establish our branding with our superior service and selection, the excitingly modern look of our retail environment, our “hands on” merchandising approach, and a series of ads with our motto: Stop Dreaming, Start Playing. Once in the store, our clients want to come back often for the special treatment they receive here and nowhere else.
The co-owner of MusicWest, David Moore, has over seven years of experience as the store manager at two successful local music stores. He has seen firsthand where opportunities are missed through lack of follow-through or careful planning, and knows what local customers are looking for.
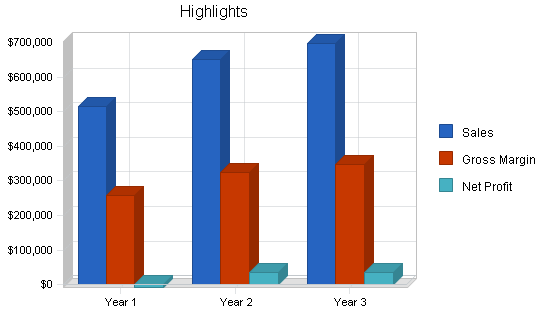
Based on his experience at other local music stores, David Moore conservatively projects sales of over $500,000 in the first year, increasing to almost $700,000 by year three. We will start generating a profit in September, and profits will increase steadily thereafter.
Although MusicWest may not become the biggest, our intention is to become a “Must-Shop Destination” for those looking to buy a new or used musical instrument in Albuquerque!
1.1 Mission
MusicWest provides musical instruments to the community. We separate ourselves from our direct competitors by paying intense personal attention to our customers, and educating our clients about the products they need or desire before, during, and after the sale. We offer creative programs to reward customer loyalty, and we provide on-site repair services for the items we sell. We consider our staff our partners and insist they prosper equitably with the growth and success of the company. We will have the largest selection of School Band and Orchestral instruments in New Mexico, and will use that advantage to separate ourselves from the competition.
1.2 Keys to Success
- Establish a well-respected music lesson department and start a rapport early with school band and church music leaders.
- Offer extended hours to serve a larger portion of the buying public than our competitors do.
- Educate the buying public by merchandising our products with informational/tutorial signage and literature, and by backing that up with knowledgeable salespeople.
- Offer the services of a full time repair department to our client base.
- Continually modify the product and service offerings to stay on the leading edge of technology within our market.
- Exploit the many weaknesses of our local and national competitors to differentiate ourselves from them.
1.3 Objectives
- Gain 25% of the local market share within the first three years.
- Maintain a minimum gross profit margin of 40%.
- Create a hands-on, educational approach to musical instrument merchandising.
- Target the large number of school band instrument customers who currently bypass local music stores for catalog or internet sales, due to poor service, selection and prices.
- Aggressively target the public school system and local religious organizations.
Company Summary
MusicWest is a retailer of musical instruments and their accessories, located on Albuquerque’s Westside. MusicWest will differentiate itself from its direct competitors by marketing the store’s educational approach, and one of the most hands-on store layouts of its type in Albuquerque. In addition, we will offer a wider selection of products, and more services to reward customer loyalty, than our competitors.
2.1 Start-up Summary
Start up costs will cover all inventory, site modification, website creation, necessary equipment and the necessary capital to fund operation of the business through the first year. In particular, we foresee a need for substantial initial working capital with a large purchase of initial inventory to sufficiently maintain and grow the business. We intend to secure financing through conventional lending sources or with a (7A) conventional SBA loan guarantee. The balance of the funds will be covered by owners investment.

| Start-up | |
| Requirements | |
| Start-up Expenses | |
| Legal | $1,000 |
| Stationery etc. | $500 |
| Space Renovation/Preparation/Signage | $20,000 |
| Miscellaneous Expenses | $1,500 |
| Insurance | $500 |
| Rent & Deposits | $4,000 |
| Pre-Opening Salaries | $4,000 |
| Phone System | $2,500 |
| Other | $0 |
| Total Start-up Expenses | $34,000 |
| Start-up Assets | |
| Cash Required | $68,500 |
| Start-up Inventory | $150,000 |
| Other Current Assets | $0 |
| Long-term Assets | $7,500 |
| Total Assets | $226,000 |
| Total Requirements | $260,000 |
| Start-up Funding | |
| Start-up Expenses to Fund | $34,000 |
| Start-up Assets to Fund | $226,000 |
| Total Funding Required | $260,000 |
| Assets | |
| Non-cash Assets from Start-up | $157,500 |
| Cash Requirements from Start-up | $68,500 |
| Additional Cash Raised | $0 |
| Cash Balance on Starting Date | $68,500 |
| Total Assets | $226,000 |
| Liabilities and Capital | |
| Liabilities | |
| Current Borrowing | $0 |
| Long-term Liabilities | $200,000 |
| Accounts Payable (Outstanding Bills) | $0 |
| Other Current Liabilities (interest-free) | $0 |
| Total Liabilities | $200,000 |
| Capital | |
| Planned Investment | |
| Investment by Dave & Kayle Moore | $50,000 |
| Investment by Ray Himes | $10,000 |
| Additional Investment Requirement | $0 |
| Total Planned Investment | $60,000 |
| Loss at Start-up (Start-up Expenses) | ($34,000) |
| Total Capital | $26,000 |
| Total Capital and Liabilities | $226,000 |
| Total Funding | $260,000 |
2.2 Company Locations and Facilities
We have chosen a site at Ladera Shopping Center on Coors Blvd. near I-40 for several reasons:
- Close proximity to Interstate 40.
- Safe and plentiful parking area.
- Near high-traffic tenants such as Home Depot and Staples, and anchored by a WalMart Supercenter.
- Beneficial demographics: over 150,000 households within a 5-mile radius, 85,000+ cars per day on the two cross-streets, and no direct competitors within 10 miles.
All of the above qualities are consistent with MusicWest’s goal of providing a fresh approach to musical instrument retailing. We are looking at leasing approximately 3,500 sq.ft. of space, which will allow sufficient room for up to six lesson studios, a repair area and necessary storage and office space. We expect usable selling space to end up being around 2,400 sq.ft.
2.3 Company Ownership
MusicWest will be a partnership. The principles of the business are Kayle and David Moore. Kayle Moore will assume the position of President/Office Manager, while David Moore will assume the duties of Store Manager.
Products and Services
MusicWest will sell new and used musical instruments and accessories. Our primary items will be new band and orchestral instruments, electric and acoustic guitars, amplifiers and electronic keyboards. In addition we will have a full service, on-site repair and customization department (band instruments, guitars and electronics).

We will offer a “state of the art” music lesson program featuring top degreed instructors, as part of our overall focus on educating our customer base. This program will include private and group lessons, as well as outreach to local schools. We will also develop music clubs geared to children and seniors, to further serve our local community.
Although offering school band and orchestral instruments, service and lessons will be our main competitive advantage, guitars will remain the primary revenue producer for musical instrument stores for the foreseeable future.
3.1 Product and Service Description
MusicWest will offer several name brand instruments such as:
- A large selection of band instruments by Selmer/Bach, Yamaha, and Leblanc with an emphasis on the intermediate level instruments.
- Electric and acoustic guitars including Albuquerque exclusive lines by Fernandez, Suzuki, Wechter and other nationally known brands, such as Takemine, Ovation and Martin.
- Amplifiers by Crate, Kustom, Traynor and Hiwatt to support our guitar sales.
- Keyboards by Yamaha, Suzuki and Korg.
- Sound reinforcement products will be exclusively Yorkville. We will be the only dealer in New Mexico, and will offer a rental program for local bands and schools.
- A very well stocked accessory department to support the above items. A recent Music Trades article found that 80% of the buying public considered this the most important reason they buy from a musical instrument dealer.
In addition to complete repair services for our products, we will emphasize upgrades and customization items to develop other income streams our competitors have not considered. When carrying a brand name item conflicts with giving the customer the best all-around value, we will always pursue the product that best suits our client’s interest.
3.2 Competitive Comparison
MusicWest is different from its competitors in several key areas:
- Our three largest competitors do not carry band and orchestral instruments, one of our primary focuses.
- We offer services to support our products, and most of our competitors sell just the products themselves.
- MusicWest will take full advantage of “name brand recognition,” an element that most dealers overlook and under-advertise.
- MusicWest will capitalize on our competitors’ weakness in the accessory category by keeping ours well-stocked.
Musical instruments cannot be fully enjoyed without knowledge and experience. Unfortunately, we cannot sell these products at a higher price just because we offer repair and instructional services; the market does not support dealers who have tried this. We must offer varied services and product mixes and be competitively priced as well, in order to survive in this new economy. In addition to educating our customer base, we are committed to providing the best product value.
Accessories are the highest profit center for the store and we have to expose our competitors’ weakness in this area if we wish to expand market share from day one of operations. Competitors that do not stock the necessary accessories will send their customers to competing stores, from which customers may not return. We must keep our accessory department well-stocked to take advantage of our competitors’ flaws, and avoid this pitfall ourselves.
3.3 Fulfillment
When feasible, MusicWest will buy its inventory directly from the manufacturer in order to obtain the lowest price possible. We will make use of one or two jobbers that sell a large variety of small goods that would be impractical to obtain directly. We will frequently compare prices of these distributors to ensure we are getting the very best price possible per item. That said, MusicWest will always put the quality/value of the product we pass on to the consumer ahead of price. The majority of our competitors buy by the piece rather than by the box or case lot. We intend to buy our key, best-selling items in bulk, to obtain a pricing advantage over our direct competitors. Common discounts in the industry consist of free freight, repayment term incentives, additional free merchandise or incremental percentage discounts on quantity purchases.
Although we will buy key items in bulk when practical, we will also remind ourselves that sometimes a better deal for the sake of lower prices is not the best move for our bottom line. We should not risk over-stocking new or unproven merchandise just to get a small advantage in price over competitors.
3.4 Technology
The Music Industry is currently riding a trend toward high-tech electronics in several product areas, most notably in guitar related effects and multi-track recording hard/software. Sales increases in these areas are due to the slashing of the price barrier in the home recording market, and the pace at which new products become obsolete. This high tech boom has increased the M.I. market substantially.
Digital keyboards are also seeing increased market share as technology becomes more accessible. These units offer families state-of-the-art sounds and capabilities without a huge learning curve. For instance, digital piano sales are currently the fastest growing segment of the total piano market in the U.S., and sales have increased 450% over the last ten years.
One downside of technological innovations is that prices in this industry are dropping sharply, lowering revenues per unit. It is therefore essential that the Musical Instrument retailer of today bundle products together as packages, to increase profits and build sales.
3.5 Future Products and Services
MusicWest will rotate its stock so that new products are always available. The store will balance what is popular today with what will be popular tomorrow. We will institute the following programs in order to ensure expansion of the store:
- We hope to become the only store in New Mexico to institute the “Weekend Warrior” program, sponsored by the National Association of Music Merchants (N.A.M.M.). This program is responsible for bringing back into the fold many who had given up on music. The program has successfully raised income opportunities for the stores who have implemented it.
- By the end of the first year of operations, we must place major emphasis on developing our own school band instrument rental program. This rental program will allow us to insulate ourselves from any large-scale competitors that might locate here, and generate consistent year round high profit income opportunities.
- MusicWest will take advantage of the internet as a major tool for passing along information about our store and products to potential and current clients. We will maintain this site as a local site, geared toward information and service. We believe that placing a sales engine in our website would only lower our initial profit margin and limit sales opportunities, so we will avoid this for now.
- We hope to start music clubs geared to children and seniors. These will be clubs that we can support with little cost, but which can generate additional sales not actively targeted by our competitors.
- In the long term, there are many avenues we can explore, such as traditional piano sales, professional sound installations, and service contracts with the public and private school systems.
Market Analysis Summary
Consumers spent $6.9 billion on musical instruments nationally in 2003. This was the second highest yearly total on record. The industry achieved these numbers even with a slow economy and the stock market in a period of transition. Lower pricing was a factor in the increased sales, but this also lowered profits and overall industry dollars, decreasing the yearly total from the industry high of $7.1 billion in 2002.
Key sales areas related to our business model are:
- Fretted instruments $903.2 million.
- School Band Instruments $532.2 million.
- Sound Reinforcement $819.9 million.
- Printed Music $511 million.
- Electronic Keyboards $200.7 million.
- General accessories up 4.8% in retail dollars shipped, to $364.3 million.
In the musical instrument industry, consumers are looking for wide selections, prompt and knowledgeable service, good product value, and music lessons to further their understanding and enjoyment of the products. They prefer to find stores offering these benefits through word of mouth.
The musical instrument market has recently been driven by a number of low-cost, high-selection Internet and mail order companies, which has caused prices to level out, by giving consumers comparison shopping at their fingertips. In response, various large chains have tried to offer similarly wide selections in their physical retail spaces, at the expense of staff training and customer service. However, the high-profile advertising generated by these chains has rippled down even to small stores, as more and more musicians at all levels start to seek out the missing elements of these sales model. MusicWest has the experience, prices, and focus on customer service to fill these gaps.
4.1 Market Segmentation
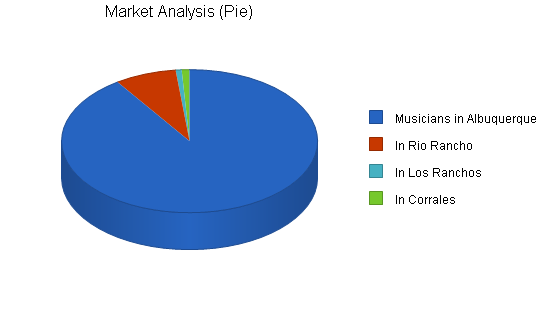
The following market segmentation table is based on the finding that roughly 46% of the general population are “musicians” of some form or another. Within that group, there are different segments, ranging from professionals, to semi-professionals, to hobbyists and novices. It is very difficult to make a single demographic profile of the typical consumer for this industry, as within each instrument or client type, the figures for age and income will vary drastically. The market analysis numbers show the 46% of the local population around MusicWest who will serve as our potential customer base.
Listed directly below are the latest industry figures relating for New Mexico in total Musical Instrument sales:
| Sales Rank – National | 38 |
| 2002 total music sales | $41.4 million |
| 2001 total music sales | $40.8 million |
| 2002 number of music stores | 59 |
| 2001 number of music stores | 57 |
| 2002 sales per store | $701,694 |
| 2001 sales per store | $715,789 |
| 2002 population | 1,829,146 |
| 2002-2001 population change | +.56% |
| % of Pop. under 5 years old | 7.2% |
| % of pop. 6-18 years old | 28% |
| % of pop. over 65 years old | 11.7% |
| 2001 median income | $35,254 |
| Per capita spending – all retail | $8697 |
| Per capita spending – music only | $22.63 |
| Population rank | 37 |
| Market Analysis | |||||||
| Year 1 | Year 2 | Year 3 | Year 4 | Year 5 | |||
| Potential Customers | Growth | CAGR | |||||
| Musicians in Albuquerque | 3% | 280,050 | 288,452 | 297,105 | 306,018 | 315,199 | 3.00% |
| In Rio Rancho | 5% | 23,920 | 25,116 | 26,372 | 27,690 | 29,075 | 5.00% |
| In Los Ranchos | 1% | 2,308 | 2,331 | 2,354 | 2,378 | 2,402 | 1.00% |
| In Corrales | 3% | 3,051 | 3,143 | 3,237 | 3,334 | 3,434 | 3.00% |
| Total | 3.14% | 309,329 | 319,041 | 329,068 | 339,420 | 350,109 | 3.14% |
4.2 Target Market Segment Strategy
We intend to target musical novices, hobbyists, and semi-professionals. These groups include the largest percentage of musicians, with the greatest amount of disposable income. These market segments can generally be approached with the same marketing techniques, and can be very loyal when treated properly.
We have chosen not to make professional musicians our focus for several reasons. Professional musicians require a great deal more attention and require much less profitable pricing, and they prefer a more exclusive shopping environment away from the novice consumers (ego).
4.2.1 Market Needs
Our target clientele, though varied, can be approached in very much the same manner. Their most important market needs are:
- Selection
- Value
- Service
- Lessons
Most musicians need support and service. The instruments that we sell can be difficult or impossible for end users to service. Potential clients tend to seek stores that can fulfill these services through word of mouth referrals and/or direct shopping experiences. These musicians come back time after time if they feel they are getting a fair deal.
One of the most common complaints from musicians in our market is the high turnover of sales staff at other dealers, and the resulting inconsistencies in their shopping experiences from day to day. Consumers like to see the same faces on each visit and this business is one that thrives with the personal relationships salespeople develop with their clientele.
In addition, female customers have traditionally been treated poorly by this male dominated field. By reversing this trend, reinforced by ongoing sales training and with unbiased customer interaction by our sales staff, we can further exploit the weaknesses of our top local competitors.
4.2.2 Market Trends
The musical instruments market is currently being driven by mail order and internet retailers. Although such companies are known for low pricing and large selection, their prices have bottomed out at a level the smaller stores can offer, while still remaining financially sound. Retail mega-stores such as Guitar Center and Sam Ash are growing at a steady pace, but appear to be affecting the market in a positive manner. Their high level of advertising drives in more consumers, who in turn will seek out other music stores for comparison-shopping, and for the music lessons and personal service not offered by most of the mega-stores.
Consumers increasingly expect the music stores they deal with to offer a clean, high-tech and comfortable shopping environment, and more personal service to explain the ever-increasing levels of technology in musical instruments. Consumers generally want all this and expect to see prices consistent with the mega-stores. In short, they want a one-stop shopping experience. We have shopped these major chain stores, and find that they have poor customer service, and that their average employee is under-trained in sales and technical aspects unique to this industry. Another trend that benefits this industry is that as production moves to other nations such as China (due to lower cost of manufacturing), prices go down and units sold go up, increasing revenue opportunities.
4.2.3 Market Growth
The musical instrument market has seen steady growth over the last ten years, with revenue increasing from $4.2 billion in 1995 to $7.1 billion in 2000. 2003 sales were down to $6.9 billion, still the second highest year in industry history. These numbers were reached in spite of the difficulties with the economy and turmoil on Wall Street. The most dramatically declining product was acoustic pianos, a product we are not interested in at the present time. The market had seen steady growth of around 4% over the last few years, despite other key industries being down (for example, automobiles down 7%, personal computers down 3% and new home construction down 1.8%). In addition, 10-year growth patterns for the last decade show incredible gains in key instrument categories. We expect these trends to continue as the economy strengthens.
4.3 Service Business Analysis
Musical instrument retailing is accomplished through a variety of outlets:
- Local Musical Instrument retailers: Storefront reseller with less than 10,000 square feet. These retailers usually carry one to three main brands and offer a mix of instruments and accessories. Occasionally these will be specialty stores, offering only one type of instrument for sale (i.e. drums, pianos or band instruments).
- Chain stores and Superstores: These include major chains such as Guitar Center and Sam Ash. These stores are always bigger than 10,000 square feet and offer greater selection of instruments. These stores offer sub-standard walk-in service and generally cater to people looking for products in boxes with aggressive pricing and little support.
- Mail Order: The market is increasingly served by mail order businesses that offer aggressive pricing of boxed product. For the purely price-driven buyer, who buys boxes and expects no service, this can be very attractive. These dealers also serve as an educational tool by displaying items that most local dealers do not stock.
- Others: These include direct sales by manufacturers and the increasing number of Internet sites that are mainly price driven. EBay has also become a player in this category.
4.3.1 Distributing a Service
Musical instrument re-sellers are supplied by a variety of means:
- Direct purchases from manufacturers – generally the best price, but higher minimum orders.
- Purchases from national distributors – large selections, good prices.
- Purchases from regional distributors – small selection, average pricing.
- Specialty distributors/mfg. reps – good to great pricing based on yearly volume.
4.3.2 Competition and Buying Patterns
Consumers expect to walk into a clean, well-stocked shopping environment. The consumers do shop between stores, as buying a musical instrument is a big purchase for most. Price tends to be a huge influence on most musical instrument buyers; if they feel your pricing is out of line with the market they will usually walk right out. On the other hand, if they feel your price is in line with the market they tend to look to what else your store offers, such as lessons, repair facilities, knowledgeable staff, etc. Growing percentages of customers are price-driven only, and want to be handled in a direct and efficient manner without lengthy price negotiations. Accessory buyers tend to find the store closest to their home or place of work for the sake of convenience.
4.3.3 Main Competitors
There are several local retailers that will compete with us on some level. In the following segments, we will attempt to give a consumer view of the main competitors, from largest to smallest, and a brief description of the others. For school band instruments, our two main competitors are Music World and Baum’s Music, and for guitars and amps Marc’s Guitar and, to a lesser extent, Guitar Center and Grandma’s Music and Sound. Grandma’s and Guitar Center are the two largest stores, but they do not sell school band or orchestral instruments. There are only three band instrument purveyors in Albuquerque, and all are small-scale operations.
4.3.3.1 Marc’s Guitar Center
Marc’s Guitar Center, 2324 Central Avenue SE, Albuquerque, NM 87111
Hours Mon-Fri: 10-6 | Sat: 10-5:30
Marc’s Guitar Center is a small shop catering to beginning players. This store offers a very limited selection of electric and acoustic guitars and amplifiers at generally average market prices. The store has two full-time teachers and its proximity to the University of New Mexico is a prime factor in its success. Marc’s does only small local advertising in its general vicinity and relies on the yellow pages and word of mouth for its expansion. The store is in its 25th year of business. Although the location is its greatest asset, many people do not like to visit the university area, due to its exaggerated reputation for high traffic and crime. The store carries some name brands and a few “B” brands.
4.3.3.2 Music World
Music World of Albuquerque, 7017 Menaul NE, Albuquerque, NM 87110
Hours Mon-Sat: 9-6
Music World is a full line retailer going through severe changes. Three years ago, Don Johnson, the owner of Music World, bought the two King Music Stores that had been in Albuquerque since the 1950s, and then opened a second Music World location in Santa Fe around the same time. Within one year’s time he had 100% employee turnover at the King locations, and as of this plan he has closed all three stores and moved his last remaining Music World store into the old King Music building on Menaul. The store carries a few name brands augmented by basic accessory lines. The King Music stores, at their peak, were generating approximately $1.8 million between the two locations, but sales had fallen off by more than half when Mr. Johnson purchased them. The stores have always had the reputation for high prices and have always pushed the idea that they provide more service than most. In fact, the stores offered little more service than one normally expected to receive. Music World is extremely out of date in their sales and marketing techniques, and is on the declining slope of technology. These stores sell basic items available anywhere. The store recently lost its largest piano line (Baldwin/Wurlitzer). As of the date of this plan, Music World is experiencing severe cash flow problems and is in litigation for discriminatory employment practices with former employees. A second lawsuit has been filed by his former landlord for damages done to the premises.
4.3.3.3 Other Competitors
The following are additional but smaller competitors:
Lesman’s Music – Specializes in dj and recording gear and rentals. Lesman’s recently downsized from a full line retail operation. They have a very poor reputation but still fulfill a need to the community. The store recently moved to a new location that, oddly, has no storefront parking.
Baum’s Music – School band instruments only. They have a good reputation and loyal clientele. Baum’s offers instrument rentals. The store primarily stocks a few entry-level instruments and has a large repair department.
Rio Rancho Music – School band instruments only. They call on school band directors as a means to drive the business. They offer rentals but have a very poor reputation in the community. The store has been for sale for over five years.
Encore Music – Very small retailer that specializes in vintage gear and some new guitars and amps. They have a decent reputation. They do some minor repairs. This store is rumored to be having cash flow issues.
Robertson’s & Sons – Specializes in orchestral instruments. The store has average pricing on most items. They have a very good reputation and are world renowned for their repair department.
Music Go Round – Franchised used musical instrument dealer.
Apple Mountain Music – Folk instruments are their focus. They offer music clubs on ethnic instruments; open part time.
Studio D – A pawn shop/music store; some new, mostly used, gear.
Luchetti Music – Recently out of business; was a drum specialty store.
Mail order catalogs:
There are several mail order providers on the national scene. The biggest of these is Musician’s Friend (owned by Guitar Center) out of Medford, Oregon. These low cost competitors drive the market. They have large inventories and offer all of the latest products to hit the market, usually before the local storefront dealers. These mail order shops are taking a large bite out of the local dealers’ market, but also contribute to educating the public on new items, and assist in growing the overall market on a national level. Service can be less than ideal, and shipping and handling fees are involved. Other catalog dealers are Venemans Music Emporium, American Music Supply, and International Musician’s Supply.
4.3.3.4 Grandma’s Music and Sound
Grandma’s Music and Sound, 800 S-T Juan Tabo NE, Albuquerque, NM 87123
Hours Mon-Fri: 9-6 | Sat: 10-5
Grandma’s Music is Albuquerque’s largest musical instrument retailer, with over 13,500 sq. ft.
This store is a pro shop that carries state-of-the-art technology within its pro audio department. Grandma’s carries guitars, drums, sound reinforcement, pro audio, dj and general accessories. The store stocks a huge amount of name brand gear. The store also has a large presence in the mail order and Internet sales areas. The store operates on aggressive pricing and high volume sales and is generating approximately $6 million in sales per annum. Grandma’s has a poor reputation with the average non-professional musician, in terms of customer service. All customers are definitely not treated alike here. The store has repair facilities and a large staff, but again suffers from apathy toward non-professional shoppers. The stores pricing is adjusted to the knowledge level of the customer. The store in general is very well laid out and has state of the art lighting and displays, but is also very cluttered, with hazardous audio cables strewn about the floor where one might trip over them. As of this plan, Grandma’s is relocating to the Westside at the intersection of Paseo Del Norte and Coors Blvd. They have no plans to add teachers at the new location.
4.3.3.5 Guitar Center
Guitar Center 6001 Menaul Blvd. NE, Suite B, Albuquerque, NM 87110
Hours Mon-Fri: 11-7 | Sat: 10-6 | Sun: 12-6
Guitar Center is the nations largest musical instrument retailer with local space over 13,000 sq. ft.
Guitar Center is the nation’s leading retailer of guitars, amplifiers, percussion instruments, keyboards and pro-audio and recording equipment. They presently operate 128 Guitar Center stores, with 108 stores in 46 major markets and 20 stores in secondary markets across the U.S., including Albuquerque. Guitar Center is also the largest direct response retailer of musical instruments in the U.S. through its wholly owned subsidiary, Musician’s Friend, Inc. Its catalog and website, www.musiciansfriend.com, opened in Albuquerque in March, 2004.
4.3.4 Business Participants
Superstores are a growing presence in the larger markets. These stores benefit from national advertising, economies of scale, and volume buying, and carry the latest name-brand items. The aggressive pricing and selection of the superstores threaten the smaller local stores.
These local stores are generally mom and pop stores that are under-capitalized and suffer from an outdated management philosophy. Unless these stores can adjust to the superstores’ way of marketing and selling, they run the risk of increasingly losing key lines and eventually the core of their customer base.
Many small to medium companies who have adapted to this new way of doing business are increasing their business even with the superstores in their immediate vicinity. These smaller stores are able to offer services and support that the giants cannot, and have focused their stock in order to compete on a more level playing field. MusicWest intends to fit in this category.
Strategy and Implementation Summary
We will build strong relationships with our customers by providing stellar personal service and by exceeding our customers’ expectations on each visit. We will provide unique programs to reward them and gain repeat business. MusicWest intends to attract customers away from the mail order firms and bring them back to the local market. It will not be easy, but with a commitment to offer our customers an exciting educational environment along with up front, fair pricing, and excellent before and after the sale service, we can succeed.
5.1 Strategy Pyramid
Our main strategy is to out-serve the competition. We will accomplish this through strong personal sales/service, educational aspects, and proper product selection. Programs such as our “100% of purchase price trade up guarantee” and our “You play, we pay” incentive programs will support these areas of concentration. In addition, we intend to build strong relationships with key consumers who have influence on the purchasing decisions of others, be they teachers, clergy or performing musicians. These individuals are important to the long-term success of the business. We will take advantage of the great clinics and concerts provided by our manufacturers and suppliers to bring excitement and energy to our customer base; we will also bring in local stand-out musicians. We will follow up on these events with call-backs and surveys to maximize their potential for future sales.
5.2 Value Proposition
MusicWest offers the novice to semi-professional musician the convenience of a wide selection, unique offers, experienced and reliable staff, and an educationally-focused community center, all in one location. These values more than offset our lack of usefulness to the professional musician market segment.
5.3 Competitive Edge
Our most critical competitive edge will be the way we treat our customer base. We must deliver greater interaction and satisfaction than our peers to every consumer from the start, in order to win their trust and earn their repeat business. Musical instrument consumers in the Albuquerque area are used to poor service and the apathy of local dealers. We must break this chain if we are to differentiate ourselves from the competition and excel. Our unique marketing plans and repair/customization services will also make us stand out from the crowd. We will have a multi-faceted plan of attack in place to accommodate our prospects from the beginning to the end of their shopping experience. We will also go a step further through our customer retention plans, by keeping our store in the minds of these customers after they leave, so they will want to return. None of our local competitors actively does this.
5.4 Marketing Strategy
The marketing strategy is as follows:
- Emphasize our superior service and support.
- Aggressively expose competitors’ weaknesses in order to attract new clientele.
- Key in on consumers who have been pushed out of the market by local dealer apathy.
- Educate our clients and respect their needs. Address these needs to keep them coming back.
- Exude our excitement and enthusiasm for music to our customers.
- Always, always differentiate ourselves from our competition.
- Consistently end all of our advertising with our motto, “Stop dreaming, start playing,” to make our advertisements easily recognizable to the public.
5.4.1 Pricing Strategy
The industry is going through a period of adjustment in regards to pricing. Many manufacturers have instituted MAP pricing (minimum advertised price) which has stabilized margins to some degree; however, they also sell at lower prices to the big box stores, which places smaller dealers at a distinct disadvantage. Consumers have also become more knowledgeable and continue to hunt for low prices. Our research has shown that many of these consumers buy for price, but then when they find the after-sale service lacking, look for alternative vendors, who may not have the lowest price but do have the service to back the sale. Novice buyers are generally more concerned with the value and quality of items they are buying than with price. MusicWest will address these issues with a multi-faceted plan on pricing.
Our plan requires that all of our merchandise be clearly marked with fair, street-value prices. These prices will be appealing to 85% of our customers. For those consumers requiring deeper discounts, our entire sales staff will be empowered to negotiate discounts if the sales representative deems it in the best interest of the store. Value adding and margin boosting merchandise will be bundled with low margin bestsellers to keep net margins acceptable. For all of this to come about, we must first approach and give thorough sales presentations to each potential customer that walks through our door, and we must interrogate them to find out any pricing issues that may affect the buying decision. Additionally, we must actively pursue adding non-traditional means of income to each major ticket sale; i.e. upgrades/customization, service contracts, rentals. This will allow us to not only gain our customers’ confidence, but will give us additional revenue streams the average Musical Instruments dealer has not even considered.
5.4.2 Promotion Strategy
MusicWest will target our desired customer base using Radio, Direct Mail, Newspapers and word of mouth. Radio is the greatest vehicle to reach musicians for the simple reason that the love of music is what drives us to become musicians. Direct Mail will target consumers who are budget or coupon minded. Newsprint reaches a large portion of the public, letting them see what we have to offer before making a trip to the store. Word of mouth is the one area we really hope to see develop, as a personal endorsement by a customer is worth more to us than what any advertisement can achieve.
MusicWest will always promote itself as an education oriented store, offering private and group lessons for all the instruments we sell. Our motto is “Stop Dreaming, Start Playing!“
5.4.3 Marketing Programs
Our critical marketing program will be the grand opening, so we will place our initial advertising to give the greatest coverage. Our specific goal for the event is to create the biggest buzz the local music community has ever seen regarding a new store. The base budget we have set for this event is $5,000. We will have other events that will have no direct cost, such as performing bands and contests.
We will review our efforts by canvassing targeted ZIP codes to see if we achieved the desired coverage of our target markets. After the initial grand opening, we will have ongoing promotions that will coincide with the N.A.M.M. (National Association of Music Merchants) calendar of events. For example, N.A.M.M. has named April of each year, “International Guitar Month.” N.A.M.M provides sales kits to promote these events at little or no cost to the dealer. Different staff members will handle these sales on a rotating schedule, so that all of us are involved personally with the promotion of our store.
5.4.4 Positioning Statement
For our target clientele, including those who feel abandoned by the local retailers, MusicWest will provide a complete one stop shopping experience that will address all the needs of the aspiring musician. By offering repairs and unique marketing programs such as our “You play, we pay” and our “100% of purchase price trade up policy” we can exceed the local client base’s expectations of what a music store can be. Unlike the vast majority of our competitors, MusicWest will more selectively stock products with value in mind and not just the lowest price, and we will always strive to provide the highest level of attention to our customers in order to gain their trust and purchasing power.
5.5 Sales Strategy
MusicWest will always operate under the assumption that any customer who enters our store is potentially a customer of our competitors. We will always strive to give each client our utmost attention and will try to accommodate whatever need brought him or her to us. We will make every effort to win them over in a low-pressure relaxed atmosphere, while stimulating their senses with modern eye-catching displays designed to maximize impulse buying. MusicWest will always bend to the type of customer we are serving, whether he or she is a professional, novice, parent, or child. We want the largest market share we can get and must do anything in our power to achieve this goal.
In short, nobody walks out unless we are satisfied we did everything possible to gain his or her business either today or in the future!
5.5.1 Sales Forecast
Our projections are largely based on Dave Moore’s experiences as manager of King Music and Marc’s Guitar Center, respectively. We believe we can easily meet the projected sales figures for the first year and believe we may be conservative in our projections for the next two years. The fact that there are only two band instrument dealers in our targeted territory and that these two dealers are weak, should provide a great opportunity for garnering instant credibility in the market we serve. Mr. Moore has compiled a list of over 4,000 musicians he has helped during his tenure in the Musical Instrument market. This will allow us to save time and money by drawing in proven customers for the opening of the store, and a client base to operate from during the initial months.

| Sales Forecast | |||
| Year 1 | Year 2 | Year 3 | |
| Sales | |||
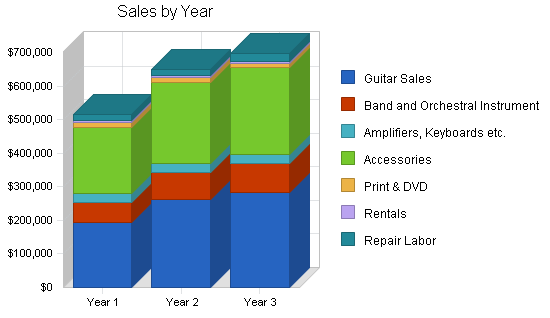
| Guitar Sales | $195,000 | $263,500 | $283,000 |
| Band and Orchestral Instruments | $58,144 | $79,000 | $85,000 |
| Amplifiers, Keyboards etc. | $27,600 | $26,200 | $27,500 |
| Accessories | $196,274 | $243,000 | $259,000 |
| Print & DVD | $15,550 | $13,500 | $14,000 |
| Rentals | $4,950 | $4,950 | $5,900 |
| Repair Labor | $17,260 | $20,000 | $22,500 |
| Total Sales | $514,778 | $650,150 | $696,900 |
| Direct Cost of Sales | Year 1 | Year 2 | Year 3 |
| Guitar Sales | $117,000 | $158,100 | $169,800 |
| Band and Orchestral Instruments | $29,072 | $39,500 | $42,500 |
| Amplifiers, Keyboards etc. | $16,560 | $15,720 | $16,500 |
| Accessories | $78,510 | $97,200 | $103,600 |
| Print & DVD | $9,330 | $8,100 | $8,400 |
| Rentals | $4,950 | $4,950 | $5,900 |
| Repair Labor | $2,589 | $3,000 | $3,375 |
| Subtotal Direct Cost of Sales | $258,011 | $326,570 | $350,075 |
5.5.2 Sales Programs
MusicWest will offer several programs designed to increase sales and reward customer loyalty:
- MusicWest’s “100% Of Purchase Price Trade Up Policy” on fretted instruments. Within the first year of purchase, MusicWest will give a consumer 100% of what they paid for a fretted instrument less tax toward a step-up instrument that is currently in stock. The trade can have normal wear and tear. MusicWest will be the sole judge of what qualifies as a step-up instrument.
- MusicWest’s “You Play, We Pay” incentive program for school band instruments and accessories. Students will register for the program, which will donate up to 2% of qualifying purchases to their school band booster committee for use with school band programs. A check will be forwarded to the committee quarterly.
- MusicWest’s “Free Restring” policy. MusicWest will restring your guitar free no matter where it was purchased to attract our competitors’ customers. Restring is for labor only, strings or parts extra.
- MusicWest will offer “Free Guitar Lessons” with the purchase of any type of guitar. Under this plan, the customer will get coupons for four free group lessons; a different level of these lessons will be held weekly. Classes will be taught by employees (David Moore or C. Ray Himes, our guitar experts). This program does not affect the price a customer pays for a guitar.
- MusicWest will offer a “Free Loaner Instrument” when any band instrument rented or purchased from us is in the shop for more than 48 hours.
5.6 Strategic Alliances
MusicWest will become a member of N.A.M.M. (National Association of Music Merchants). This organization plans many events throughout the year, such as, “International Guitar Month.” We intend to follow this group’s promotion schedule and to tie it in to our own advertising campaigns. No local storefront is currently taking full advantage of these offerings. By taking advantage of this trade organization’s expertise, we can save ourselves time and money on developing an effective advertisement campaign from day one. Some manufacturers also have advertising co-ops that we will use when feasible. In addition, these manufacturers provide nationally known musicians on a fee basis to their dealers, to use in informational/instructional clinics and to drive additional sales opportunities.
Web Plan Summary
MusicWest will have an informational based website containing hyper-links to our main manufacturers’ home pages. We will also offer promotional coupons to entice Web surfers to visit our storefront. We haven purposely chosen to avoid a sales engine, as we believe our major Web competitors could easily beat our local price. The User Interface we envision will be easy to page through, with exciting graphics and again it will be geared toward steering visitors to our storefront.
We will work with an outside website design and hosting service to create and maintain our website.
Management Summary
MusicWest will initially maintain a small staff of over-achievers in order to take advantage of the higher overhead of our key competitors. We will operate with a staff of four full-time employees and one to three part-time employees as needed. It is our philosophy that each employee should be empowered to make crucial decisions on the spot where it benefits our approach to customer satisfaction. This staffing approach allows us the need for only one manager for day-to-day decisions needing a final word, keeping hierarchy to a minimum. MusicWest will be very selective in future hiring, and will reward employees as the store prospers in future years. It is crucial to our business that we keep employee turnover at a minimum, as consumers in this business like to develop long-term relationships with their sales representative. Our key employees will be experienced musicians known in the community.
7.1 Organizational Structure
MusicWest will require its staff to be multi-skilled. Each employee will likely oversee many aspects of the business on a given day. Our main divisions will be Sales, Service and Administration. Our focus on customer service will depend on all of our employees knowing as much about each area of the business as possible. A complete book of structures and policies, along with successful actions, will be created and maintained from the date of opening to streamline the process of adding new employees as they become necessary. Ongoing training for all employees will be necessary in order to keep our edge on the competition.
7.2 Management Team
Kayle Moore – Co-Owner
Operations Manager
Qualifications:
Kayle is a 16-year veteran of the wholesale jewelry industry where she worked her way from an entry-level shipping clerk to the CEO/COO position with Shube’s Manufacturing. Over her 16-year tenure, Kayle took the company from 60 to over 300 employees and from $1 to over $15 million dollars in sales. Kayle’s strengths are writing and carrying out sales programs, and keeping a company within its financial limitations. Kayle, who plays the clarinet, has had a lifelong interest in music and plans to translate that enthusiasm, along with her management skills, into making MusicWest a successful long-term investment.
Related Management Strengths:
- CEO/COO level responsibility.
- Ability to get others to produce to their potential.
- Writing sales programs to generate and maintain consistent sales goals.
- Excellent communication skills.
- Maintains mutually beneficial vendor relations.
- Ability to anticipate and adapt to changing economic conditions.
- Experience negotiating complex sales contracts, including financing and shipment options with large corporate clients such as Wal-Mart and Target.
- Implemented the use of EDT computerized ordering software with clients to streamline the ordering process and allow the manufacturer to stock less raw inventory, simultaneously reducing overhead and increasing profits.
David Moore – Co-Owner
Store Manager
Qualifications:
Dave is currently the Store Manager of Marc’s Guitar Center in Albuquerque. Dave was previously Store Manager for King Music’s Westside location, where he was able to turn around a declining location and outsell the company’s flagship store for two years straight, despite fewer customers and staff. Dave has been a musician for over 23 years and toured professionally in the 80’s. Dave has been involved in sales and sales management since the age of eight. Dave has taken many sales/management courses and has had full profit and loss experience. Dave was the co-owner of a 7,500 sq.ft. retail furniture store in the early 1980’s.
Related, industry-specific strengths:
- Music Store Management. (7 years +)
- Direct purchasing of up to $400,000 in inventory annually.
- Top sales producer in the musical instrument combo department, in addition to his full time management responsibilities at both music stores where he has worked.
- Outstanding employee relations, with lower than industry average turnover.
- Excellent relations with vendors.
- Vast knowledge of Musical Instruments and the Musical Instrument Industry locally and nationally.
- Superior customer interaction/retention skills.
Additional Qualifications:
- Sales, Sales Manager and Finance Manager in the automotive industry.
- Trade show management and Sales in the Wholesale Jewelry Trade.
- Certified computer skills.
C. Ray Himes
Service Department – Manager
Qualifications:
- Graduate of the prestigious Roberto Venn School of Luthiery in Phoenix, Arizona.
- Trained in all aspects of fretted instrument repair from the simple to the complex, including re-frets, neck resets, crack repair, wiring and modification work.
- Completely versed on new construction of electric and acoustic guitars, from the planning and design phase to final product.
- Instructed in all phases of managing a full service repair shop as part of his training at Roberto Venn School of Luthiery.
- Trained personally by Dave Moore in the area of guitar sales and accessory sales, in addition to his repair duties at King Music Center and Marc’s Guitar Center.
- Great at improvising and solving difficult problems as they arise.
- Good woodworking skills essential to this position.
- Ongoing commitment to furthering his skills and knowledge of fretted instruments, in order to provide extensive repair services to clients.
- Plays in a local band: “Tanuki.”
7.3 Management Team Gaps
We believe we have assembled an excellent team of employees that will complement each others’ knowledge and skill levels. We feel weakest in is the band instrument repair department. As soon as finances permit, a knowledgeable repairman with this background would be highly desirable. We already know of one excellent candidate, who is currently working for Albuquerque public schools. The addition of this person will be a huge benefit for our store.
7.4 Personnel Plan
The personnel plan highlights our intent to hire as few employees as possible, in order to keep control over how our customers are treated during the crucial first stages of our business. We will have two full-time salespeople and two to three part-time employees to call upon as traffic demands. In addition, all key employees have agreed to work at lower pay structures to keep personnel costs at minimum during the critical first two years.
| Personnel Plan | |||
| Year 1 | Year 2 | Year 3 | |
| Dave Moore | $31,000 | $31,000 | $35,000 |
| Kayle Moore | $31,000 | $31,000 | $35,000 |
| C. Ray Himes | $26,400 | $27,000 | $32,000 |
| Full-time Employee #1 | $20,400 | $22,000 | $25,000 |
| Full-time Employee #2 | $20,400 | $22,000 | $25,000 |
| Part-time Employee #1 | $6,600 | $6,800 | $7,200 |
| Part-time Employee #2 | $6,600 | $6,800 | $7,200 |
| Seasonal Employee #1 | $1,750 | $2,350 | $2,450 |
| Total People | 7 | 8 | 8 |
| Total Payroll | $144,150 | $148,950 | $168,850 |
Financial Plan
We expect revenues and sales to increase dramatically between the second and fourth years of operation. After that high growth period, we expect growth to be steady and stable for the foreseeable future. This industry is very susceptible to consumers’ judgements about the store based on inventory, brands offered, pricing and staffing. It is crucial that we generate sufficient cash reserves during the growth years to be able to jump on future opportunities, allowing us to increase our market share.
8.1 Important Assumptions
The financial plan depends on certain assumptions, most of which are shown in the following table. The key assumptions are:
- Economy proceeding, as in recent trends, of 2 to 4% annual growth.
- No new major band and orchestral competitors on a large scale within the next two years in our direct vicinity.
- No unforeseen changes with our major vendors in regards to lines carried.
- No major change in our relationship with China or other foreign governments that would hinder product supply.
| General Assumptions | |||
| Year 1 | Year 2 | Year 3 | |
| Plan Month | 1 | 2 | 3 |
| Current Interest Rate | 6.50% | 6.50% | 6.50% |
| Long-term Interest Rate | 6.50% | 6.50% | 6.50% |
| Tax Rate | 30.00% | 30.00% | 30.00% |
| Other | 0 | 0 | 0 |
8.2 Projected Profit and Loss
If we take advantage of the current market conditions in Albuquerque, we can achieve great gains in market share during our start-up year and beyond. Our assumptions for sales are conservative compared to industry averages in similarly sized markets.


| Pro Forma Profit and Loss | |||
| Year 1 | Year 2 | Year 3 | |
| Sales | $514,778 | $650,150 | $696,900 |
| Direct Cost of Sales | $258,011 | $326,570 | $350,075 |
| Other Production Expenses | $0 | $0 | $0 |
| Total Cost of Sales | $258,011 | $326,570 | $350,075 |
| Gross Margin | $256,767 | $323,580 | $346,825 |
| Gross Margin % | 49.88% | 49.77% | 49.77% |
| Expenses | |||
| Payroll | $144,150 | $148,950 | $168,850 |
| Sales and Marketing and Other Expenses | $51,200 | $55,400 | $58,900 |
| Depreciation | $0 | $0 | $0 |
| Acountant Expense | $5,200 | $5,500 | $6,000 |
| Utilities | $17,120 | $18,000 | $19,000 |
| Insurance | $4,800 | $5,200 | $5,700 |
| Rent | $30,000 | $30,000 | $30,000 |
| Payroll Taxes | $0 | $0 | $0 |
| Website Maintenance | $300 | $325 | $350 |
| Total Operating Expenses | $252,770 | $263,375 | $288,800 |
| Profit Before Interest and Taxes | $3,997 | $60,205 | $58,025 |
| EBITDA | $3,997 | $60,205 | $58,025 |
| Interest Expense | $11,746 | $9,526 | $7,210 |
| Taxes Incurred | $0 | $15,204 | $15,244 |
| Net Profit | ($7,748) | $35,475 | $35,570 |
| Net Profit/Sales | -1.51% | 5.46% | 5.10% |
8.3 Break-even Analysis
For break-even analysis purposes, we are assuming per month running costs as shown below. Payroll on its own is a substantial portion of these costs. The break-even assumptions are based on the personal experience of the co-owner, David Moore, based on his actual experiences as manager of King Music Centers, Inc., and Marc’s Guitar Center for an average month’s need. We believe we can achieve higher than industry average margins by selectively choosing products that allow these margins to be possible, and by value-added marketing of these products and related services.

| Break-even Analysis | |
| Monthly Revenue Break-even | $42,230 |
| Assumptions: | |
| Average Percent Variable Cost | 50% |
| Estimated Monthly Fixed Cost | $21,064 |
8.4 Projected Cash Flow
Our cash flow projections show only a slight negative cash flow that our cash “in bank” will easily allow us to cover, without the need for accessing additional lines of credit financing. We will maintain a positive cash balance throughout the foreseeable future.

| Pro Forma Cash Flow | |||
| Year 1 | Year 2 | Year 3 | |
| Cash Received | |||
| Cash from Operations | |||
| Cash Sales | $514,778 | $650,150 | $696,900 |
| Subtotal Cash from Operations | $514,778 | $650,150 | $696,900 |
| Additional Cash Received | |||
| Sales Tax, VAT, HST/GST Received | $0 | $0 | $0 |
| New Current Borrowing | $0 | $0 | $0 |
| New Other Liabilities (interest-free) | $0 | $0 | $0 |
| New Long-term Liabilities | $0 | $0 | $0 |
| Sales of Other Current Assets | $0 | $0 | $0 |
| Sales of Long-term Assets | $0 | $0 | $0 |
| New Investment Received | $0 | $0 | $0 |
| Subtotal Cash Received | $514,778 | $650,150 | $696,900 |
| Expenditures | Year 1 | Year 2 | Year 3 |
| Expenditures from Operations | |||
| Cash Spending | $144,150 | $148,950 | $168,850 |
| Bill Payments | $229,463 | $454,298 | $492,649 |
| Subtotal Spent on Operations | $373,613 | $603,248 | $661,499 |
| Additional Cash Spent | |||
| Sales Tax, VAT, HST/GST Paid Out | $0 | $0 | $0 |
| Principal Repayment of Current Borrowing | $0 | $0 | $0 |
| Other Liabilities Principal Repayment | $0 | $0 | $0 |
| Long-term Liabilities Principal Repayment | $35,628 | $35,628 | $35,628 |
| Purchase Other Current Assets | $0 | $0 | $0 |
| Purchase Long-term Assets | $0 | $0 | $0 |
| Dividends | $0 | $0 | $0 |
| Subtotal Cash Spent | $409,241 | $638,876 | $697,127 |
| Net Cash Flow | $105,537 | $11,274 | ($227) |
| Cash Balance | $174,037 | $185,311 | $185,084 |
8.5 Projected Balance Sheet
The projections in the balance sheet are quite solid. We do not anticipate any trouble meeting our debt obligations as long as we follow through with the plans and strategies set forth in this business plan.
| Pro Forma Balance Sheet | |||
| Year 1 | Year 2 | Year 3 | |
| Assets | |||
| Current Assets | |||
| Cash | $174,037 | $185,311 | $185,084 |
| Inventory | $22,460 | $28,429 | $30,475 |
| Other Current Assets | $0 | $0 | $0 |
| Total Current Assets | $196,498 | $213,740 | $215,559 |
| Long-term Assets | |||
| Long-term Assets | $7,500 | $7,500 | $7,500 |
| Accumulated Depreciation | $0 | $0 | $0 |
| Total Long-term Assets | $7,500 | $7,500 | $7,500 |
| Total Assets | $203,998 | $221,240 | $223,059 |
| Liabilities and Capital | Year 1 | Year 2 | Year 3 |
| Current Liabilities | |||
| Accounts Payable | $21,374 | $38,769 | $40,646 |
| Current Borrowing | $0 | $0 | $0 |
| Other Current Liabilities | $0 | $0 | $0 |
| Subtotal Current Liabilities | $21,374 | $38,769 | $40,646 |
| Long-term Liabilities | $164,372 | $128,744 | $93,116 |
| Total Liabilities | $185,746 | $167,513 | $133,762 |
| Paid-in Capital | $60,000 | $60,000 | $60,000 |
| Retained Earnings | ($34,000) | ($41,748) | ($6,273) |
| Earnings | ($7,748) | $35,475 | $35,570 |
| Total Capital | $18,252 | $53,727 | $89,297 |
| Total Liabilities and Capital | $203,998 | $221,240 | $223,059 |
| Net Worth | $18,252 | $53,727 | $89,297 |
8.6 Business Ratios
The following table shows industry relevant ratios as determined by the standard industry classification index (SIC) under category 5736 – Musical Instrument Stores.
| Ratio Analysis | ||||
| Year 1 | Year 2 | Year 3 | Industry Profile | |
| Sales Growth | 0.00% | 26.30% | 7.19% | 4.64% |
| Percent of Total Assets | ||||
| Inventory | 11.01% | 12.85% | 13.66% | 37.97% |
| Other Current Assets | 0.00% | 0.00% | 0.00% | 27.27% |
| Total Current Assets | 96.32% | 96.61% | 96.64% | 79.90% |
| Long-term Assets | 3.68% | 3.39% | 3.36% | 20.10% |
| Total Assets | 100.00% | 100.00% | 100.00% | 100.00% |
| Current Liabilities | 10.48% | 17.52% | 18.22% | 38.59% |
| Long-term Liabilities | 80.58% | 58.19% | 41.74% | 14.67% |
| Total Liabilities | 91.05% | 75.72% | 59.97% | 53.26% |
| Net Worth | 8.95% | 24.28% | 40.03% | 46.74% |
| Percent of Sales | ||||
| Sales | 100.00% | 100.00% | 100.00% | 100.00% |
| Gross Margin | 49.88% | 49.77% | 49.77% | 27.24% |
| Selling, General & Administrative Expenses | 48.16% | 42.21% | 42.19% | 12.59% |
| Advertising Expenses | 5.63% | 4.92% | 4.88% | 1.79% |
| Profit Before Interest and Taxes | 0.78% | 9.26% | 8.33% | 0.84% |
| Main Ratios | ||||
| Current | 9.19 | 5.51 | 5.30 | 1.81 |
| Quick | 8.14 | 4.78 | 4.55 | 0.75 |
| Total Debt to Total Assets | 91.05% | 75.72% | 59.97% | 60.09% |
| Pre-tax Return on Net Worth | -42.45% | 94.33% | 56.91% | 2.46% |
| Pre-tax Return on Assets | -3.80% | 22.91% | 22.78% | 6.17% |
| Additional Ratios | Year 1 | Year 2 | Year 3 | |
| Net Profit Margin | -1.51% | 5.46% | 5.10% | n.a |
| Return on Equity | -42.45% | 66.03% | 39.83% | n.a |
| Activity Ratios | ||||
| Inventory Turnover | 3.82 | 12.83 | 11.89 | n.a |
| Accounts Payable Turnover | 11.74 | 12.17 | 12.17 | n.a |
| Payment Days | 27 | 23 | 29 | n.a |
| Total Asset Turnover | 2.52 | 2.94 | 3.12 | n.a |
| Debt Ratios | ||||
| Debt to Net Worth | 10.18 | 3.12 | 1.50 | n.a |
| Current Liab. to Liab. | 0.12 | 0.23 | 0.30 | n.a |
| Liquidity Ratios | ||||
| Net Working Capital | $175,124 | $174,971 | $174,913 | n.a |
| Interest Coverage | 0.34 | 6.32 | 8.05 | n.a |
| Additional Ratios | ||||
| Assets to Sales | 0.40 | 0.34 | 0.32 | n.a |
| Current Debt/Total Assets | 10% | 18% | 18% | n.a |
| Acid Test | 8.14 | 4.78 | 4.55 | n.a |
| Sales/Net Worth | 28.20 | 12.10 | 7.80 | n.a |
| Dividend Payout | 0.00 | 0.00 | 0.00 | n.a |
Appendix
| Sales Forecast | |||||||||||||
| Month 1 | Month 2 | Month 3 | Month 4 | Month 5 | Month 6 | Month 7 | Month 8 | Month 9 | Month 10 | Month 11 | Month 12 | ||
| Sales | |||||||||||||
| Guitar Sales | 0% | $7,000 | $8,500 | $10,500 | $10,500 | $12,500 | $14,500 | $17,000 | $17,500 | $22,000 | $35,000 | $22,000 | $18,000 |
| Band and Orchestral Instruments | 0% | $3,200 | $3,500 | $3,460 | $3,632 | $3,200 | $6,576 | $6,576 | $5,900 | $7,000 | $10,000 | $3,100 | $2,000 |
| Amplifiers, Keyboards etc. | 0% | $1,200 | $1,500 | $1,700 | $1,900 | $2,000 | $2,000 | $2,000 | $2,200 | $3,000 | $5,200 | $2,900 | $2,000 |
| Accessories | 0% | $9,000 | $11,004 | $11,316 | $13,464 | $13,900 | $13,500 | $18,516 | $17,590 | $20,000 | $30,000 | $22,000 | $15,984 |
| Print & DVD | 0% | $300 | $750 | $800 | $1,000 | $1,000 | $1,200 | $1,200 | $1,200 | $2,100 | $3,800 | $1,200 | $1,000 |
| Rentals | 0% | $0 | $100 | $250 | $300 | $500 | $500 | $500 | $600 | $600 | $1,000 | $400 | $200 |
| Repair Labor | 0% | $350 | $500 | $650 | $700 | $1,005 | $1,400 | $1,755 | $1,500 | $1,900 | $3,500 | $2,500 | $1,500 |
| Total Sales | $21,050 | $25,854 | $28,676 | $31,496 | $34,105 | $39,676 | $47,547 | $46,490 | $56,600 | $88,500 | $54,100 | $40,684 | |
| Direct Cost of Sales | Month 1 | Month 2 | Month 3 | Month 4 | Month 5 | Month 6 | Month 7 | Month 8 | Month 9 | Month 10 | Month 11 | Month 12 | |
| Guitar Sales | $4,200 | $5,100 | $6,300 | $6,300 | $7,500 | $8,700 | $10,200 | $10,500 | $13,200 | $21,000 | $13,200 | $10,800 | |
| Band and Orchestral Instruments | $1,600 | $1,750 | $1,730 | $1,816 | $1,600 | $3,288 | $3,288 | $2,950 | $3,500 | $5,000 | $1,550 | $1,000 | |
| Amplifiers, Keyboards etc. | $720 | $900 | $1,020 | $1,140 | $1,200 | $1,200 | $1,200 | $1,320 | $1,800 | $3,120 | $1,740 | $1,200 | |
| Accessories | $3,600 | $4,402 | $4,526 | $5,386 | $5,560 | $5,400 | $7,406 | $7,036 | $8,000 | $12,000 | $8,800 | $6,394 | |
| Print & DVD | $180 | $450 | $480 | $600 | $600 | $720 | $720 | $720 | $1,260 | $2,280 | $720 | $600 | |
| Rentals | $0 | $100 | $250 | $300 | $500 | $500 | $500 | $600 | $600 | $1,000 | $400 | $200 | |
| Repair Labor | $53 | $75 | $98 | $105 | $151 | $210 | $263 | $225 | $285 | $525 | $375 | $225 | |
| Subtotal Direct Cost of Sales | $10,353 | $12,777 | $14,404 | $15,647 | $17,111 | $20,018 | $23,578 | $23,351 | $28,645 | $44,925 | $26,785 | $20,419 | |
| Personnel Plan | |||||||||||||
| Month 1 | Month 2 | Month 3 | Month 4 | Month 5 | Month 6 | Month 7 | Month 8 | Month 9 | Month 10 | Month 11 | Month 12 | ||
| Dave Moore | 0% | $2,500 | $2,500 | $2,500 | $2,500 | $2,500 | $2,500 | $2,500 | $2,500 | $2,500 | $3,500 | $2,500 | $2,500 |
| Kayle Moore | 0% | $2,500 | $2,500 | $2,500 | $2,500 | $2,500 | $2,500 | $2,500 | $2,500 | $2,500 | $3,500 | $2,500 | $2,500 |
| C. Ray Himes | 0% | $2,200 | $2,200 | $2,200 | $2,200 | $2,200 | $2,200 | $2,200 | $2,200 | $2,200 | $2,200 | $2,200 | $2,200 |
| Full-time Employee #1 | 0% | $1,700 | $1,700 | $1,700 | $1,700 | $1,700 | $1,700 | $1,700 | $1,700 | $1,700 | $1,700 | $1,700 | $1,700 |
| Full-time Employee #2 | 0% | $1,700 | $1,700 | $1,700 | $1,700 | $1,700 | $1,700 | $1,700 | $1,700 | $1,700 | $1,700 | $1,700 | $1,700 |
| Part-time Employee #1 | 0% | $450 | $450 | $450 | $450 | $450 | $450 | $450 | $550 | $750 | $950 | $750 | $450 |
| Part-time Employee #2 | 0% | $450 | $450 | $450 | $450 | $450 | $450 | $450 | $550 | $750 | $950 | $750 | $450 |
| Seasonal Employee #1 | 0% | $0 | $0 | $0 | $0 | $0 | $0 | $0 | $0 | $700 | $700 | $350 | $0 |
| Total People | 7 | 7 | 7 | 7 | 7 | 7 | 7 | 7 | 8 | 8 | 8 | 7 | |
| Total Payroll | $11,500 | $11,500 | $11,500 | $11,500 | $11,500 | $11,500 | $11,500 | $11,700 | $12,800 | $15,200 | $12,450 | $11,500 | |
| General Assumptions | |||||||||||||
| Month 1 | Month 2 | Month 3 | Month 4 | Month 5 | Month 6 | Month 7 | Month 8 | Month 9 | Month 10 | Month 11 | Month 12 | ||
| Plan Month | 1 | 2 | 3 | 4 | 5 | 6 | 7 | 8 | 9 | 10 | 11 | 12 | |
| Current Interest Rate | 6.50% | 6.50% | 6.50% | 6.50% | 6.50% | 6.50% | 6.50% | 6.50% | 6.50% | 6.50% | 6.50% | 6.50% | |
| Long-term Interest Rate | 6.50% | 6.50% | 6.50% | 6.50% | 6.50% | 6.50% | 6.50% | 6.50% | 6.50% | 6.50% | 6.50% | 6.50% | |
| Tax Rate | 30.00% | 30.00% | 30.00% | 30.00% | 30.00% | 30.00% | 30.00% | 30.00% | 30.00% | 30.00% | 30.00% | 30.00% | |
| Other | 0 | 0 | 0 | 0 | 0 | 0 | 0 | 0 | 0 | 0 | 0 | 0 | |
| Pro Forma Profit and Loss | |||||||||||||
| Month 1 | Month 2 | Month 3 | Month 4 | Month 5 | Month 6 | Month 7 | Month 8 | Month 9 | Month 10 | Month 11 | Month 12 | ||
| Sales | $21,050 | $25,854 | $28,676 | $31,496 | $34,105 | $39,676 | $47,547 | $46,490 | $56,600 | $88,500 | $54,100 | $40,684 | |
| Direct Cost of Sales | $10,353 | $12,777 | $14,404 | $15,647 | $17,111 | $20,018 | $23,578 | $23,351 | $28,645 | $44,925 | $26,785 | $20,419 | |
| Other Production Expenses | $0 | $0 | $0 | $0 | $0 | $0 | $0 | $0 | $0 | $0 | $0 | $0 | |
| Total Cost of Sales | $10,353 | $12,777 | $14,404 | $15,647 | $17,111 | $20,018 | $23,578 | $23,351 | $28,645 | $44,925 | $26,785 | $20,419 | |
| Gross Margin | $10,698 | $13,077 | $14,272 | $15,849 | $16,994 | $19,658 | $23,969 | $23,139 | $27,955 | $43,575 | $27,315 | $20,265 | |
| Gross Margin % | 50.82% | 50.58% | 49.77% | 50.32% | 49.83% | 49.55% | 50.41% | 49.77% | 49.39% | 49.24% | 50.49% | 49.81% | |
| Expenses | |||||||||||||
| Payroll | $11,500 | $11,500 | $11,500 | $11,500 | $11,500 | $11,500 | $11,500 | $11,700 | $12,800 | $15,200 | $12,450 | $11,500 | |
| Sales and Marketing and Other Expenses | $6,400 | $3,400 | $3,400 | $3,400 | $5,900 | $3,400 | $3,400 | $2,400 | $4,500 | $5,700 | $5,900 | $3,400 | |
| Depreciation | $0 | $0 | $0 | $0 | $0 | $0 | $0 | $0 | $0 | $0 | $0 | $0 | |
| Acountant Expense | $800 | $400 | $400 | $400 | $400 | $400 | $400 | $400 | $400 | $400 | $400 | $400 | |
| Utilities | $1,040 | $1,040 | $1,130 | $1,380 | $1,790 | $1,460 | $1,370 | $1,460 | $1,760 | $2,210 | $1,400 | $1,080 | |
| Insurance | $400 | $400 | $400 | $400 | $400 | $400 | $400 | $400 | $400 | $400 | $400 | $400 | |
| Rent | $2,500 | $2,500 | $2,500 | $2,500 | $2,500 | $2,500 | $2,500 | $2,500 | $2,500 | $2,500 | $2,500 | $2,500 | |
| Payroll Taxes | 15% | $0 | $0 | $0 | $0 | $0 | $0 | $0 | $0 | $0 | $0 | $0 | $0 |
| Website Maintenance | $25 | $25 | $25 | $25 | $25 | $25 | $25 | $25 | $25 | $25 | $25 | $25 | |
| Total Operating Expenses | $22,665 | $19,265 | $19,355 | $19,605 | $22,515 | $19,685 | $19,595 | $18,885 | $22,385 | $26,435 | $23,075 | $19,305 | |
| Profit Before Interest and Taxes | ($11,968) | ($6,188) | ($5,083) | ($3,756) | ($5,521) | ($27) | $4,374 | $4,254 | $5,570 | $17,140 | $4,240 | $960 | |
| EBITDA | ($11,968) | ($6,188) | ($5,083) | ($3,756) | ($5,521) | ($27) | $4,374 | $4,254 | $5,570 | $17,140 | $4,240 | $960 | |
| Interest Expense | $1,067 | $1,051 | $1,035 | $1,019 | $1,003 | $987 | $971 | $955 | $939 | $923 | $906 | $890 | |
| Taxes Incurred | $0 | $0 | $0 | $0 | $0 | $0 | $0 | $0 | $0 | $0 | $0 | $0 | |
| Net Profit | ($13,035) | ($7,239) | ($6,118) | ($4,775) | ($6,524) | ($1,014) | $3,404 | $3,299 | $4,631 | $16,217 | $3,334 | $70 | |
| Net Profit/Sales | -61.92% | -28.00% | -21.33% | -15.16% | -19.13% | -2.56% | 7.16% | 7.10% | 8.18% | 18.32% | 6.16% | 0.17% | |
| Pro Forma Cash Flow | |||||||||||||
| Month 1 | Month 2 | Month 3 | Month 4 | Month 5 | Month 6 | Month 7 | Month 8 | Month 9 | Month 10 | Month 11 | Month 12 | ||
| Cash Received | |||||||||||||
| Cash from Operations | |||||||||||||
| Cash Sales | $21,050 | $25,854 | $28,676 | $31,496 | $34,105 | $39,676 | $47,547 | $46,490 | $56,600 | $88,500 | $54,100 | $40,684 | |
| Subtotal Cash from Operations | $21,050 | $25,854 | $28,676 | $31,496 | $34,105 | $39,676 | $47,547 | $46,490 | $56,600 | $88,500 | $54,100 | $40,684 | |
| Additional Cash Received | |||||||||||||
| Sales Tax, VAT, HST/GST Received | 0.00% | $0 | $0 | $0 | $0 | $0 | $0 | $0 | $0 | $0 | $0 | $0 | $0 |
| New Current Borrowing | $0 | $0 | $0 | $0 | $0 | $0 | $0 | $0 | $0 | $0 | $0 | $0 | |
| New Other Liabilities (interest-free) | $0 | $0 | $0 | $0 | $0 | $0 | $0 | $0 | $0 | $0 | $0 | $0 | |
| New Long-term Liabilities | $0 | $0 | $0 | $0 | $0 | $0 | $0 | $0 | $0 | $0 | $0 | $0 | |
| Sales of Other Current Assets | $0 | $0 | $0 | $0 | $0 | $0 | $0 | $0 | $0 | $0 | $0 | $0 | |
| Sales of Long-term Assets | $0 | $0 | $0 | $0 | $0 | $0 | $0 | $0 | $0 | $0 | $0 | $0 | |
| New Investment Received | $0 | $0 | $0 | $0 | $0 | $0 | $0 | $0 | $0 | $0 | $0 | $0 | |
| Subtotal Cash Received | $21,050 | $25,854 | $28,676 | $31,496 | $34,105 | $39,676 | $47,547 | $46,490 | $56,600 | $88,500 | $54,100 | $40,684 | |
| Expenditures | Month 1 | Month 2 | Month 3 | Month 4 | Month 5 | Month 6 | Month 7 | Month 8 | Month 9 | Month 10 | Month 11 | Month 12 | |
| Expenditures from Operations | |||||||||||||
| Cash Spending | $11,500 | $11,500 | $11,500 | $11,500 | $11,500 | $11,500 | $11,500 | $11,700 | $12,800 | $15,200 | $12,450 | $11,500 | |
| Bill Payments | $408 | $12,118 | $8,819 | $8,898 | $9,220 | $11,923 | $9,168 | $9,466 | $21,860 | $45,992 | $73,103 | $18,487 | |
| Subtotal Spent on Operations | $11,908 | $23,618 | $20,319 | $20,398 | $20,720 | $23,423 | $20,668 | $21,166 | $34,660 | $61,192 | $85,553 | $29,987 | |
| Additional Cash Spent | |||||||||||||
| Sales Tax, VAT, HST/GST Paid Out | $0 | $0 | $0 | $0 | $0 | $0 | $0 | $0 | $0 | $0 | $0 | $0 | |
| Principal Repayment of Current Borrowing | $0 | $0 | $0 | $0 | $0 | $0 | $0 | $0 | $0 | $0 | $0 | $0 | |
| Other Liabilities Principal Repayment | $0 | $0 | $0 | $0 | $0 | $0 | $0 | $0 | $0 | $0 | $0 | $0 | |
| Long-term Liabilities Principal Repayment | $2,969 | $2,969 | $2,969 | $2,969 | $2,969 | $2,969 | $2,969 | $2,969 | $2,969 | $2,969 | $2,969 | $2,969 | |
| Purchase Other Current Assets | $0 | $0 | $0 | $0 | $0 | $0 | $0 | $0 | $0 | $0 | $0 | $0 | |
| Purchase Long-term Assets | $0 | $0 | $0 | $0 | $0 | $0 | $0 | $0 | $0 | $0 | $0 | $0 | |
| Dividends | $0 | $0 | $0 | $0 | $0 | $0 | $0 | $0 | $0 | $0 | $0 | $0 | |
| Subtotal Cash Spent | $14,877 | $26,587 | $23,288 | $23,367 | $23,689 | $26,392 | $23,637 | $24,135 | $37,629 | $64,161 | $88,522 | $32,956 | |
| Net Cash Flow | $6,173 | ($733) | $5,388 | $8,129 | $10,416 | $13,284 | $23,910 | $22,355 | $18,971 | $24,339 | ($34,422) | $7,728 | |
| Cash Balance | $74,673 | $73,940 | $79,328 | $87,457 | $97,873 | $111,157 | $135,067 | $157,422 | $176,392 | $200,732 | $166,310 | $174,037 | |
| Pro Forma Balance Sheet | |||||||||||||
| Month 1 | Month 2 | Month 3 | Month 4 | Month 5 | Month 6 | Month 7 | Month 8 | Month 9 | Month 10 | Month 11 | Month 12 | ||
| Assets | Starting Balances | ||||||||||||
| Current Assets | |||||||||||||
| Cash | $68,500 | $74,673 | $73,940 | $79,328 | $87,457 | $97,873 | $111,157 | $135,067 | $157,422 | $176,392 | $200,732 | $166,310 | $174,037 |
| Inventory | $150,000 | $139,648 | $126,871 | $112,467 | $96,820 | $79,710 | $59,692 | $36,114 | $25,686 | $31,510 | $49,418 | $29,464 | $22,460 |
| Other Current Assets | $0 | $0 | $0 | $0 | $0 | $0 | $0 | $0 | $0 | $0 | $0 | $0 | $0 |
| Total Current Assets | $218,500 | $214,321 | $200,811 | $191,795 | $184,278 | $177,583 | $170,848 | $171,181 | $183,108 | $207,902 | $250,149 | $195,773 | $196,498 |
| Long-term Assets | |||||||||||||
| Long-term Assets | $7,500 | $7,500 | $7,500 | $7,500 | $7,500 | $7,500 | $7,500 | $7,500 | $7,500 | $7,500 | $7,500 | $7,500 | $7,500 |
| Accumulated Depreciation | $0 | $0 | $0 | $0 | $0 | $0 | $0 | $0 | $0 | $0 | $0 | $0 | $0 |
| Total Long-term Assets | $7,500 | $7,500 | $7,500 | $7,500 | $7,500 | $7,500 | $7,500 | $7,500 | $7,500 | $7,500 | $7,500 | $7,500 | $7,500 |
| Total Assets | $226,000 | $221,821 | $208,311 | $199,295 | $191,778 | $185,083 | $178,348 | $178,681 | $190,608 | $215,402 | $257,649 | $203,273 | $203,998 |
| Liabilities and Capital | Month 1 | Month 2 | Month 3 | Month 4 | Month 5 | Month 6 | Month 7 | Month 8 | Month 9 | Month 10 | Month 11 | Month 12 | |
| Current Liabilities | |||||||||||||
| Accounts Payable | $0 | $11,825 | $8,522 | $8,594 | $8,820 | $11,617 | $8,866 | $8,764 | $20,361 | $43,492 | $72,491 | $17,750 | $21,374 |
| Current Borrowing | $0 | $0 | $0 | $0 | $0 | $0 | $0 | $0 | $0 | $0 | $0 | $0 | $0 |
| Other Current Liabilities | $0 | $0 | $0 | $0 | $0 | $0 | $0 | $0 | $0 | $0 | $0 | $0 | $0 |
| Subtotal Current Liabilities | $0 | $11,825 | $8,522 | $8,594 | $8,820 | $11,617 | $8,866 | $8,764 | $20,361 | $43,492 | $72,491 | $17,750 | $21,374 |
| Long-term Liabilities | $200,000 | $197,031 | $194,062 | $191,093 | $188,124 | $185,155 | $182,186 | $179,217 | $176,248 | $173,279 | $170,310 | $167,341 | $164,372 |
| Total Liabilities | $200,000 | $208,856 | $202,584 | $199,687 | $196,944 | $196,772 | $191,052 | $187,981 | $196,609 | $216,771 | $242,801 | $185,091 | $185,746 |
| Paid-in Capital | $60,000 | $60,000 | $60,000 | $60,000 | $60,000 | $60,000 | $60,000 | $60,000 | $60,000 | $60,000 | $60,000 | $60,000 | $60,000 |
| Retained Earnings | ($34,000) | ($34,000) | ($34,000) | ($34,000) | ($34,000) | ($34,000) | ($34,000) | ($34,000) | ($34,000) | ($34,000) | ($34,000) | ($34,000) | ($34,000) |
| Earnings | $0 | ($13,035) | ($20,274) | ($26,392) | ($31,166) | ($37,690) | ($38,704) | ($35,300) | ($32,001) | ($27,369) | ($11,152) | ($7,818) | ($7,748) |
| Total Capital | $26,000 | $12,965 | $5,726 | ($392) | ($5,166) | ($11,690) | ($12,704) | ($9,300) | ($6,001) | ($1,369) | $14,848 | $18,182 | $18,252 |
| Total Liabilities and Capital | $226,000 | $221,821 | $208,311 | $199,295 | $191,778 | $185,083 | $178,348 | $178,681 | $190,608 | $215,402 | $257,649 | $203,273 | $203,998 |
| Net Worth | $26,000 | $12,965 | $5,726 | ($392) | ($5,166) | ($11,690) | ($12,704) | ($9,300) | ($6,001) | ($1,369) | $14,848 | $18,182 | $18,252 |


