
Mt. Hood Records
Executive Summary
Mt. Hood Records is an unusual but sustainable business model for a record label. The company has been founded by Hillary MacQuilliams as an Oregon registered LLC. The business operates to promote several Portland based bands, all with the common element of improvisation.
Industry Analysis
The retail record industry is dominated by a few large corporations. These corporations control over 87% of the CD sales in this country. 8% of the sales are controlled by Indie record labels, a less commercial version of the large corporations. The remaining 5% is a hodge podge of record labels. Most labels take the shot gun approach to sales. They sign up lots of different bands and hope a few make it big. On the bands that are a commercial success, there are huge windfalls of profit to be made by the record corporations. The Indie labels are similar, however, they are a bit more selective and do not always go for the most commercially viable bands.
Products and Services
Mt. Hood Records is a Portland based record label for a select group of Portland based bands. Mt. Hood Records has adopted the business philosophy that for long term sustainable growth it will be more successful for the label to sign up just a few bands and promote them equally than to sign up a bunch and hope one is a commercial success, enough to float the rest of the bands. This approach is quite appealing to a few bands. It provides the bands with the intimate and specialized focus of the label. The bands recognizes that fact that this label will be working hard to promote just a few bands, and that they will not be lost in the shuffle.
The Business Model
In order for this record label to succeed, a lot of sweat equity will be required will little to no revenue stream for the first year. For many businesses this is quite difficult to swallow. For Mt. Hood Records it helps that these realistic expectations have been established up front, and will not be an unwelcome future surprise. Additionally, the investors (friends and family) are aware of these parameters and have given their blessing. It will take a lot of work to pull this off, but with reasonable expectation up front and the right management to execute on the business model, it will happen.
Management
Mt. Hood Records has been founded and will be run by Hillary MacQuilliams. Hillary is a veteran of the music industry. Immediately after college Hillary went on tour with her own band 180 South. To support this month-long regional tour, Hillary and the band started their own record label to release a studio CD for themselves. Hillary recognizes that this experience was not an earnest attempt to make a record label work. It was more of a novelty to have started a label and released their own CD.
After the tour the band broke up and Hillary enrolled into law school. At graduation, law jobs were extremely difficult to come by. After no luck in her job search, Hillary began to consider something in the music industry because of her passion for music. She began doing research and developed a business model that could, in the long term, be sustainable by developing a local, exclusive record label. This was the beginning of Mt. Hood Records.
1.1 Objectives
- To become the premier local music label, based on CD sales, within three years.
- Sign at least five groups within the first three years.
- Reach profitability within three years.
1.2 Mission
Mt. Hood Records exists as a locally based record label whose mission is to promote local music groups, increasing live appearances and record sales. Mt. Hood Records has been established to promote its bands and at the same time make a fair profit.
1.3 Keys to Success
- Choose promising bands to promote.
- Do not sign up too many bands, otherwise the effectiveness of promotion will be diluted.
- Work hard and have fun.
Company Summary
Mt. Hood Records is a start-up organization that has been founded as an Oregon based L.L.C. The founder is Hillary MacQuilliams. The company was founded in January 2003.
2.1 Company Ownership
The company has been founded and is primarily owned by Hillary MacQuilliams. Hillary has invested personal funds in the business and will seek additional investment money from friends and family.
2.2 Start-up Summary
Mt. Hood Records will purchase the following equipment needed for the start up phase of the business:
- Laptop computer
- Various printed material
Mt. Hood Records will initially be located in Hillary’s home. For years two and three a small space will be used primarily for inventory management and sales operations.
Mt. Hood Records will be operating on no revenue for the first year with low overhead. Mt. Hood Records will rely on the owner’s investment and money from friends and family. It will be too difficult to secure bank debt due to the long period of time before revenue.
Hillary will not take a salary for the first two years. This becomes less important since she will not be securing unfamiliar investors or bank debt which typically want the principal to draw a salary. For the first year Hilary will be making investments of sweat equity.
| Start-up | |
| Requirements | |
| Start-up Expenses | |
| Legal | $0 |
| Stationery etc. | $0 |
| Brochures | $500 |
| Website development | $6,000 |
| Insurance | $0 |
| Rent | $150 |
| Research and Development | $0 |
| Expensed Equipment | $0 |
| Other | $0 |
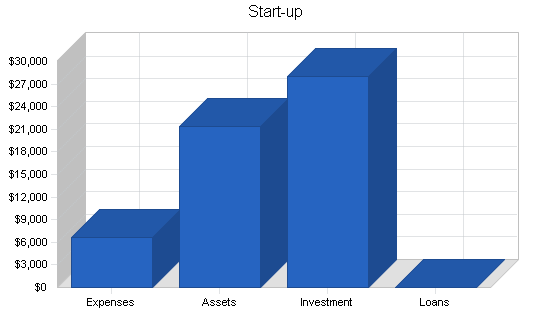
| Total Start-up Expenses | $6,650 |
| Start-up Assets | |
| Cash Required | $19,350 |
| Start-up Inventory | $0 |
| Other Current Assets | $0 |
| Long-term Assets | $2,000 |
| Total Assets | $21,350 |
| Total Requirements | $28,000 |
| Start-up Funding | |
| Start-up Expenses to Fund | $6,650 |
| Start-up Assets to Fund | $21,350 |
| Total Funding Required | $28,000 |
| Assets | |
| Non-cash Assets from Start-up | $2,000 |
| Cash Requirements from Start-up | $19,350 |
| Additional Cash Raised | $0 |
| Cash Balance on Starting Date | $19,350 |
| Total Assets | $21,350 |
| Liabilities and Capital | |
| Liabilities | |
| Current Borrowing | $0 |
| Long-term Liabilities | $0 |
| Accounts Payable (Outstanding Bills) | $0 |
| Other Current Liabilities (interest-free) | $0 |
| Total Liabilities | $0 |
| Capital | |
| Planned Investment | |
| Hillary MacQuilliams | $10,000 |
| Family and Friends | $18,000 |
| Other | $0 |
| Additional Investment Requirement | $0 |
| Total Planned Investment | $28,000 |
| Loss at Start-up (Start-up Expenses) | ($6,650) |
| Total Capital | $21,350 |
| Total Capital and Liabilities | $21,350 |
| Total Funding | $28,000 |
Products and Services
Mt. Hood Records is a new, Portland, Oregon based record label. Mt. Hood Records is taking a new, unusual approach to band promotion and CD sales. Instead of competing with the large, ultra competitive national record labels, as well with the larger Indie labels, Mt. Hood Records will adopt a regional, intimate approach where they concentrate on several local bands. By working with only a few bands at once, Mt. Hood Records is able to offer a much more specialized and attentive level of service for their bands. This will be their competitive edge, something no other record label can offer.
Operations will begin with the production of a compilation CD. This will be a CD that features many different local artists. Their will be no charge for a band to place a single on the CD, in fact they are encouraged as it offers an visibility outlet for the band. This favors bands that are trying to gain visibility within the local market. They are interested in having as many people become familiar with them, since as more people know about them, they are likely to secure live gigs and possibly produce a CD and receive revenue from CD sales. Within the first year two compilation CDs will be produced. These will be free for the bands to be on and there will be free distribution of the CDs. Enough expectation and anticipation for the up and coming bands will allow Mt. Hood Records to soon begin to charge for releases.

At the same time that the CDs provide visibility for the respective bands, it provides visibility for Mt. Hood Records. This is key for Mt. Hood Records’ business model. They need to be known as a hard working/promoting record label. This is important because the stronger the label appears, the more attractive the label becomes in terms of being an exclusive promoter for a band.
While the compilations CDs are released, Mt. Hood Records will be working with a variety of parties for networking purposes. The first is local radio stations. Being able to get air play for the CD depends on relationships with the key decision makers at the various stations. Mt. Hood Records will also be working with various record stores, developing relationships with them so that as some of the bands on the CDs become known and there is consumer interest, Mt. Hood Records can begin to sell the CDs. Lastly, Mt. Hood Records will be working with the different clubs to get the bands live gigs. Playing live to local crowds will be one of the most productive activities in terms of developing fanfare.
As the label becomes well known locally, it will become attractive for local acts looking to sign up with a record label. Mt. Hood Records will be looking to sign up a total of no more than five bands at any one time. This will allow Mt. Hood Records to offer specialized and intimate promotional assistance.
As the bands begin to sign on, the next tasks are to assist in the production of a studio CD for the band. Once the CD is cut key activities will be aimed at record sales and live show production. These are key activities as these are the sources of revenue for Mt. Hood Records, CD sales which occur at record stores as well as at the live shows.
Mt. Hood Records business model recognizes that there will be little to no revenue within the first year. First year revenue is being sacrificed for the building of a viable record label in future years.
Mt. Hood Records will not focus on a specific genre of music; that is difficult to do on a regional basis. It also creates competition at the local level between the bands within the same genre. Instead, Mt. Hood Records will focus on the element of improvisation which can be found in a wide range of genres. Improvisation can be described as adding free flow change or spontaneity to a performance. This occurs when a band is playing a pre-defined song, but certain or each member of the band deviates from the song, playing their own solo or rendition of the material. This occurs in the moment, in a spontaneous experimentation. This lends it elf to viewing a band’s performance multiple times, as no performance is the same. Improvisation also lets the musicians “shine,” it allows them to try new things, play around, have fun, and entertain the audience.
Market Analysis Summary
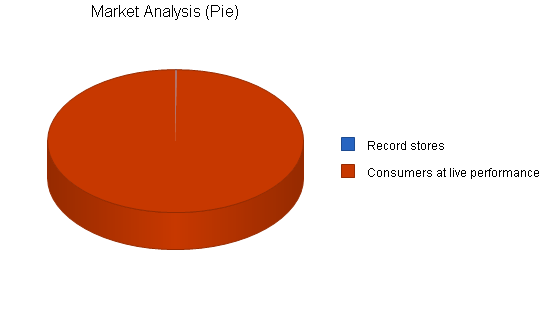
Mt. Hood Records will target two primary market segments, record stores and consumers at live shows. These will be the sources of income so they will be the main targets. Initially, Mt. Hood Records focus will be to develop visibility within the community, enough to be able to sign up bands which are the key to revenue generation. The need to sign up bands will drive the marketing activities that Mt. Hood Records will undertake in order to generate revenue in the future.
4.1 Market Segmentation
Mt. Hood Records has identified two target market segments which will be the main targeted customers.
- Record retailers– This segment sells CDs to the end consumers. This is the retail channel that typically moves the greatest quantity of CDs. The ability of the record stores to move decent quantity takes time, it does not occur initially. The bands must develop a name for themselves, through the compilation CD release as well as through live performances in order for the record stores to be willing to sell their material. This customer segment will be used to sell the compilation CD and band CDs eventually, although not initially.
- Consumers at live concerts– This segment attends live music performances, typically at the local level. While at the show, enjoying the music, they often purchase a CD of the band that they are currently viewing. This is, more often than not, an impulse purchase. They hear the music, they are impressed and they decide they would like more material from the band. Additionally, the patrons will also purchase the compilation CD as a means of hearing new music.
| Market Analysis | |||||||
| Year 1 | Year 2 | Year 3 | Year 4 | Year 5 | |||
| Potential Customers | Growth | CAGR | |||||
| Record stores | 5% | 23 | 24 | 25 | 26 | 27 | 4.09% |
| Consumers at live performances | 7% | 18,776 | 20,090 | 21,496 | 23,001 | 24,611 | 7.00% |
| Total | 7.00% | 18,799 | 20,114 | 21,521 | 23,027 | 24,638 | 7.00% |
4.2 Target Market Segment Strategy
Mt. Hood Records has chosen these two distinct market segments because they are the main source of revenue. Mt. Hood Records will remain focused on their important marketing activities aimed at developing visibility for the record label, however, ultimately it comes down to CD sales for business viability and the record stores and consumers at live performances being the source of this revenue. This is a fairly intimate industry, most of the industry participants within a region know each other. Keeping this in mind, networking will be the most efficient and effective activity. The only way to get into record stores is by showing potential record sales. The way you begin to do this is to have good contacts within the stores to get the right people to listen to you.
Another source of revenue will be the buy out of a band from their Mt. Hood contract in favor of a larger, national label. These events will not be marketed for, they will tend to occur on their own. This source of revenue is, however, tracked in the sales forecasts.
4.3 Service Business Analysis
In general, the record industry, at least when based on overall sales, is a highly concentrated national industry. There are several huge international corporations that control the bulk of record sales. For bands looking to break through into national stardom and significant record sales, this is the distribution/promotion channel that they must concentrate on.
There are also the “Indie” labels which are broader than regional companies, but do not have the same breadth as a national player. The Indie labels can be quite large, they just tend to do business in less commercial ways. Many Indie labels can support national acts who are professional musicians.
The last segment of the market are local record labels who typically support musicians who are not professional in the sense that they typically have day jobs that occupy their time in addition to the musical interests. Most of the regional labels must concentrate on a region that encompasses at least one state, often two or more. There are very few labels that will only concentrate on a specific city such as Mt. Hood Records in Portland, it is often too difficult to concentrate on such a small audience. It is certainly a viable business model, you just need to be strategically focused to pull it off.
4.3.1 Competition and Buying Patterns
- National record labels– Atlantic, Sony, BMG labels, etc. These distributors care about one thing, CD sales. The more CDs they sell, the more money they make. Bands do not get much individual attention. They are carefully trained to develop mass appeal. Commercialization is key. These companies’ mantra is widespread acceptance, not niche fringes.
- Indie labels– Sub Pop, Ropeadope, Ozone, etc. These companies are also quite concerned about CD sales, however they tend to choose bands with less commercial appeal and exploit whatever niche that band exists in. This competitor also faces the pitfalls of not being able to offer specialized attention as their “reach” is also quite broad. They are basically a smaller, better behaved version of the large record labels. They are only concerned ultimately with CD sales, and achieve these goals with less commercial means.
- Regional labels– This is almost a catch all gathering of labels, with so many different types participating in the space. Some labels are similar to Mt. Hood Records (not in Portland or Seattle however) where CD sales are key, but are looked at more holistically so that a band’s health and popularity is concentrated on, recognizing that if this is addressed, CD sales will fall into place. There are also many different types of labels that represent a large number of bands within an area, not having the same reach as the larger companies, and not caring much about the bands themselves, just like the larger labels.
Strategy and Implementation Summary
Mt. Hood Records will leverage their competitive edge of low overhead and low band count ensuring intimate specialized care and promotion for the lucky few bands that it represents. Mt. Hood Records will employ a marketing strategy that concentrates on developing a large web of networks to assist the visibility of their label as well as developing visibility for the bands it represents. Mt. Hood Records will be extremely active in the local music scene as an effective way of plugging their bands. Lastly, Mt. Hood Records will have an aggressive sales strategy with the goal of getting as many record stores as possible to assist with sales of the various CDs as well as having a heavy live gig schedule as another outlet for CD sales.
5.1 Competitive Edge
Mt. Hood Records will employ a two pronged competitive edge. The first edge prong is having low overhead. Mt. Hood Records’ office will be in Hillary’s home. There is not an immediate need for offices, as all work can be transacted from her home office. Additionally, unlike many record labels, there will not be a recording studio to support. Significant costs are saved by renting studio time as needed. There appears to be no time in the foreseeable future that would dictate the need for a dedicated studio.
Mt. Hood Records will also use their other competitive edge prong by retaining a low band count. Mt. Hood Records will have five or less bands under contract at once. While this will reduce the chance of large records sales associated with having many different bands under their label, it does allow Mt. Hood Records to offer the bands it represents very specialized and intimate care. This is quite unusual in the industry. Most record labels have many different bands under contract; that is the nature of the industry. It is very difficult for a band to pick up a contract that differs from this arrangement.
Mt. Hood Records recognizes the opportunity to get away from the status quo and operate under the business philosophy that specialized customer care and attention is the best way to make money in the long term. Unless you have tons of marketing money volume is not the way to make sustainable profits. Each of Mt. Hood Records’ bands therefore receive far better plugging and placement. Anytime Mt. Hood Records is in a networking activity, they can plug all of their bands at once due to the small number.
This approach to specialized care can be seen in the athlete representation field. Two current great cyclists have adopted the approach, bucking the same trend within the athlete representation industry. Both Lance Armstrong and Kevin Livingston have both chosen contract representatives that only represent a couple of athletes instead of the norm by choosing a large company that has many different athletes in many sports represented at once. They have chosen this arrangement recognizing the more intimate care that they receive.
5.2 Marketing Strategy
Mt. Hood Records’ marketing strategy recognizes the fact that the value in the label is intrinsically based on their reputation within the music community. Mt Hood Records needs to be known as a premier label, creating a compelling reason for bands to sign up with them.
Mt. Hood Records will develop their industry visibility through the release of the various compilation CDs. The goal of these CDs is to get the word out about Mt. Hood Records. This will assist in securing their initial bands. This will be done through aggressive networking. Mt. Hood Records will be in close contact to who’s who in the Portland music scene, for both retail recordings as well as within the live music scene.
Once a few bands have been secured, it then becomes Mt. Hood Records’ marketing strategy to plug the bands as much as possible. This again will be done by leveraging all of their networking contacts. One effective way that Mt. Hood Records will be marketing their bands is to line up as many live shows as possible. For a local scene, it is very important for the bands to be performing quite often, this is the fastest way that demand is generated within a specific community regarding a band. Once the shows have been lined up, Mt. Hood Records will almost always man a booth where the concert goers can buy CDs, learn more about the performing band, as well as providing more information about the other bands that they represent. While this takes time and effort, it is this passionate effort that will assist Mt. Hood Records in becoming a viable label, not immediately, but over time and hard work.
Other activities, as intuitive as they may seem are (not an exhaustive list):
- calling up newspapers and inviting them to sessions, basically letting them know what is going on
- submit press releases
- find good story angles for the print media
- list every show played by the bands
- coddle the radio stations
- develop press kits
- get professional quality photos.
5.3 Sales Strategy
Mt. Hood Records’ sales strategy will focus on the two main sources of revenue: record retailers and consumers at shows. Mt. Hood Records will be in constant communication, always attempting to negotiate agreements for record sales with retailers. Because Mt. Hood Records is small in terms of the bands that they represent, they are able to offer retailers an unusual arrangement where unsold CDs can be returned for credit. This is quite similar to the magazine industry where retailers of magazines can get credit for unsold issues. This is a great idea but is not practiced with the CD retailing industry. This advantage will make is easier for Mt. Hood Records to get into various retailers, an otherwise difficult proposition due to the extraordinary power and influence of the major record labels. In essence is creates a risk free value proposition for the retailer.
Mt. Hood Records will also address the need to sell CDs at live performances. As mentioned earlier, CDs purchased at shows are, more often than not, impulse purchases. The viewer is impressed by the live performance of the band and in a show of support or a desire to have more material from the band they buy a CD. It is likely that other bands’ CDs will be sold by leveraging the goodwill of Mt. Hood Records. Studies indicate that consumers are more likely to experiment with new bands if the bands are found on a record label that the consumer is already familiar with and has confidence in. In essence it is using the positive halo effect of the label to sell other bands the label represents. This is further reinforced by the common element of improvisation that Mt. Hood Records represents. If the customer appreciates the element of improvisation then they are much more likely to try another improvisational band, especially when it comes with a “seal of approval” from the record label.
5.3.1 Sales Forecast
Sales will be slow initially. It is forecasted that the first two compilation CDs will be handed out for free. Sales revenue is not anticipated yet. By the third compilation Mt. Hood Records will have signed two bands and this will be the beginning of revenue generating CD sales. Once bands are signed, Mt. Hood Records’ legitimacy will be developed and they will be able to begin to generate revenue both on band CDs as well as the compilations.
Sales will also be generated through online website CD sales. Margins for the online sales are quite good because it eliminates the retail layer of the distribution channel. This will be Mt. Hood Records attempt to capture revenue from the powerful Internet sales channel.
An additional source of revenue is contract buyout. At some point there is the possibility that one or two of the bands will receive an offer from a larger record label for national distribution. In all of the band’s contracts there will be a buy out clause that will allow a larger label to buy out the contract. This is in recognition that Mt. Hood Records has limited distribution and if a band does indeed “make it” they will need to move onto a new label that has an established distribution system. Having this clause and the phenomenon of a band or two moving on is of value to Mt. Hood Records because it allows them in turn to sign on another new band. This is not expected or desired to be a huge revenue contributor initially. While Mt. Hood Records has no desire to completely cash in on a band moving to a national audience they will certainly make some money when a contract is bought out. However, it is not their goal that all bands will move on to larger labels.
Direct cost of goods includes:
- studio time
- mastering, mixing expenses
- Intelectual property costs
- CD production (including label creation and burning and packaging of CD)
- distribution expenses.
| Sales Forecast | |||
| Year 1 | Year 2 | Year 3 | |
| Sales | |||
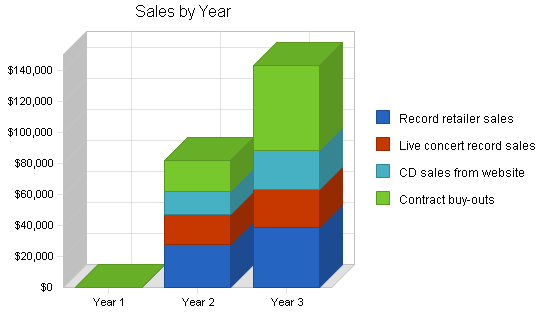
| Record retailer sales | $0 | $28,090 | $39,076 |
| Live concert record sales | $0 | $19,000 | $24,090 |
| CD sales from website | $0 | $15,070 | $25,600 |
| Contract buy-outs | $0 | $20,000 | $55,000 |
| Total Sales | $0 | $82,160 | $143,766 |
| Direct Cost of Sales | Year 1 | Year 2 | Year 3 |
| Record retailer sales | $0 | $11,236 | $15,630 |
| Live concert record sales | $0 | $6,650 | $8,432 |
| CD sales from website | $0 | $5,275 | $8,960 |
| Contract buy-outs | $0 | $0 | $0 |
| Subtotal Direct Cost of Sales | $0 | $23,161 | $33,022 |
5.4 Milestones
Several milestones have been established and will act as a set of goals and a tracking mechanism for achieving the goals. While the milestones are initially static, they can be dynamic if needed. Please see the following table for detail regarding the milestones.
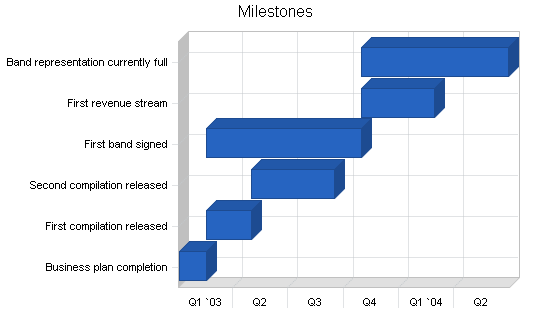
| Milestones | |||||
| Milestone | Start Date | End Date | Budget | Manager | Department |
| Business plan completion | 1/1/2003 | 2/15/2003 | $0 | Hillary | Business Development |
| First compilation released | 2/15/2003 | 5/1/2003 | $0 | Hillary | Marketing |
| Second compilation released | 5/1/2003 | 9/15/2003 | $0 | Hillary | Marketing |
| First band signed | 2/15/2003 | 10/30/2003 | $0 | Hillary | Sales |
| First revenue stream | 10/30/2003 | 2/28/2004 | $0 | Hillary | Sales |
| Band representation currently full | 10/30/2003 | 6/30/2004 | $0 | Hillary | Sales |
| Totals | $0 | ||||
Web Plan Summary
Mt. Hood Records’ website will be an excellent source of information dissemination and CD sales.
- The different bands will be listed with information about their music, bios, etc.
- Music samples of the bands will also be available. The samples will be available as streaming media as well as downloads in a compressed format.
- Touring dates will also be posted on the site encouraging people to attend the live shows.
- CDs will be sold over the website. Sales info is captured under sales forecasts. The e-commerce module to the website will be outsourced and the costs are captured within direct costs of goods sold for online sales.
6.1 Website Marketing Strategy
The site will be linked to the various Portland entertainment guides such as Willamette Weekly. Mt. Hood Records will also submit the site to several different search engines. Lastly, the URL address will be prominent on all printed material and correspondence.
6.2 Development Requirements
The site will be developed by a computer science student.
Management Summary
Hillary MacQuilliams first got her feet wet in music after college. After graduating with a Bachelor of Arts degree, Hillary and bandmates of 180 South decided to start their own record label to support a regional tour. The goal of the record label was primarily self-promotion and personal satisfaction. By creating their own label, they could release their one studio CD. They did not expect to generate profits from this, they saw it as an opportunity to support their tour with a CD. They toured for a month straight, throughout NY, PA, and NJ, playing almost every night, driving to the new venue during the day. The tour was quite an accomplishment, but it really did not make any money, just covered expenses.
Hillary then earned a J.D. degree from Lewis & Clark Law School in Portland, Oregon. During the summer of her first and second year she interned at the Department of Justice (DOJ), but was unable to find a job after graduation.
At this point she decuded that she could leverage per passion for music into a job, and once again start a record label. This time around she would be able to rely on her husband’s income for the household for the first year or two of her new business. Hillary recognized that in order to build a sustainable label she would have to forgo revenue and keep overhead low for the first year. If she could weather this financial burden she could make the business model work.
7.1 Personnel Plan
Hillary will be the primary employee. She will be working long hours, often with her husband’s help, but after some sweat equity, the business model will begin producing revenue. Hillary will not take a salary for the first two years in order to build the business. For year three she will draw a salary. Hillary will hire two other employees to assist her.
- Sales– this position will sell CDs at concerts by being present at a booth or table at the various live performances.
- Distribution– this position will be responsible for the distribution of the CD to the retailers.
| Personnel Plan | |||
| Year 1 | Year 2 | Year 3 | |
| Hillary | $0 | $0 | $30,000 |
| Sales | $0 | $12,000 | $13,000 |
| Distribution | $1,600 | $12,000 | $13,000 |
| Total People | 1 | 3 | 3 |
| Total Payroll | $1,600 | $24,000 | $56,000 |
Financial Plan
The following sections presents important financial information.
8.1 Important Assumptions
The following table lists important financial assumptions.
| General Assumptions | |||
| Year 1 | Year 2 | Year 3 | |
| Plan Month | 1 | 2 | 3 |
| Current Interest Rate | 10.00% | 10.00% | 10.00% |
| Long-term Interest Rate | 10.00% | 10.00% | 10.00% |
| Tax Rate | 30.00% | 30.00% | 30.00% |
| Other | 0 | 0 | 0 |
8.2 Break-even Analysis
The Break-even Analysis indicates what is needed in monthly revenue to break even.

| Break-even Analysis | |
| Monthly Revenue Break-even | $1,502 |
| Assumptions: | |
| Average Percent Variable Cost | 0% |
| Estimated Monthly Fixed Cost | $1,502 |
8.3 Projected Profit and Loss
The following table and charts illustrated projected profit and loss.
Explanations for some line items:
- Sales and Marketing– The compilation CDs will be used for marketing purposes. The initial goal is to develop visibility for Mt. Hood Records as a record label. This will assist in the process of introducing up and coming bands bands to Mt. Hood Records. Once the bands have been signed to exclusive contracts by Mt. Hood Records, then the signed bands will be the only bands on the compilation CDs. Mt. Hood Records has not purchased any equipment for the mixing, mastering, CD production, and artwork/barcode expenses. These activities will be outsourced to keep capital expenditures low. Expenses related to the cost of production of the compilation captured in the sales and marketing costs include:
- initial studio recording time
- mixing, mastering expenses
- CD label costs (artwork, barcode, etc.)
- Promotional CDs given out.


| Pro Forma Profit and Loss | |||
| Year 1 | Year 2 | Year 3 | |
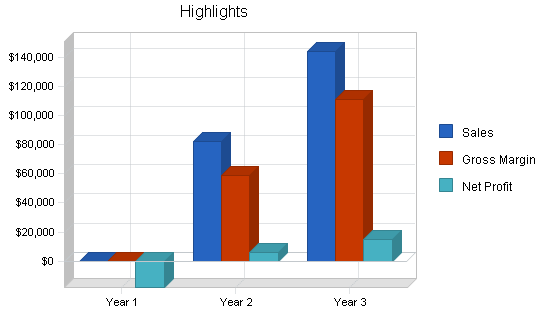
| Sales | $0 | $82,160 | $143,766 |
| Direct Cost of Sales | $0 | $23,161 | $33,022 |
| Other Costs of Goods | $0 | $0 | $0 |
| Total Cost of Sales | $0 | $23,161 | $33,022 |
| Gross Margin | $0 | $59,000 | $110,744 |
| Gross Margin % | 0.00% | 71.81% | 77.03% |
| Expenses | |||
| Payroll | $1,600 | $24,000 | $56,000 |
| Sales and Marketing and Other Expenses | $13,500 | $14,500 | $15,500 |
| Depreciation | $400 | $400 | $400 |
| Rent | $0 | $4,000 | $4,000 |
| Website expenses | $1,560 | $1,800 | $2,000 |
| Utilities | $360 | $800 | $1,000 |
| Insurance | $360 | $600 | $800 |
| Payroll Taxes | $240 | $3,600 | $8,400 |
| Returned CDs | $0 | $1,200 | $1,200 |
| Total Operating Expenses | $18,020 | $50,900 | $89,300 |
| Profit Before Interest and Taxes | ($18,020) | $8,100 | $21,444 |
| EBITDA | ($17,620) | $8,500 | $21,844 |
| Interest Expense | $0 | $0 | $0 |
| Taxes Incurred | $0 | $2,430 | $6,433 |
| Net Profit | ($18,020) | $5,670 | $15,011 |
| Net Profit/Sales | 0.00% | 6.90% | 10.44% |
8.4 Projected Cash Flow
The following chart and table show the projected cash flow.

| Pro Forma Cash Flow | |||
| Year 1 | Year 2 | Year 3 | |
| Cash Received | |||
| Cash from Operations | |||
| Cash Sales | $0 | $20,540 | $35,942 |
| Cash from Receivables | $0 | $61,620 | $107,825 |
| Subtotal Cash from Operations | $0 | $82,160 | $143,766 |
| Additional Cash Received | |||
| Sales Tax, VAT, HST/GST Received | $0 | $0 | $0 |
| New Current Borrowing | $0 | $0 | $0 |
| New Other Liabilities (interest-free) | $0 | $0 | $0 |
| New Long-term Liabilities | $0 | $0 | $0 |
| Sales of Other Current Assets | $0 | $0 | $0 |
| Sales of Long-term Assets | $0 | $0 | $0 |
| New Investment Received | $0 | $0 | $0 |
| Subtotal Cash Received | $0 | $82,160 | $143,766 |
| Expenditures | Year 1 | Year 2 | Year 3 |
| Expenditures from Operations | |||
| Cash Spending | $1,600 | $24,000 | $56,000 |
| Bill Payments | $15,595 | $48,234 | $70,690 |
| Subtotal Spent on Operations | $17,195 | $72,234 | $126,690 |
| Additional Cash Spent | |||
| Sales Tax, VAT, HST/GST Paid Out | $0 | $0 | $0 |
| Principal Repayment of Current Borrowing | $0 | $0 | $0 |
| Other Liabilities Principal Repayment | $0 | $0 | $0 |
| Long-term Liabilities Principal Repayment | $0 | $0 | $0 |
| Purchase Other Current Assets | $0 | $0 | $0 |
| Purchase Long-term Assets | $0 | $0 | $0 |
| Dividends | $0 | $0 | $0 |
| Subtotal Cash Spent | $17,195 | $72,234 | $126,690 |
| Net Cash Flow | ($17,195) | $9,926 | $17,076 |
| Cash Balance | $2,155 | $12,081 | $29,158 |
8.5 Projected Balance Sheet
The following table presents the projected balance sheet.
| Pro Forma Balance Sheet | |||
| Year 1 | Year 2 | Year 3 | |
| Assets | |||
| Current Assets | |||
| Cash | $2,155 | $12,081 | $29,158 |
| Accounts Receivable | $0 | $0 | $0 |
| Inventory | $0 | $0 | $0 |
| Other Current Assets | $0 | $0 | $0 |
| Total Current Assets | $2,155 | $12,081 | $29,158 |
| Long-term Assets | |||
| Long-term Assets | $2,000 | $2,000 | $2,000 |
| Accumulated Depreciation | $400 | $800 | $1,200 |
| Total Long-term Assets | $1,600 | $1,200 | $800 |
| Total Assets | $3,756 | $13,281 | $29,958 |
| Liabilities and Capital | Year 1 | Year 2 | Year 3 |
| Current Liabilities | |||
| Accounts Payable | $425 | $4,281 | $5,947 |
| Current Borrowing | $0 | $0 | $0 |
| Other Current Liabilities | $0 | $0 | $0 |
| Subtotal Current Liabilities | $425 | $4,281 | $5,947 |
| Long-term Liabilities | $0 | $0 | $0 |
| Total Liabilities | $425 | $4,281 | $5,947 |
| Paid-in Capital | $28,000 | $28,000 | $28,000 |
| Retained Earnings | ($6,650) | ($24,670) | ($19,000) |
| Earnings | ($18,020) | $5,670 | $15,011 |
| Total Capital | $3,330 | $9,000 | $24,011 |
| Total Liabilities and Capital | $3,756 | $13,281 | $29,958 |
| Net Worth | $3,330 | $9,000 | $24,011 |
8.6 Business Ratios
Business ratios for the years of this plan are shown below. Industry profile ratios based on the Music recording and distribuiting industry NAICS code 512220, are shown for comparison.
| Ratio Analysis | ||||
| Year 1 | Year 2 | Year 3 | Industry Profile | |
| Sales Growth | 0.00% | 0.00% | 74.98% | -22.55% |
| Percent of Total Assets | ||||
| Accounts Receivable | 0.00% | 0.00% | 0.00% | 16.48% |
| Inventory | 0.00% | 0.00% | 0.00% | 21.02% |
| Other Current Assets | 0.00% | 0.00% | 0.00% | 31.62% |
| Total Current Assets | 57.39% | 90.96% | 97.33% | 69.12% |
| Long-term Assets | 42.61% | 9.04% | 2.67% | 30.88% |
| Total Assets | 100.00% | 100.00% | 100.00% | 100.00% |
| Current Liabilities | 11.32% | 32.24% | 19.85% | 25.08% |
| Long-term Liabilities | 0.00% | 0.00% | 0.00% | 16.76% |
| Total Liabilities | 11.32% | 32.24% | 19.85% | 41.84% |
| Net Worth | 88.68% | 67.76% | 80.15% | 58.16% |
| Percent of Sales | ||||
| Sales | 100.00% | 100.00% | 100.00% | 100.00% |
| Gross Margin | 0.00% | 71.81% | 77.03% | 29.18% |
| Selling, General & Administrative Expenses | 0.00% | 64.91% | 66.59% | 10.66% |
| Advertising Expenses | 0.00% | 0.00% | 0.00% | 0.44% |
| Profit Before Interest and Taxes | 0.00% | 9.86% | 14.92% | 5.25% |
| Main Ratios | ||||
| Current | 5.07 | 2.82 | 4.90 | 2.54 |
| Quick | 5.07 | 2.82 | 4.90 | 1.38 |
| Total Debt to Total Assets | 11.32% | 32.24% | 19.85% | 49.40% |
| Pre-tax Return on Net Worth | -541.06% | 89.99% | 89.31% | 6.25% |
| Pre-tax Return on Assets | -479.79% | 60.98% | 71.58% | 12.35% |
| Additional Ratios | Year 1 | Year 2 | Year 3 | |
| Net Profit Margin | 0.00% | 6.90% | 10.44% | n.a |
| Return on Equity | -541.06% | 63.00% | 62.52% | n.a |
| Activity Ratios | ||||
| Accounts Receivable Turnover | 0.00 | 0.00 | 0.00 | n.a |
| Collection Days | 0 | 0 | 0 | n.a |
| Inventory Turnover | 0.00 | 0.00 | 0.00 | n.a |
| Accounts Payable Turnover | 37.66 | 12.17 | 12.17 | n.a |
| Payment Days | 27 | 16 | 26 | n.a |
| Total Asset Turnover | 0.00 | 6.19 | 4.80 | n.a |
| Debt Ratios | ||||
| Debt to Net Worth | 0.13 | 0.48 | 0.25 | n.a |
| Current Liab. to Liab. | 1.00 | 1.00 | 1.00 | n.a |
| Liquidity Ratios | ||||
| Net Working Capital | $1,730 | $7,800 | $23,211 | n.a |
| Interest Coverage | 0.00 | 0.00 | 0.00 | n.a |
| Additional Ratios | ||||
| Assets to Sales | n.a. | 0.16 | 0.21 | n.a |
| Current Debt/Total Assets | 11% | 32% | 20% | n.a |
| Acid Test | 5.07 | 2.82 | 4.90 | n.a |
| Sales/Net Worth | 0.00 | 9.13 | 5.99 | n.a |
| Dividend Payout | 0.00 | 0.00 | 0.00 | n.a |
Appendix
| Sales Forecast | |||||||||||||
| Month 1 | Month 2 | Month 3 | Month 4 | Month 5 | Month 6 | Month 7 | Month 8 | Month 9 | Month 10 | Month 11 | Month 12 | ||
| Sales | |||||||||||||
| Record retailer sales | 0% | $0 | $0 | $0 | $0 | $0 | $0 | $0 | $0 | $0 | $0 | $0 | $0 |
| Live concert record sales | 0% | $0 | $0 | $0 | $0 | $0 | $0 | $0 | $0 | $0 | $0 | $0 | $0 |
| CD sales from website | 0% | $0 | $0 | $0 | $0 | $0 | $0 | $0 | $0 | $0 | $0 | $0 | $0 |
| Contract buy-outs | 0% | $0 | $0 | $0 | $0 | $0 | $0 | $0 | $0 | $0 | $0 | $0 | $0 |
| Total Sales | $0 | $0 | $0 | $0 | $0 | $0 | $0 | $0 | $0 | $0 | $0 | $0 | |
| Direct Cost of Sales | Month 1 | Month 2 | Month 3 | Month 4 | Month 5 | Month 6 | Month 7 | Month 8 | Month 9 | Month 10 | Month 11 | Month 12 | |
| Record retailer sales | $0 | $0 | $0 | $0 | $0 | $0 | $0 | $0 | $0 | $0 | $0 | $0 | |
| Live concert record sales | $0 | $0 | $0 | $0 | $0 | $0 | $0 | $0 | $0 | $0 | $0 | $0 | |
| CD sales from website | $0 | $0 | $0 | $0 | $0 | $0 | $0 | $0 | $0 | $0 | $0 | $0 | |
| Contract buy-outs | $0 | $0 | $0 | $0 | $0 | $0 | $0 | $0 | $0 | $0 | $0 | $0 | |
| Subtotal Direct Cost of Sales | $0 | $0 | $0 | $0 | $0 | $0 | $0 | $0 | $0 | $0 | $0 | $0 | |
| Personnel Plan | |||||||||||||
| Month 1 | Month 2 | Month 3 | Month 4 | Month 5 | Month 6 | Month 7 | Month 8 | Month 9 | Month 10 | Month 11 | Month 12 | ||
| Hillary | 0% | $0 | $0 | $0 | $0 | $0 | $0 | $0 | $0 | $0 | $0 | $0 | $0 |
| Sales | 0% | $0 | $0 | $0 | $0 | $0 | $0 | $0 | $0 | $0 | $0 | $0 | $0 |
| Distribution | 0% | $0 | $0 | $800 | $0 | $0 | $800 | $0 | $0 | $0 | $0 | $0 | $0 |
| Total People | 1 | 1 | 2 | 1 | 1 | 2 | 1 | 1 | 1 | 1 | 1 | 1 | |
| Total Payroll | $0 | $0 | $800 | $0 | $0 | $800 | $0 | $0 | $0 | $0 | $0 | $0 | |
| General Assumptions | |||||||||||||
| Month 1 | Month 2 | Month 3 | Month 4 | Month 5 | Month 6 | Month 7 | Month 8 | Month 9 | Month 10 | Month 11 | Month 12 | ||
| Plan Month | 1 | 2 | 3 | 4 | 5 | 6 | 7 | 8 | 9 | 10 | 11 | 12 | |
| Current Interest Rate | 10.00% | 10.00% | 10.00% | 10.00% | 10.00% | 10.00% | 10.00% | 10.00% | 10.00% | 10.00% | 10.00% | 10.00% | |
| Long-term Interest Rate | 10.00% | 10.00% | 10.00% | 10.00% | 10.00% | 10.00% | 10.00% | 10.00% | 10.00% | 10.00% | 10.00% | 10.00% | |
| Tax Rate | 30.00% | 30.00% | 30.00% | 30.00% | 30.00% | 30.00% | 30.00% | 30.00% | 30.00% | 30.00% | 30.00% | 30.00% | |
| Other | 0 | 0 | 0 | 0 | 0 | 0 | 0 | 0 | 0 | 0 | 0 | 0 | |
| Pro Forma Profit and Loss | |||||||||||||
| Month 1 | Month 2 | Month 3 | Month 4 | Month 5 | Month 6 | Month 7 | Month 8 | Month 9 | Month 10 | Month 11 | Month 12 | ||
| Sales | $0 | $0 | $0 | $0 | $0 | $0 | $0 | $0 | $0 | $0 | $0 | $0 | |
| Direct Cost of Sales | $0 | $0 | $0 | $0 | $0 | $0 | $0 | $0 | $0 | $0 | $0 | $0 | |
| Other Costs of Goods | $0 | $0 | $0 | $0 | $0 | $0 | $0 | $0 | $0 | $0 | $0 | $0 | |
| Total Cost of Sales | $0 | $0 | $0 | $0 | $0 | $0 | $0 | $0 | $0 | $0 | $0 | $0 | |
| Gross Margin | $0 | $0 | $0 | $0 | $0 | $0 | $0 | $0 | $0 | $0 | $0 | $0 | |
| Gross Margin % | 0.00% | 0.00% | 0.00% | 0.00% | 0.00% | 0.00% | 0.00% | 0.00% | 0.00% | 0.00% | 0.00% | 0.00% | |
| Expenses | |||||||||||||
| Payroll | $0 | $0 | $800 | $0 | $0 | $800 | $0 | $0 | $0 | $0 | $0 | $0 | |
| Sales and Marketing and Other Expenses | $250 | $5,500 | $250 | $250 | $5,500 | $250 | $250 | $250 | $250 | $250 | $250 | $250 | |
| Depreciation | $33 | $33 | $33 | $33 | $33 | $33 | $33 | $33 | $33 | $33 | $33 | $33 | |
| Rent | $0 | $0 | $0 | $0 | $0 | $0 | $0 | $0 | $0 | $0 | $0 | $0 | |
| Website expenses | $130 | $130 | $130 | $130 | $130 | $130 | $130 | $130 | $130 | $130 | $130 | $130 | |
| Utilities | $30 | $30 | $30 | $30 | $30 | $30 | $30 | $30 | $30 | $30 | $30 | $30 | |
| Insurance | $30 | $30 | $30 | $30 | $30 | $30 | $30 | $30 | $30 | $30 | $30 | $30 | |
| Payroll Taxes | 15% | $0 | $0 | $120 | $0 | $0 | $120 | $0 | $0 | $0 | $0 | $0 | $0 |
| Returned CDs | $0 | $0 | $0 | $0 | $0 | $0 | $0 | $0 | $0 | $0 | $0 | $0 | |
| Total Operating Expenses | $473 | $5,723 | $1,393 | $473 | $5,723 | $1,393 | $473 | $473 | $473 | $473 | $473 | $473 | |
| Profit Before Interest and Taxes | ($473) | ($5,723) | ($1,393) | ($473) | ($5,723) | ($1,393) | ($473) | ($473) | ($473) | ($473) | ($473) | ($473) | |
| EBITDA | ($440) | ($5,690) | ($1,360) | ($440) | ($5,690) | ($1,360) | ($440) | ($440) | ($440) | ($440) | ($440) | ($440) | |
| Interest Expense | $0 | $0 | $0 | $0 | $0 | $0 | $0 | $0 | $0 | $0 | $0 | $0 | |
| Taxes Incurred | $0 | $0 | $0 | $0 | $0 | $0 | $0 | $0 | $0 | $0 | $0 | $0 | |
| Net Profit | ($473) | ($5,723) | ($1,393) | ($473) | ($5,723) | ($1,393) | ($473) | ($473) | ($473) | ($473) | ($473) | ($473) | |
| Net Profit/Sales | 0.00% | 0.00% | 0.00% | 0.00% | 0.00% | 0.00% | 0.00% | 0.00% | 0.00% | 0.00% | 0.00% | 0.00% | |
| Pro Forma Cash Flow | |||||||||||||
| Month 1 | Month 2 | Month 3 | Month 4 | Month 5 | Month 6 | Month 7 | Month 8 | Month 9 | Month 10 | Month 11 | Month 12 | ||
| Cash Received | |||||||||||||
| Cash from Operations | |||||||||||||
| Cash Sales | $0 | $0 | $0 | $0 | $0 | $0 | $0 | $0 | $0 | $0 | $0 | $0 | |
| Cash from Receivables | $0 | $0 | $0 | $0 | $0 | $0 | $0 | $0 | $0 | $0 | $0 | $0 | |
| Subtotal Cash from Operations | $0 | $0 | $0 | $0 | $0 | $0 | $0 | $0 | $0 | $0 | $0 | $0 | |
| Additional Cash Received | |||||||||||||
| Sales Tax, VAT, HST/GST Received | 0.00% | $0 | $0 | $0 | $0 | $0 | $0 | $0 | $0 | $0 | $0 | $0 | $0 |
| New Current Borrowing | $0 | $0 | $0 | $0 | $0 | $0 | $0 | $0 | $0 | $0 | $0 | $0 | |
| New Other Liabilities (interest-free) | $0 | $0 | $0 | $0 | $0 | $0 | $0 | $0 | $0 | $0 | $0 | $0 | |
| New Long-term Liabilities | $0 | $0 | $0 | $0 | $0 | $0 | $0 | $0 | $0 | $0 | $0 | $0 | |
| Sales of Other Current Assets | $0 | $0 | $0 | $0 | $0 | $0 | $0 | $0 | $0 | $0 | $0 | $0 | |
| Sales of Long-term Assets | $0 | $0 | $0 | $0 | $0 | $0 | $0 | $0 | $0 | $0 | $0 | $0 | |
| New Investment Received | $0 | $0 | $0 | $0 | $0 | $0 | $0 | $0 | $0 | $0 | $0 | $0 | |
| Subtotal Cash Received | $0 | $0 | $0 | $0 | $0 | $0 | $0 | $0 | $0 | $0 | $0 | $0 | |
| Expenditures | Month 1 | Month 2 | Month 3 | Month 4 | Month 5 | Month 6 | Month 7 | Month 8 | Month 9 | Month 10 | Month 11 | Month 12 | |
| Expenditures from Operations | |||||||||||||
| Cash Spending | $0 | $0 | $800 | $0 | $0 | $800 | $0 | $0 | $0 | $0 | $0 | $0 | |
| Bill Payments | $15 | $615 | $5,519 | $556 | $615 | $5,519 | $556 | $440 | $440 | $440 | $440 | $440 | |
| Subtotal Spent on Operations | $15 | $615 | $6,319 | $556 | $615 | $6,319 | $556 | $440 | $440 | $440 | $440 | $440 | |
| Additional Cash Spent | |||||||||||||
| Sales Tax, VAT, HST/GST Paid Out | $0 | $0 | $0 | $0 | $0 | $0 | $0 | $0 | $0 | $0 | $0 | $0 | |
| Principal Repayment of Current Borrowing | $0 | $0 | $0 | $0 | $0 | $0 | $0 | $0 | $0 | $0 | $0 | $0 | |
| Other Liabilities Principal Repayment | $0 | $0 | $0 | $0 | $0 | $0 | $0 | $0 | $0 | $0 | $0 | $0 | |
| Long-term Liabilities Principal Repayment | $0 | $0 | $0 | $0 | $0 | $0 | $0 | $0 | $0 | $0 | $0 | $0 | |
| Purchase Other Current Assets | $0 | $0 | $0 | $0 | $0 | $0 | $0 | $0 | $0 | $0 | $0 | $0 | |
| Purchase Long-term Assets | $0 | $0 | $0 | $0 | $0 | $0 | $0 | $0 | $0 | $0 | $0 | $0 | |
| Dividends | $0 | $0 | $0 | $0 | $0 | $0 | $0 | $0 | $0 | $0 | $0 | $0 | |
| Subtotal Cash Spent | $15 | $615 | $6,319 | $556 | $615 | $6,319 | $556 | $440 | $440 | $440 | $440 | $440 | |
| Net Cash Flow | ($15) | ($615) | ($6,319) | ($556) | ($615) | ($6,319) | ($556) | ($440) | ($440) | ($440) | ($440) | ($440) | |
| Cash Balance | $19,335 | $18,720 | $12,401 | $11,845 | $11,230 | $4,911 | $4,355 | $3,915 | $3,475 | $3,035 | $2,595 | $2,155 | |
| Pro Forma Balance Sheet | |||||||||||||
| Month 1 | Month 2 | Month 3 | Month 4 | Month 5 | Month 6 | Month 7 | Month 8 | Month 9 | Month 10 | Month 11 | Month 12 | ||
| Assets | Starting Balances | ||||||||||||
| Current Assets | |||||||||||||
| Cash | $19,350 | $19,335 | $18,720 | $12,401 | $11,845 | $11,230 | $4,911 | $4,355 | $3,915 | $3,475 | $3,035 | $2,595 | $2,155 |
| Accounts Receivable | $0 | $0 | $0 | $0 | $0 | $0 | $0 | $0 | $0 | $0 | $0 | $0 | $0 |
| Inventory | $0 | $0 | $0 | $0 | $0 | $0 | $0 | $0 | $0 | $0 | $0 | $0 | $0 |
| Other Current Assets | $0 | $0 | $0 | $0 | $0 | $0 | $0 | $0 | $0 | $0 | $0 | $0 | $0 |
| Total Current Assets | $19,350 | $19,335 | $18,720 | $12,401 | $11,845 | $11,230 | $4,911 | $4,355 | $3,915 | $3,475 | $3,035 | $2,595 | $2,155 |
| Long-term Assets | |||||||||||||
| Long-term Assets | $2,000 | $2,000 | $2,000 | $2,000 | $2,000 | $2,000 | $2,000 | $2,000 | $2,000 | $2,000 | $2,000 | $2,000 | $2,000 |
| Accumulated Depreciation | $0 | $33 | $67 | $100 | $133 | $167 | $200 | $233 | $266 | $300 | $333 | $366 | $400 |
| Total Long-term Assets | $2,000 | $1,967 | $1,933 | $1,900 | $1,867 | $1,834 | $1,800 | $1,767 | $1,734 | $1,700 | $1,667 | $1,634 | $1,600 |
| Total Assets | $21,350 | $21,302 | $20,654 | $14,301 | $13,712 | $13,064 | $6,712 | $6,122 | $5,649 | $5,176 | $4,702 | $4,229 | $3,756 |
| Liabilities and Capital | Month 1 | Month 2 | Month 3 | Month 4 | Month 5 | Month 6 | Month 7 | Month 8 | Month 9 | Month 10 | Month 11 | Month 12 | |
| Current Liabilities | |||||||||||||
| Accounts Payable | $0 | $425 | $5,500 | $541 | $425 | $5,500 | $541 | $425 | $425 | $425 | $425 | $425 | $425 |
| Current Borrowing | $0 | $0 | $0 | $0 | $0 | $0 | $0 | $0 | $0 | $0 | $0 | $0 | $0 |
| Other Current Liabilities | $0 | $0 | $0 | $0 | $0 | $0 | $0 | $0 | $0 | $0 | $0 | $0 | $0 |
| Subtotal Current Liabilities | $0 | $425 | $5,500 | $541 | $425 | $5,500 | $541 | $425 | $425 | $425 | $425 | $425 | $425 |
| Long-term Liabilities | $0 | $0 | $0 | $0 | $0 | $0 | $0 | $0 | $0 | $0 | $0 | $0 | $0 |
| Total Liabilities | $0 | $425 | $5,500 | $541 | $425 | $5,500 | $541 | $425 | $425 | $425 | $425 | $425 | $425 |
| Paid-in Capital | $28,000 | $28,000 | $28,000 | $28,000 | $28,000 | $28,000 | $28,000 | $28,000 | $28,000 | $28,000 | $28,000 | $28,000 | $28,000 |
| Retained Earnings | ($6,650) | ($6,650) | ($6,650) | ($6,650) | ($6,650) | ($6,650) | ($6,650) | ($6,650) | ($6,650) | ($6,650) | ($6,650) | ($6,650) | ($6,650) |
| Earnings | $0 | ($473) | ($6,197) | ($7,590) | ($8,063) | ($13,787) | ($15,180) | ($15,653) | ($16,126) | ($16,600) | ($17,073) | ($17,546) | ($18,020) |
| Total Capital | $21,350 | $20,877 | $15,153 | $13,760 | $13,287 | $7,564 | $6,170 | $5,697 | $5,224 | $4,750 | $4,277 | $3,804 | $3,330 |
| Total Liabilities and Capital | $21,350 | $21,302 | $20,654 | $14,301 | $13,712 | $13,064 | $6,712 | $6,122 | $5,649 | $5,176 | $4,702 | $4,229 | $3,756 |
| Net Worth | $21,350 | $20,877 | $15,153 | $13,760 | $13,287 | $7,563 | $6,170 | $5,697 | $5,224 | $4,750 | $4,277 | $3,804 | $3,330 |


