
HeavyMetal Praise Records
Executive Summary
Youth will be served! For the past 10 years, Christian music has made strong inroads in every area of popular music except for the vital and chaotic world of Heavy Metal music. Heavy Metal Praise Records will focus only on recording Christian Heavy Metal performers, promoting their success in the popular mainstream of Punk and Ska music.
1.1 Objectives
- Sign and record two new Heavy Metal bands in the first year.
- Release the first CD of each group in the first year.
- Establish a strong distribution network that will facilitate CD sales.
- Establish the necessary strategic alliances to assure the widest possible distribution of our music.
1.2 Mission
The idea of Heavy Metal Praise Records is the brainchild of a group of dedicated Christians who created the Skate Ministry over three years ago. The Skate Ministry is a group of 10 adult skateboarders who spread the word of God to young skateboarders during the weekend at various skate parks throughout the area. Most of these young skateboarders are boys between the ages of 12 to 18. The predominant music in the skateboard culture is Heavy Metal and is played at every skatepark in the area. From the beginning the group realized that the music itself was creating negative actions on the part of young skateboarders and was facilitating a culture of selfishness and violence.
Heavy Metal Praise’s mission is to introduce Christian Heavy Metal bands to the target audience that gives the same musical intensity of popular Heavy Metal bands but with a more positive, constructive message that will move young people to a closer relationship with God.
1.3 Keys to Success
- Delivering Heavy Metal groups that the target audience will find irresistible.
- Access the music and distribution network that feeds Heavy Metal artists to the skate culture.
- Access the traditional Christian music and distribution network that will provide a ready-made group of customers for Heavy Metal Praise Records artists.
Company Summary
Heavy Metal Praise Records is a recording business that will focus exclusively on Christian Heavy Metal music groups.
2.1 Company Ownership
The sole founder and owner of Heavy Metal Praise Records is Johnny Young. Johnny is also a founding member of the Skate Ministry and a skateboarder for the last 20 years.
2.2 Start-up Summary
Heavy Metal Praise Records has the following start-up expenses and the purchase of equipment:
-
Computer system with three workstations, a printer, CD-RW, Microsoft Office, and Microsoft Access.
-
Legal fees regarding business formation and generating and reviewing contracts.
-
Copier, fax, and a phone line.
-
Various office supplies.

| Start-up | |
| Requirements | |
| Start-up Expenses | |
| Legal | $1,000 |
| Stationery etc. | $100 |
| Rent | $0 |
| Other | $0 |
| Total Start-up Expenses | $1,100 |
| Start-up Assets | |
| Cash Required | $83,900 |
| Start-up Inventory | $0 |
| Other Current Assets | $15,000 |
| Long-term Assets | $0 |
| Total Assets | $98,900 |
| Total Requirements | $100,000 |
| Start-up Funding | |
| Start-up Expenses to Fund | $1,100 |
| Start-up Assets to Fund | $98,900 |
| Total Funding Required | $100,000 |
| Assets | |
| Non-cash Assets from Start-up | $15,000 |
| Cash Requirements from Start-up | $83,900 |
| Additional Cash Raised | $0 |
| Cash Balance on Starting Date | $83,900 |
| Total Assets | $98,900 |
| Liabilities and Capital | |
| Liabilities | |
| Current Borrowing | $0 |
| Long-term Liabilities | $0 |
| Accounts Payable (Outstanding Bills) | $0 |
| Other Current Liabilities (interest-free) | $0 |
| Total Liabilities | $0 |
| Capital | |
| Planned Investment | |
| Johnny | $100,000 |
| Investor 2 | $0 |
| Other | $0 |
| Additional Investment Requirement | $0 |
| Total Planned Investment | $100,000 |
| Loss at Start-up (Start-up Expenses) | ($1,100) |
| Total Capital | $98,900 |
| Total Capital and Liabilities | $98,900 |
| Total Funding | $100,000 |
Products
Heavy Metal Praise Records, as the name implies, produces CDs of Heavy Metal Christian music groups.
The typical Heavy Metal Praise Records buyer is in the 13-22 year old age bracket–and is a direct result of the attitudes expressed by the label’s bands. The spirit of youth is the driving force of the label, offering proof that the energy of Heavy Metal Praise music exists beyond constraints and categorizations.
While Heavy Metal Praise Records hates to pigeonhole any of its artists’ musical sounds, it can be generalized that all the bands convey an in-your-face sound Christian music. This sound, when coupled with each band’s own creativity and inspiration, allows for the artists to maintain their identity while sharing the same energy, focus and often fan base with their label mates. Heavy Metal Praise Records is an artist-friendly label, priding itself on giving its bands complete artistic and creative freedom.
Market Analysis Summary
Heavy Metal music is the music of preference among boys and young men, ages 12-22, who are part of the skateboarding culture. Heavy Metal music generated $180 million dollars in sales last year.
Skateboarding has grown into an enormously popular recreational sport that generated 1/2 billion dollars in sales last year. Each year the base of skateboarder grows even larger. The sport is still enjoyed by young men in their thirties. In many cases, these older skateboarders still enjoy Heavy Metal music. This represents a huge market opportunity for Christian music.
Heavy Metal Praise Records will focus on two customer groups:
- Early teen skateboarder.
- Late teen skateboarder.
4.1 Market Segmentation
- Early Teen Skateboarders: This group has limited mobility to attend most Heavy Metal group performances. Yet they represent the largest consumer group of Heavy Metal music. Generally, this target group hears the music from friends, at skateboard parks and at skateboard shops.
- Late Teen Skateboarders: This group represents the strong fan base that comes out for live performances at local clubs. They are also exposed to the music at skateboard parks and skateboard shops. It is critical to build a secure fan base with this group in order to generate sales among the younger skate boarders.

| Market Analysis | |||||||
| Year 1 | Year 2 | Year 3 | Year 4 | Year 5 | |||
| Potential Customers | Growth | CAGR | |||||
| Early Teen Skateboarders | 10% | 3,000,000 | 3,300,000 | 3,630,000 | 3,993,000 | 4,392,300 | 10.00% |
| Late Teen Skateboarders | 10% | 4,000,000 | 4,400,000 | 4,840,000 | 5,324,000 | 5,856,400 | 10.00% |
| Other | 0% | 0 | 0 | 0 | 0 | 0 | 0.00% |
| Total | 10.00% | 7,000,000 | 7,700,000 | 8,470,000 | 9,317,000 | 10,248,700 | 10.00% |
Strategy and Implementation Summary
Heavy Metal Praise Records will use their competitive advantages in a new musical area of Christian music to steadily gain market share. The first advantage is based on Johnny’s extensive inside knowledge of the recording industry. The second advantage is an already established network of contacts within the industry.
5.1 Competitive Edge
Presently, there are few Christian Heavy Metal bands with CDs in the marketplace. The only real competition is the acceptance of the skateboard culture. Can a Heavy Metal group with a christian message gain a fan base? The success of a Heavy Metal band is dependent on its fan base and its live performances. If the energy is there, the fan base will grow and CD sales will follow.
Heavy Metal Praise Records understands that their bands must have the energy before the message will be heard.
5.2 Marketing Strategy
Heavy Metal Praise Records has established the following Promotion and Distribution strategies.
5.2.1 Promotion Strategy
- Early Teens: Heavy Metal Praise recording artists will be marketed at the weekly sponsored skateboarding events by the Skate Ministry. A band will play at each event during the summer months. In addition, Heavy Metal Praise recording artists will perform as part of the concert series sponsored by Rally Skateboards. At these events, free CD samplers will be given out of Heavy Metal Praise recording artists.
- Late Teens: Heavy Metal Praise recording artists will be booked to play extensively during the summer of 2002. A Heavy Metal Praise band will be part of the “Split Cross” tour in the region. Split Cross is a Christian music website and a strategic partner of Heavy Metal Praise recording. At these events, free CD samplers will be given out of Heavy Metal Praise recording artists.
5.2.2 Distribution Strategy
Heavy Metal Praise Records have made strategic alliances with both the Coalition of Independent Music Stores (CIMS) and Straight Arrow, the number one Christian Music Website in the country. Heavy Metal Praise Records CDs will be distributed through CIMS to stores regionally and with greater visibility of the bands, the distribution will expand nationally. Straight Arrow will sell the CDs online as part of their campaign to widen the range of artists they offer. Last year, Straight Arrow sales topped $50 million.

5.3 Strategic Alliances
The strategic alliance with the Coalition of Independent Music Stores (CIMS) and Straight Arrow holds great potential.
- Straight Arrow is a distribution system for Christian artists who want to buck the system and do it without major label backing. The amazing thing is: it truly works. Some of the most sincere, yet cutting edge artists existing today are available to purchase at the Straight Arrow website. They will focus on building sales in the field of Heavy Metal music starting with Heavy Metal Praise artists.
- Coalition of Independent Music Stores represents a distribution system of 10,000 stores nationally. CIMS creates its own sales programs that focus on independent artists. They have committed to packaging Heavy Metal Praise Recording artists to its regional members. With the bands’ success, they plan to distribute the CDs nationally.
5.4 Sales Strategy
Our combined sales strategy of distributing our product online and in stores will result in the following first year sales goals:
- 5,000 CDs sold online.
- 10,000 CDs sold in stores.
The sales totals represent only six months of sales activity. The first six months will be focused on signing the bands and producing the recording.
5.4.1 Sales Forecast
The following table and chart presents specific sales forecasts by month, over the first year of development. Years two and three are cumulative totals only.

| Sales Forecast | |||
| Year 1 | Year 2 | Year 3 | |
| Sales | |||
| Online | $84,000 | $160,000 | $200,000 |
| In Store | $154,000 | $380,000 | $500,000 |
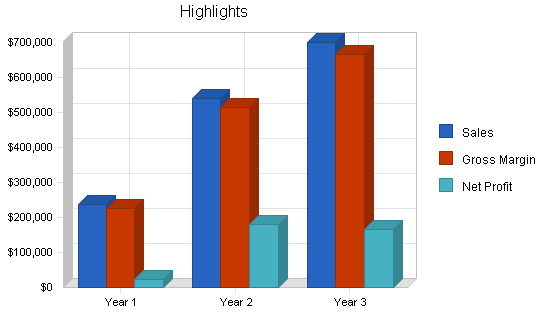
| Total Sales | $238,000 | $540,000 | $700,000 |
| Direct Cost of Sales | Year 1 | Year 2 | Year 3 |
| Online | $4,200 | $8,000 | $10,000 |
| In Store | $7,700 | $19,000 | $25,000 |
| Subtotal Direct Cost of Sales | $11,900 | $27,000 | $35,000 |
5.5 Milestones
Heavy Metal Praise Records will have several milestones:
- Sign two Heavy Metal Christian bands.
- Produce two new recordings during the first six months of operation.
- Release recordings in six months.
| Milestones | |||||
| Milestone | Start Date | End Date | Budget | Manager | Department |
| Signing of Bands | 1/1/2001 | 3/1/2001 | $10,000 | JY | Owner |
| Recording | 3/31/2001 | 6/30/2001 | $65,000 | JY | Owner |
| CD Release | 6/30/2001 | 9/30/2001 | $40,000 | JY | Owner |
| Totals | $115,000 | ||||
Management Summary
Heavy Metal Praise Records is solely operated by Johnny Young. Johnny is a Christian music industry veteran with over 13 years of music ministry experience with extensive connections with producers and distributors. Johnny toured the USA with the CCM group “Seeds of Change” between 1991 and 1998. It was during this time that Johnny felt God calling him into a ministry that would usher in Heavy Metal music that was so powerful, so fresh…that people would sense the spirit of God and come to a realization that God desired each and every one of His creations to know Him intimately.
This will be a one person business for a while. Johnny’s planned salary is shown in the Personnel table below.
Financial Plan
The following sections will outline the general financial assumptions, break-even analysis, profit and loss, cash flow, balance sheet and business ratios.
7.1 Important Assumptions
The following table shows some of the basic financial assumptions used in this business plan.
| General Assumptions | |||
| Year 1 | Year 2 | Year 3 | |
| Plan Month | 1 | 2 | 3 |
| Current Interest Rate | 10.00% | 10.00% | 10.00% |
| Long-term Interest Rate | 10.00% | 10.00% | 10.00% |
| Tax Rate | 30.00% | 30.00% | 30.00% |
| Other | 0 | 0 | 0 |
7.2 Break-even Analysis
The Break-even Analysis indicates approximately $1,700 is needed in monthly revenue to break even. The Estimated Monthly Fixed Cost varies over the course of the first year, as seen in the P & L appendix table, and this figure is an average based on the first-year totals.

| Break-even Analysis | |
| Monthly Revenue Break-even | $17,022 |
| Assumptions: | |
| Average Percent Variable Cost | 5% |
| Estimated Monthly Fixed Cost | $16,171 |
7.3 Projected Profit and Loss
The following table will indicate projected profit and loss.

| Pro Forma Profit and Loss | |||
| Year 1 | Year 2 | Year 3 | |
| Sales | $238,000 | $540,000 | $700,000 |
| Direct Cost of Sales | $11,900 | $27,000 | $35,000 |
| Other Production Expenses | $0 | $0 | $0 |
| Total Cost of Sales | $11,900 | $27,000 | $35,000 |
| Gross Margin | $226,100 | $513,000 | $665,000 |
| Gross Margin % | 95.00% | 95.00% | 95.00% |
| Expenses | |||
| Payroll | $27,000 | $35,000 | $42,000 |
| Sales and Marketing and Other Expenses | $142,000 | $190,000 | $350,000 |
| Depreciation | $3,000 | $3,000 | $3,000 |
| Leased Equipment | $0 | $0 | $0 |
| Utilities | $0 | $0 | $0 |
| Insurance | $6,000 | $8,000 | $10,000 |
| Rent | $12,000 | $15,000 | $18,000 |
| Payroll Taxes | $4,050 | $5,250 | $6,300 |
| Other | $0 | $0 | $0 |
| Total Operating Expenses | $194,050 | $256,250 | $429,300 |
| Profit Before Interest and Taxes | $32,050 | $256,750 | $235,700 |
| EBITDA | $35,050 | $259,750 | $238,700 |
| Interest Expense | $0 | $0 | $0 |
| Taxes Incurred | $9,615 | $77,025 | $70,710 |
| Net Profit | $22,435 | $179,725 | $164,990 |
| Net Profit/Sales | 9.43% | 33.28% | 23.57% |
7.4 Projected Cash Flow
Heavy Metal Praise will begin with adequate investment to cover the beginning months of negative cash flow and, as shown below, have an overall increase in cash balance by the end of the first plan year.

| Pro Forma Cash Flow | |||
| Year 1 | Year 2 | Year 3 | |
| Cash Received | |||
| Cash from Operations | |||
| Cash Sales | $166,600 | $378,000 | $490,000 |
| Cash from Receivables | $31,740 | $111,675 | $183,338 |
| Subtotal Cash from Operations | $198,340 | $489,675 | $673,338 |
| Additional Cash Received | |||
| Sales Tax, VAT, HST/GST Received | $0 | $0 | $0 |
| New Current Borrowing | $0 | $0 | $0 |
| New Other Liabilities (interest-free) | $0 | $0 | $0 |
| New Long-term Liabilities | $0 | $0 | $0 |
| Sales of Other Current Assets | $0 | $0 | $0 |
| Sales of Long-term Assets | $0 | $0 | $0 |
| New Investment Received | $0 | $0 | $0 |
| Subtotal Cash Received | $198,340 | $489,675 | $673,338 |
| Expenditures | Year 1 | Year 2 | Year 3 |
| Expenditures from Operations | |||
| Cash Spending | $27,000 | $35,000 | $42,000 |
| Bill Payments | $140,307 | $350,569 | $479,397 |
| Subtotal Spent on Operations | $167,307 | $385,569 | $521,397 |
| Additional Cash Spent | |||
| Sales Tax, VAT, HST/GST Paid Out | $0 | $0 | $0 |
| Principal Repayment of Current Borrowing | $0 | $0 | $0 |
| Other Liabilities Principal Repayment | $0 | $0 | $0 |
| Long-term Liabilities Principal Repayment | $0 | $0 | $0 |
| Purchase Other Current Assets | $0 | $0 | $0 |
| Purchase Long-term Assets | $0 | $0 | $0 |
| Dividends | $0 | $0 | $0 |
| Subtotal Cash Spent | $167,307 | $385,569 | $521,397 |
| Net Cash Flow | $31,033 | $104,107 | $151,940 |
| Cash Balance | $114,933 | $219,039 | $370,980 |
7.5 Projected Balance Sheet
The following chart and table indicates balance sheet.
| Pro Forma Balance Sheet | |||
| Year 1 | Year 2 | Year 3 | |
| Assets | |||
| Current Assets | |||
| Cash | $114,933 | $219,039 | $370,980 |
| Accounts Receivable | $39,660 | $89,985 | $116,647 |
| Inventory | $4,400 | $9,983 | $12,941 |
| Other Current Assets | $15,000 | $15,000 | $15,000 |
| Total Current Assets | $173,993 | $334,007 | $515,568 |
| Long-term Assets | |||
| Long-term Assets | $0 | $0 | $0 |
| Accumulated Depreciation | $3,000 | $6,000 | $9,000 |
| Total Long-term Assets | ($3,000) | ($6,000) | ($9,000) |
| Total Assets | $170,993 | $328,007 | $506,568 |
| Liabilities and Capital | Year 1 | Year 2 | Year 3 |
| Current Liabilities | |||
| Accounts Payable | $49,658 | $26,947 | $40,518 |
| Current Borrowing | $0 | $0 | $0 |
| Other Current Liabilities | $0 | $0 | $0 |
| Subtotal Current Liabilities | $49,658 | $26,947 | $40,518 |
| Long-term Liabilities | $0 | $0 | $0 |
| Total Liabilities | $49,658 | $26,947 | $40,518 |
| Paid-in Capital | $100,000 | $100,000 | $100,000 |
| Retained Earnings | ($1,100) | $21,335 | $201,060 |
| Earnings | $22,435 | $179,725 | $164,990 |
| Total Capital | $121,335 | $301,060 | $466,050 |
| Total Liabilities and Capital | $170,993 | $328,007 | $506,568 |
| Net Worth | $121,335 | $301,060 | $466,050 |
7.6 Business Ratios
Business ratios for the years of this plan are shown below. Industry profile ratios based on the Standard Industrial Classification (SIC) code 7929, Musical Groups and Artists, are shown for comparison.
| Ratio Analysis | ||||
| Year 1 | Year 2 | Year 3 | Industry Profile | |
| Sales Growth | 0.00% | 126.89% | 29.63% | 15.20% |
| Percent of Total Assets | ||||
| Accounts Receivable | 23.19% | 27.43% | 23.03% | 6.80% |
| Inventory | 2.57% | 3.04% | 2.55% | 3.10% |
| Other Current Assets | 8.77% | 4.57% | 2.96% | 33.90% |
| Total Current Assets | 101.75% | 101.83% | 101.78% | 43.80% |
| Long-term Assets | -1.75% | -1.83% | -1.78% | 56.20% |
| Total Assets | 100.00% | 100.00% | 100.00% | 100.00% |
| Current Liabilities | 29.04% | 8.22% | 8.00% | 38.30% |
| Long-term Liabilities | 0.00% | 0.00% | 0.00% | 23.30% |
| Total Liabilities | 29.04% | 8.22% | 8.00% | 61.60% |
| Net Worth | 70.96% | 91.78% | 92.00% | 38.40% |
| Percent of Sales | ||||
| Sales | 100.00% | 100.00% | 100.00% | 100.00% |
| Gross Margin | 95.00% | 95.00% | 95.00% | 0.00% |
| Selling, General & Administrative Expenses | 84.69% | 61.33% | 71.13% | 75.30% |
| Advertising Expenses | 13.45% | 7.41% | 7.14% | 2.90% |
| Profit Before Interest and Taxes | 13.47% | 47.55% | 33.67% | 2.90% |
| Main Ratios | ||||
| Current | 3.50 | 12.39 | 12.72 | 1.22 |
| Quick | 3.42 | 12.02 | 12.41 | 0.82 |
| Total Debt to Total Assets | 29.04% | 8.22% | 8.00% | 61.60% |
| Pre-tax Return on Net Worth | 26.41% | 85.28% | 50.57% | 2.90% |
| Pre-tax Return on Assets | 18.74% | 78.28% | 46.53% | 7.40% |
| Additional Ratios | Year 1 | Year 2 | Year 3 | |
| Net Profit Margin | 9.43% | 33.28% | 23.57% | n.a |
| Return on Equity | 18.49% | 59.70% | 35.40% | n.a |
| Activity Ratios | ||||
| Accounts Receivable Turnover | 1.80 | 1.80 | 1.80 | n.a |
| Collection Days | 50 | 146 | 180 | n.a |
| Inventory Turnover | 10.35 | 3.75 | 3.05 | n.a |
| Accounts Payable Turnover | 3.83 | 12.17 | 12.17 | n.a |
| Payment Days | 27 | 43 | 25 | n.a |
| Total Asset Turnover | 1.39 | 1.65 | 1.38 | n.a |
| Debt Ratios | ||||
| Debt to Net Worth | 0.41 | 0.09 | 0.09 | n.a |
| Current Liab. to Liab. | 1.00 | 1.00 | 1.00 | n.a |
| Liquidity Ratios | ||||
| Net Working Capital | $124,335 | $307,060 | $475,050 | n.a |
| Interest Coverage | 0.00 | 0.00 | 0.00 | n.a |
| Additional Ratios | ||||
| Assets to Sales | 0.72 | 0.61 | 0.72 | n.a |
| Current Debt/Total Assets | 29% | 8% | 8% | n.a |
| Acid Test | 2.62 | 8.69 | 9.53 | n.a |
| Sales/Net Worth | 1.96 | 1.79 | 1.50 | n.a |
| Dividend Payout | 0.00 | 0.00 | 0.00 | n.a |
Appendix
| Sales Forecast | |||||||||||||
| Month 1 | Month 2 | Month 3 | Month 4 | Month 5 | Month 6 | Month 7 | Month 8 | Month 9 | Month 10 | Month 11 | Month 12 | ||
| Sales | |||||||||||||
| Online | 0% | $0 | $0 | $0 | $0 | $0 | $3,000 | $4,000 | $6,000 | $10,000 | $13,000 | $18,000 | $30,000 |
| In Store | 0% | $0 | $0 | $0 | $0 | $0 | $3,000 | $10,000 | $12,000 | $18,000 | $25,000 | $36,000 | $50,000 |
| Total Sales | $0 | $0 | $0 | $0 | $0 | $6,000 | $14,000 | $18,000 | $28,000 | $38,000 | $54,000 | $80,000 | |
| Direct Cost of Sales | Month 1 | Month 2 | Month 3 | Month 4 | Month 5 | Month 6 | Month 7 | Month 8 | Month 9 | Month 10 | Month 11 | Month 12 | |
| Online | $0 | $0 | $0 | $0 | $0 | $150 | $200 | $300 | $500 | $650 | $900 | $1,500 | |
| In Store | $0 | $0 | $0 | $0 | $0 | $150 | $500 | $600 | $900 | $1,250 | $1,800 | $2,500 | |
| Subtotal Direct Cost of Sales | $0 | $0 | $0 | $0 | $0 | $300 | $700 | $900 | $1,400 | $1,900 | $2,700 | $4,000 | |
| Personnel Plan | |||||||||||||
| Month 1 | Month 2 | Month 3 | Month 4 | Month 5 | Month 6 | Month 7 | Month 8 | Month 9 | Month 10 | Month 11 | Month 12 | ||
| Owner | 0% | $0 | $2,000 | $2,000 | $2,000 | $2,000 | $2,000 | $2,000 | $3,000 | $3,000 | $3,000 | $3,000 | $3,000 |
| Other | 0% | $0 | $0 | $0 | $0 | $0 | $0 | $0 | $0 | $0 | $0 | $0 | $0 |
| Total People | 0 | 0 | 0 | 0 | 0 | 0 | 0 | 0 | 0 | 0 | 0 | 0 | |
| Total Payroll | $0 | $2,000 | $2,000 | $2,000 | $2,000 | $2,000 | $2,000 | $3,000 | $3,000 | $3,000 | $3,000 | $3,000 | |
| General Assumptions | |||||||||||||
| Month 1 | Month 2 | Month 3 | Month 4 | Month 5 | Month 6 | Month 7 | Month 8 | Month 9 | Month 10 | Month 11 | Month 12 | ||
| Plan Month | 1 | 2 | 3 | 4 | 5 | 6 | 7 | 8 | 9 | 10 | 11 | 12 | |
| Current Interest Rate | 10.00% | 10.00% | 10.00% | 10.00% | 10.00% | 10.00% | 10.00% | 10.00% | 10.00% | 10.00% | 10.00% | 10.00% | |
| Long-term Interest Rate | 10.00% | 10.00% | 10.00% | 10.00% | 10.00% | 10.00% | 10.00% | 10.00% | 10.00% | 10.00% | 10.00% | 10.00% | |
| Tax Rate | 30.00% | 30.00% | 30.00% | 30.00% | 30.00% | 30.00% | 30.00% | 30.00% | 30.00% | 30.00% | 30.00% | 30.00% | |
| Other | 0 | 0 | 0 | 0 | 0 | 0 | 0 | 0 | 0 | 0 | 0 | 0 | |
| Pro Forma Profit and Loss | |||||||||||||
| Month 1 | Month 2 | Month 3 | Month 4 | Month 5 | Month 6 | Month 7 | Month 8 | Month 9 | Month 10 | Month 11 | Month 12 | ||
| Sales | $0 | $0 | $0 | $0 | $0 | $6,000 | $14,000 | $18,000 | $28,000 | $38,000 | $54,000 | $80,000 | |
| Direct Cost of Sales | $0 | $0 | $0 | $0 | $0 | $300 | $700 | $900 | $1,400 | $1,900 | $2,700 | $4,000 | |
| Other Production Expenses | $0 | $0 | $0 | $0 | $0 | $0 | $0 | $0 | $0 | $0 | $0 | $0 | |
| Total Cost of Sales | $0 | $0 | $0 | $0 | $0 | $300 | $700 | $900 | $1,400 | $1,900 | $2,700 | $4,000 | |
| Gross Margin | $0 | $0 | $0 | $0 | $0 | $5,700 | $13,300 | $17,100 | $26,600 | $36,100 | $51,300 | $76,000 | |
| Gross Margin % | 0.00% | 0.00% | 0.00% | 0.00% | 0.00% | 95.00% | 95.00% | 95.00% | 95.00% | 95.00% | 95.00% | 95.00% | |
| Expenses | |||||||||||||
| Payroll | $0 | $2,000 | $2,000 | $2,000 | $2,000 | $2,000 | $2,000 | $3,000 | $3,000 | $3,000 | $3,000 | $3,000 | |
| Sales and Marketing and Other Expenses | $5,000 | $5,000 | $5,000 | $5,000 | $45,000 | $22,000 | $7,000 | $7,000 | $4,000 | $3,000 | $2,000 | $32,000 | |
| Depreciation | $250 | $250 | $250 | $250 | $250 | $250 | $250 | $250 | $250 | $250 | $250 | $250 | |
| Leased Equipment | $0 | $0 | $0 | $0 | $0 | $0 | $0 | $0 | $0 | $0 | $0 | $0 | |
| Utilities | $0 | $0 | $0 | $0 | $0 | $0 | $0 | $0 | $0 | $0 | $0 | $0 | |
| Insurance | $500 | $500 | $500 | $500 | $500 | $500 | $500 | $500 | $500 | $500 | $500 | $500 | |
| Rent | $0 | $0 | $0 | $0 | $1,500 | $1,500 | $1,500 | $1,500 | $1,500 | $1,500 | $1,500 | $1,500 | |
| Payroll Taxes | 15% | $0 | $300 | $300 | $300 | $300 | $300 | $300 | $450 | $450 | $450 | $450 | $450 |
| Other | $0 | $0 | $0 | $0 | $0 | $0 | $0 | $0 | $0 | $0 | $0 | $0 | |
| Total Operating Expenses | $5,750 | $8,050 | $8,050 | $8,050 | $49,550 | $26,550 | $11,550 | $12,700 | $9,700 | $8,700 | $7,700 | $37,700 | |
| Profit Before Interest and Taxes | ($5,750) | ($8,050) | ($8,050) | ($8,050) | ($49,550) | ($20,850) | $1,750 | $4,400 | $16,900 | $27,400 | $43,600 | $38,300 | |
| EBITDA | ($5,500) | ($7,800) | ($7,800) | ($7,800) | ($49,300) | ($20,600) | $2,000 | $4,650 | $17,150 | $27,650 | $43,850 | $38,550 | |
| Interest Expense | $0 | $0 | $0 | $0 | $0 | $0 | $0 | $0 | $0 | $0 | $0 | $0 | |
| Taxes Incurred | ($1,725) | ($2,415) | ($2,415) | ($2,415) | ($14,865) | ($6,255) | $525 | $1,320 | $5,070 | $8,220 | $13,080 | $11,490 | |
| Net Profit | ($4,025) | ($5,635) | ($5,635) | ($5,635) | ($34,685) | ($14,595) | $1,225 | $3,080 | $11,830 | $19,180 | $30,520 | $26,810 | |
| Net Profit/Sales | 0.00% | 0.00% | 0.00% | 0.00% | 0.00% | -243.25% | 8.75% | 17.11% | 42.25% | 50.47% | 56.52% | 33.51% | |
| Pro Forma Cash Flow | |||||||||||||
| Month 1 | Month 2 | Month 3 | Month 4 | Month 5 | Month 6 | Month 7 | Month 8 | Month 9 | Month 10 | Month 11 | Month 12 | ||
| Cash Received | |||||||||||||
| Cash from Operations | |||||||||||||
| Cash Sales | $0 | $0 | $0 | $0 | $0 | $4,200 | $9,800 | $12,600 | $19,600 | $26,600 | $37,800 | $56,000 | |
| Cash from Receivables | $0 | $0 | $0 | $0 | $0 | $0 | $60 | $1,880 | $4,240 | $5,500 | $8,500 | $11,560 | |
| Subtotal Cash from Operations | $0 | $0 | $0 | $0 | $0 | $4,200 | $9,860 | $14,480 | $23,840 | $32,100 | $46,300 | $67,560 | |
| Additional Cash Received | |||||||||||||
| Sales Tax, VAT, HST/GST Received | 0.00% | $0 | $0 | $0 | $0 | $0 | $0 | $0 | $0 | $0 | $0 | $0 | $0 |
| New Current Borrowing | $0 | $0 | $0 | $0 | $0 | $0 | $0 | $0 | $0 | $0 | $0 | $0 | |
| New Other Liabilities (interest-free) | $0 | $0 | $0 | $0 | $0 | $0 | $0 | $0 | $0 | $0 | $0 | $0 | |
| New Long-term Liabilities | $0 | $0 | $0 | $0 | $0 | $0 | $0 | $0 | $0 | $0 | $0 | $0 | |
| Sales of Other Current Assets | $0 | $0 | $0 | $0 | $0 | $0 | $0 | $0 | $0 | $0 | $0 | $0 | |
| Sales of Long-term Assets | $0 | $0 | $0 | $0 | $0 | $0 | $0 | $0 | $0 | $0 | $0 | $0 | |
| New Investment Received | $0 | $0 | $0 | $0 | $0 | $0 | $0 | $0 | $0 | $0 | $0 | $0 | |
| Subtotal Cash Received | $0 | $0 | $0 | $0 | $0 | $4,200 | $9,860 | $14,480 | $23,840 | $32,100 | $46,300 | $67,560 | |
| Expenditures | Month 1 | Month 2 | Month 3 | Month 4 | Month 5 | Month 6 | Month 7 | Month 8 | Month 9 | Month 10 | Month 11 | Month 12 | |
| Expenditures from Operations | |||||||||||||
| Cash Spending | $0 | $2,000 | $2,000 | $2,000 | $2,000 | $2,000 | $2,000 | $3,000 | $3,000 | $3,000 | $3,000 | $3,000 | |
| Bill Payments | $126 | $3,762 | $3,385 | $3,385 | $4,353 | $31,989 | $18,771 | $10,857 | $11,823 | $13,452 | $16,286 | $22,119 | |
| Subtotal Spent on Operations | $126 | $5,762 | $5,385 | $5,385 | $6,353 | $33,989 | $20,771 | $13,857 | $14,823 | $16,452 | $19,286 | $25,119 | |
| Additional Cash Spent | |||||||||||||
| Sales Tax, VAT, HST/GST Paid Out | $0 | $0 | $0 | $0 | $0 | $0 | $0 | $0 | $0 | $0 | $0 | $0 | |
| Principal Repayment of Current Borrowing | $0 | $0 | $0 | $0 | $0 | $0 | $0 | $0 | $0 | $0 | $0 | $0 | |
| Other Liabilities Principal Repayment | $0 | $0 | $0 | $0 | $0 | $0 | $0 | $0 | $0 | $0 | $0 | $0 | |
| Long-term Liabilities Principal Repayment | $0 | $0 | $0 | $0 | $0 | $0 | $0 | $0 | $0 | $0 | $0 | $0 | |
| Purchase Other Current Assets | $0 | $0 | $0 | $0 | $0 | $0 | $0 | $0 | $0 | $0 | $0 | $0 | |
| Purchase Long-term Assets | $0 | $0 | $0 | $0 | $0 | $0 | $0 | $0 | $0 | $0 | $0 | $0 | |
| Dividends | $0 | $0 | $0 | $0 | $0 | $0 | $0 | $0 | $0 | $0 | $0 | $0 | |
| Subtotal Cash Spent | $126 | $5,762 | $5,385 | $5,385 | $6,353 | $33,989 | $20,771 | $13,857 | $14,823 | $16,452 | $19,286 | $25,119 | |
| Net Cash Flow | ($126) | ($5,762) | ($5,385) | ($5,385) | ($6,353) | ($29,789) | ($10,911) | $624 | $9,017 | $15,648 | $27,014 | $42,441 | |
| Cash Balance | $83,774 | $78,012 | $72,627 | $67,242 | $60,889 | $31,100 | $20,189 | $20,813 | $29,830 | $45,478 | $72,491 | $114,933 | |
| Pro Forma Balance Sheet | |||||||||||||
| Month 1 | Month 2 | Month 3 | Month 4 | Month 5 | Month 6 | Month 7 | Month 8 | Month 9 | Month 10 | Month 11 | Month 12 | ||
| Assets | Starting Balances | ||||||||||||
| Current Assets | |||||||||||||
| Cash | $83,900 | $83,774 | $78,012 | $72,627 | $67,242 | $60,889 | $31,100 | $20,189 | $20,813 | $29,830 | $45,478 | $72,491 | $114,933 |
| Accounts Receivable | $0 | $0 | $0 | $0 | $0 | $0 | $1,800 | $5,940 | $9,460 | $13,620 | $19,520 | $27,220 | $39,660 |
| Inventory | $0 | $0 | $0 | $0 | $0 | $0 | $700 | $1,000 | $1,100 | $1,540 | $2,090 | $2,970 | $4,400 |
| Other Current Assets | $15,000 | $15,000 | $15,000 | $15,000 | $15,000 | $15,000 | $15,000 | $15,000 | $15,000 | $15,000 | $15,000 | $15,000 | $15,000 |
| Total Current Assets | $98,900 | $98,774 | $93,012 | $87,627 | $82,242 | $75,889 | $48,600 | $42,129 | $46,373 | $59,990 | $82,088 | $117,681 | $173,993 |
| Long-term Assets | |||||||||||||
| Long-term Assets | $0 | $0 | $0 | $0 | $0 | $0 | $0 | $0 | $0 | $0 | $0 | $0 | $0 |
| Accumulated Depreciation | $0 | $250 | $500 | $750 | $1,000 | $1,250 | $1,500 | $1,750 | $2,000 | $2,250 | $2,500 | $2,750 | $3,000 |
| Total Long-term Assets | $0 | ($250) | ($500) | ($750) | ($1,000) | ($1,250) | ($1,500) | ($1,750) | ($2,000) | ($2,250) | ($2,500) | ($2,750) | ($3,000) |
| Total Assets | $98,900 | $98,524 | $92,512 | $86,877 | $81,242 | $74,639 | $47,100 | $40,379 | $44,373 | $57,740 | $79,588 | $114,931 | $170,993 |
| Liabilities and Capital | Month 1 | Month 2 | Month 3 | Month 4 | Month 5 | Month 6 | Month 7 | Month 8 | Month 9 | Month 10 | Month 11 | Month 12 | |
| Current Liabilities | |||||||||||||
| Accounts Payable | $0 | $3,649 | $3,272 | $3,272 | $3,272 | $31,354 | $18,410 | $10,464 | $11,378 | $12,915 | $15,583 | $20,406 | $49,658 |
| Current Borrowing | $0 | $0 | $0 | $0 | $0 | $0 | $0 | $0 | $0 | $0 | $0 | $0 | $0 |
| Other Current Liabilities | $0 | $0 | $0 | $0 | $0 | $0 | $0 | $0 | $0 | $0 | $0 | $0 | $0 |
| Subtotal Current Liabilities | $0 | $3,649 | $3,272 | $3,272 | $3,272 | $31,354 | $18,410 | $10,464 | $11,378 | $12,915 | $15,583 | $20,406 | $49,658 |
| Long-term Liabilities | $0 | $0 | $0 | $0 | $0 | $0 | $0 | $0 | $0 | $0 | $0 | $0 | $0 |
| Total Liabilities | $0 | $3,649 | $3,272 | $3,272 | $3,272 | $31,354 | $18,410 | $10,464 | $11,378 | $12,915 | $15,583 | $20,406 | $49,658 |
| Paid-in Capital | $100,000 | $100,000 | $100,000 | $100,000 | $100,000 | $100,000 | $100,000 | $100,000 | $100,000 | $100,000 | $100,000 | $100,000 | $100,000 |
| Retained Earnings | ($1,100) | ($1,100) | ($1,100) | ($1,100) | ($1,100) | ($1,100) | ($1,100) | ($1,100) | ($1,100) | ($1,100) | ($1,100) | ($1,100) | ($1,100) |
| Earnings | $0 | ($4,025) | ($9,660) | ($15,295) | ($20,930) | ($55,615) | ($70,210) | ($68,985) | ($65,905) | ($54,075) | ($34,895) | ($4,375) | $22,435 |
| Total Capital | $98,900 | $94,875 | $89,240 | $83,605 | $77,970 | $43,285 | $28,690 | $29,915 | $32,995 | $44,825 | $64,005 | $94,525 | $121,335 |
| Total Liabilities and Capital | $98,900 | $98,524 | $92,512 | $86,877 | $81,242 | $74,639 | $47,100 | $40,379 | $44,373 | $57,740 | $79,588 | $114,931 | $170,993 |
| Net Worth | $98,900 | $94,875 | $89,240 | $83,605 | $77,970 | $43,285 | $28,690 | $29,915 | $32,995 | $44,825 | $64,005 | $94,525 | $121,335 |


