
Market Plaza Showplace
Executive Summary
Family Fair, Incorporated desires to purchase the vacant Market Plaza Theater and operate it as the “Market Plaza Showplace” (Showplace), a live performance center in the densely populated Market Plaza community of Trinity, Texas. The facility is located amid retail shops and restaurants in the thriving Market Plaza Business Center, Family Fair will restore it for qualification as a historical landmark. There is no operation of this type in the immediate area, and live entertainment available in the community is limited to local clubs and bars.
The Showplace will offer high-quality, wholesome, and affordable live entertainment in a clean, quaint, and elegant facility. It will bring family-oriented live entertainment to those in the community who would otherwise travel to other cities for such enjoyment.
The operation will generate immediate cash and an excellent return for its shareholders. Revenues projected in this plan are based conservatively on two regular shows per week and a minimum of special events. No revenue is projected for special artist showcases, weekday “Branson, Missouri” type productions, or holiday season special presentations. In addition to revenues generated by regular showcases, the facility will be marketed to large businesses for special corporate events and will be available for special private event scheduling. Other revenue producing operations will be added later, such as audio and video recording services, sponsored broadcasts, and possible syndication of productions.
The Family Fair executive team has the expertise, experience, and commitment to make the venture a highly successful operation. The venue will quickly become an entertainment “hot spot” in the Southwest with national exposure. Supporting financial information is included in the appendix.
1.1 Mission
Family Fair, Inc. produces high quality, affordable entertainment in the elegant Market Plaza Showplace. It brings family-oriented live entertainment in a private function facility accessible to those who would otherwise travel out of the community to enjoy similar activities. The operation makes exceptional profit and generates immediate cash. It provides a glamorous and rewarding work environment for performers and employees, an excellent return to its owners, and offers entertainment events to remember and frequent.
1.2 Objectives
- To launch the venue with a highly publicized “Grand Opening” event.
- To produce a healthy net profit in the first year of operation.
- To double gross sales by the second year of operation.
Company Summary
Family Fair, Inc. is a new company that will provide live entertainment and a special events facility in a former movie theater. The facility is located in a thriving business center in the midst of a densely and diversely populated community in Trinity, Texas. The operation focuses primarily on:
- Providing regular live musical entertainment in a variety of family-oriented, wholesome themes from country music to Hispanic, pop, blues, gospel, and “Branson, Missouri” type legends productions.
- Providing a live performance center not already available in the community.
2.1 Company Ownership
Family Fair, Inc. will be created as a closely-held private Texas S corporation based in Trinity County, to be owned by its founder and principal investors. The founder, Mary Ellen Garner, is seeking private investors for funding 35% of the project and holding a 35% share of the company. Ms. Garner currently owns Pro Power Productions, a small but successful company specializing in sound recording production, artist development, and concert promotion which would become a DBA of Family Fair, Inc.
2.2 Start-up Summary
Of the projected start-up expenses, a little less than half are consultant fees. The remainder are professional fees (legal, accounting, stationery, advertising for opening event, office rent, expensed equipment, start-up salaries, and contingencies. The founder and Board of Directors will finance a portion of the start-up expenses.
The cost of start-up assets needed comes to $979,000 which includes $550,000 for facility purchase, $373,000 for facility rehabilitation and operating equipment, and $56,000 for initial operating capital and prepaid expenses.
Start-up financing is planned as follows: The founder of Family Fair, a minority female, and the Board of Directors will invest toward start-up expenses. The company is seeking private investors for another portion of the total funding required with proportionate ownership of the company. It is planned to seek a low-interest, long-term mortgage for the improved facility. The founder and majority stockholder, Mary Garner, qualifies as a minority female business owner with excellent credit history, and is eligible for the best interest rate and terms with the SBA or other mortgage companies. As an option for investors to secure their investment with real estate equity, the mortgage will be negotiated as transferable to investors.
These assumptions are shown in the following table.

| Start-up | |
| Requirements | |
| Start-up Expenses | |
| Legal | $8,000 |
| Accounting Services | $2,000 |
| Licenses and Fees | $1,000 |
| Stationery etc. | $500 |
| Printing and Reprographics | $1,000 |
| Consultants | $40,000 |
| Rent | $1,700 |
| Advertisement | $2,000 |
| Expensed equipment | $1,000 |
| Start Up Salaries | $15,000 |
| Other | $11,000 |
| Total Start-up Expenses | $83,200 |
| Start-up Assets | |
| Cash Required | $52,500 |
| Other Current Assets | $6,000 |
| Long-term Assets | $923,000 |
| Total Assets | $981,500 |
| Total Requirements | $1,064,700 |
| Start-up Funding | |
| Start-up Expenses to Fund | $83,200 |
| Start-up Assets to Fund | $981,500 |
| Total Funding Required | $1,064,700 |
| Assets | |
| Non-cash Assets from Start-up | $929,000 |
| Cash Requirements from Start-up | $52,500 |
| Additional Cash Raised | $0 |
| Cash Balance on Starting Date | $52,500 |
| Total Assets | $981,500 |
| Liabilities and Capital | |
| Liabilities | |
| Current Borrowing | $0 |
| Long-term Liabilities | $639,200 |
| Accounts Payable (Outstanding Bills) | $2,500 |
| Other Current Liabilities (interest-free) | $0 |
| Total Liabilities | $641,700 |
| Capital | |
| Planned Investment | |
| Helen R. Gaeta, Founder | $48,000 |
| Investor Group | $375,000 |
| Additional Investment Requirement | $0 |
| Total Planned Investment | $423,000 |
| Loss at Start-up (Start-up Expenses) | ($83,200) |
| Total Capital | $339,800 |
| Total Capital and Liabilities | $981,500 |
| Total Funding | $1,064,700 |
2.3 Company Locations and Facilities
The Market Plaza Theater is located at 150 Market Plaza in Trinity, Texas. Family Fair proposes to purchase the 11,385 sq. ft. building and associated land area (18,923 sq. ft.).
The facility is structurally sound and was built in 1946 for movie theater operations. The theater property also includes a large neon lighted art-deco marquee-type sign near the busy intersection. A commercial appraisal has not been acquired by Family Fair, but the purchase price of the facility and associated real estate is consistent with current tax appraisal for the vacant facility. A commercial appraisal will be arranged upon request by a potential investor or mortgagor.
The rehabilitation of the facility will be accomplished in a manner consistent with city guidelines to qualify as an historical landmark which will provide a moratorium on city property taxes for 10 years. The Trinity Historical Society is anxious to sponsor this theater as an historical landmark. Internally, the theater will be renovated (seats restored, stage constructed, etc.) and the latest technology in sound and lighting equipment will be added. Dressing room facilities will be constructed in the renovation phase of rehabilitation.
Services
The Showplace will offer live, wholesome entertainment in a quaint former movie theater in a densely populated community. Regular entertainment events will offer exciting presentations that will begin the moment a patron enters the facility, even before the main event. This type of entertainment is not available in the area at this time.
Family Fair will solicit, arrange and host corporate and private special events in the Showplace facility.
Family Fair will add other revenue producing services to compliment the base operation, such as local merchant advertising, special presentations, audio and video recording services, and other logical services as the demand arises.
3.1 Service Description
- The Showplace offers family-oriented entertainment in the form of regular live musical performances by local and touring artists and musicians. The average price is $12.00 per ticket. The venue will interest the majority of the area population because of the variety of show themes to be offered. The venue fills the need for a performance center in the community.
- The location and appeal of the Showplace facility offers Family Fair the opportunity to solicit, arrange, and host corporate special events. Pricing of this service will vary depending on the number of persons to be accommodated, food or refreshment catering, or other special requirements of the event. Trinity has a large business community and those businesses often use outside facilities for special events. We will market our venue to be included on the off-site preferred list of the majority of large businesses in the area.
- As in any community, special private events are celebrated by individuals, families, clubs, and other groups in the population. The Showplace facility offers a clean, quaint, and elegant setting, from the dining hall to the 750 seat auditorium. The facility will be more appealing than special events held in church annexes and will be more cost-effective and private than hotel facilities. The pricing for this service will depend on the number of guests, catering, and other requirements.

3.2 Competitive Comparison
Offerings of the Showplace are similar to those in outlying communities who offer live musical performances each weekend. However, their themes are fixed, where ours will be a variety of musical themes, along with ongoing interactive features (magicians, etc.) for appeal to the diverse Market Plaza community. The Showplace ticket pricing is within the price range of other venues with similar offerings.
The quality of entertainment will be superior to other venues and Family Fair will assure that the appeal of the productions will not become stale. The competition offers the same entertainers and the same themes each week. It is not appealing to see the same show many times over.
The Family Fair executive team enjoys association with the most talented local musicians as well as touring groups to assure an exciting variety of entertainment. The team also enjoys close associations with nationally known entertainers, musicians and producers.
3.3 Sales Literature
The Showplace Sales literature will consist mostly of flyers for distribution in hotel lobbies, retail store stands or direct mailing. An attractive website will provide details of offerings, scheduling, and convenient ticket purchase. Early on, brochures will be developed for distribution to potential corporate customers and tourist agencies.
3.4 Fulfillment
Family Fair intends to use the entertainment associations of the executive team to acquire the services of the best musicians and artists available. The cost of these entertainers is negotiable but is conservatively calculated at 35% of ticket sales. The cost of local entertainers and musicians will be a weekly expenditure, but regular employment will allow negotiation of lower rates due to stability and benefits offered by Family Fair.
3.5 Technology
The Showplace will be equipped with the latest technology in sound and lighting, both of which will be of substantial appeal to customers. Fixtures and equipment accommodations for corporate and private events will be appealing and effective. Internet technology such as ticketing reservations, entertainment schedules and an entertainer slate will be provided.
3.6 Future Services
Family Fair will add other revenue producing services to compliment the base operation. These are not included in the financial plan. Some of the potential future services are listed below.
- Weekday showcases and special holiday events.
- Local merchant advertising will include space on our billboard sign in the business center, will be announced during performances, and will be displayed in the theater.
- Video recordings of artist showcases to be used in promoting their careers in entertainment.
- Professional record album and demo audio recording services. Family Fair will be in a prime position to secure a share of this business due to location and strong associations with artists (both amateur and professional). Opportunities to negotiate this aspect of the business will be constant with artists appearing at the Showplace.
- Syndication of programs for distribution to broadcast media, both domestically and internationally.
- Sponsored programs for radio and television broadcast.
Market Analysis Summary
Family Fair will focus on families and music lovers within the community who frequent such entertainment and also on large businesses to host their special corporate functions. Our most important potential customers are families and young adults who would rather frequent productions in the community than travel several miles for similar entertainment. The numerous “guest home” residences for elderly citizens will be solicited for inclusion on their preferred list of organized entertainment activities for their residents.
4.1 Market Segmentation
- Families and young adults: Our most important market segment is citizens who desire quality and affordable entertainment in the community. These citizens will be frequenting the regularly scheduled entertainment (primarily music showcases) in Market Plaza to avert driving on freeways to other venues or in downtown traffic with difficult (and generally unsafe) parking conditions.
- Large businesses and corporations: Our second most important segment is businesses, particularly those who frequently choose outside facilities for special events and celebrations. Family Fair will offer custom entertainment and food service for special events.

| Market Analysis | |||||||
| Year 1 | Year 2 | Year 3 | Year 4 | Year 5 | |||
| Potential Customers | Growth | CAGR | |||||
| Community Population | 2% | 363,837 | 371,114 | 378,536 | 386,107 | 393,829 | 2.00% |
| Large Business | 10% | 500 | 550 | 605 | 666 | 733 | 10.04% |
| Total | 2.01% | 364,337 | 371,664 | 379,141 | 386,773 | 394,562 | 2.01% |
4.2 Target Market Segment Strategy
The Showplace cannot survive just waiting for the customer to come to us. Instead, the executive staff must become experts at focusing on the specific market segments whose needs match our offerings. Focusing on targeted segments is the key to our future.
Therefore, we need to focus on our marketing message and entertainment offerings. We must develop our message, communicate it, and make good on it.
4.2.1 Market Trends
Trinity and the surrounding areas have produced several super-star recording artists in the last few years. Most of these acts got their amateur start and professional development by performing in area events like those offered by the Showplace. Having witnessed the good fortune of these artists, potential customers are aware that it could happen again at any time, and that the area is blessed with great talent. They are eager to frequent events where a potential super-star artist performs because it is so much easier to become personal acquaintances with them now than when they move up in their career. The keys to success are to communicate the message that the best of talent will be included in each event and make sure to do so.
4.2.2 Market Growth
The population of the Market Plaza community is expected to remain constant with modest growth due to multi-family development activity. The Showplace expects market growth to occur from outlying suburbs when the word of quality entertainment spreads. Market growth is also expected through solicitation of tour agencies bringing groups through Trinity on senior or institutional tours. Trinity is noted for its business attractions and the addition of large business relocations to the area continues in a big way. Additional large businesses will add to the potential customers for special corporate events.
4.2.3 Market Needs
The Market Plaza community in Trinity, Texas is a densely and diversely populated urban area. Currently, there is not a live performance center in the community for public attendance or private use. The Market Plaza Theater is strategically located in a thriving business center amid numerous popular restaurants and shops. Patrons of this center love its quaintness, physical appeal, and convenience within their community. Personal interviews with patrons of the center indicate a strong desire to see the vacant theater restored for local entertainment offerings.
4.3 Service Business Analysis
Live entertainment available to the community consists of numerous offerings, from broadcast media to high profile concerts in the region. One of Family Fair’s challenges will be establishing our venue as the premier entertainment in the community, offering consistent, high quality entertainment in a clean and appealing facility, and making each event one to remember and frequent. Another challenge will be to attract clients to the facility for scheduling special corporate and private events.
4.3.1 Competition and Buying Patterns
The key element in purchase decisions made by Showplace clients is knowledge that the modest cost of a night of quality entertainment at a location near home is ideal.
Pricing of this type of entertainment varies from $10 to more than $100 in the region. A number of families and individuals are usually willing to pay the ticket price, but the drive to events out of the community and difficult parking accommodations take some of the enjoyment out of the whole affair.
Potential customers currently travel well outside the community to enjoy this style of entertainment. After the Showplace grand opening event, word of mouth recommendations will fill each show from the community, almost immediately. They will select our venue to avoid the drive to other similar events in the region.
4.3.2 Main Competitors
The following is a list of main competitors offering productions similar to the Showplace.
- Local night clubs: Strengths–serve alcohol for those inclined. Weaknesses–limited seating capacity, limited age groups, dangerous environment.
- Major artist concerts: Strengths–live performances by major artists. Weaknesses–high ticket costs, excessive travel, unsecure parking accommodations, and infrequent events.
- Johnny Good’s Music Revue and Grapefield Opry: Strengths–age of business and good quality entertainment at a reasonable cost. Weaknesses–35 miles from the Market Plaza community, limited parking, constant country music theme, average musicians, and ticket availability concerns.
4.3.3 Business Participants
Some communities in the Trinity suburbs have successful weekend venues similar to the Showplace. Live entertainment in urban Trinity, particularly for this community, comes in the form of costly concerts that are either inconvenient or in local nightclubs. The wholesome, family-oriented offering of the Market Plaza Showplace will be welcomed in the community by those who would not frequent night clubs and major artist concerts, and would also be frequented by others because of the reasonable cost and level of talent.
Strategy and Implementation Summary
The Showplace will focus on the general population of the community and surrounding region, and large businesses in the DFW area. Location of the theater facility affords the strongest initial sales factor, then the quality and service of our operation will build strong loyalty and repeat customers. Our productions must live up to our message.
The Family Fair marketing team will initially blitz the community and region with announcements of the grand opening via radio, TV news, newspapers, local publications, solicitation, direct mail, personal calls, email, and fax. We will reach the majority of the area population who will eagerly spread the word.
The theater owns a huge sign that is strategically located at one of the busiest intersections in Trinity. The grand opening announcement will begin on the theater marquee approximately one month before opening.
5.1 Competitive Edge
The main competitor is 35 miles from the community and is sold out regularly. The route is in heavy traffic and parking is sometimes a problem. Therefore, fans of this type of entertainment in our community are expected to choose our venue because we offer more interesting entertainment, we are closer to home, have ample, secure parking, and ticket pricing is the same.
5.2 Sales Strategy
Consistent sales in the live entertainment business depends on quality entertainment at a reasonable price, along with efficient and friendly service. Showplace entertainers and staff will be required to extend exceptional courtesy to customers prior to, during and after each presentation.
The operation must always be sure to provide enjoyable, exciting and quality entertainment as well as excellence and courtesy in performing our ticketing and concession services. Special personal attention will be extended to our customers at all times. Quality entertainment and friendly service will greatly enhance loyalty to the venue.
5.2.1 Sales Forecast
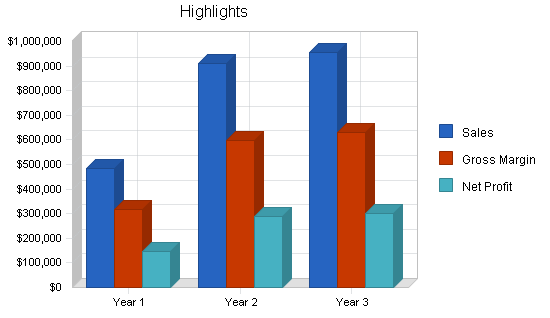
Family Fair senior management prefers to use a conservative sales figure of 700 seats of 750 available per regular production in the first year. Consultants predict a sell-out for each show, beginning in the first month of operation, due to the prime location of the Showplace facility and the small percentage of the population required to produce a sell-out. Also, severe weather is not a major problem in this region and was discounted as a deterrent to attendance. The proximity of the venue to potential customers in the densely populated community is a powerful influence. However, to be conservative, we are projecting sales of 700 seats per show for the first year of the available 750 seats.


| Sales Forecast | |||
| Year 1 | Year 2 | Year 3 | |
| Sales | |||
| Event Ticket Sales | $470,400 | $864,000 | $864,000 |
| Other | $14,000 | $48,000 | $90,000 |
| Total Sales | $484,400 | $912,000 | $954,000 |
| Direct Cost of Sales | Year 1 | Year 2 | Year 3 |
| Event Ticket Sales | $164,640 | $302,400 | $302,400 |
| Other | $3,500 | $12,000 | $22,500 |
| Subtotal Direct Cost of Sales | $168,140 | $314,400 | $324,900 |
5.3 Milestones
The accompanying table lists important project milestones, with dates and managers in charge, and budgets for each. The milestone schedule indicates our emphasis on planning for implementation.
What the table doesn’t show is the commitment behind it and the ability of the executive team to make the project a complete success. Our business plan includes complete provisions for plan-vs.-actual analysis, and the executive staff will meet regularly to discuss the variance and course corrections.

| Milestones | |||||
| Milestone | Start Date | End Date | Budget | Manager | Department |
| Theater and event consulting | 2/1/2000 | 12/31/2000 | $37,500 | CEO | Executive |
| Business Plan | 7/1/2000 | 12/31/2000 | $2,500 | COO | Executive |
| Licenses and fees | 2/1/2001 | 6/1/2001 | $1,000 | CEO | Executive |
| Professional fees | 2/1/2001 | 6/1/2001 | $10,000 | CEO | Executive |
| Facility Purchase and Closing | 2/15/2001 | 2/28/2001 | $550,000 | CEO | Executive |
| Phase 1 – Facility Rehabilitation | 2/28/2001 | 3/21/2001 | $45,668 | COO | Executive |
| Phase 2 – Facility Rehabilitation | 3/21/2001 | 4/15/2001 | $53,468 | COO | Executive |
| Phase 3 – Facility Rehabilitation | 4/15/2001 | 4/30/2001 | $64,508 | COO | Executive |
| Phase 4 – Facility Rehabilitation | 4/30/2001 | 5/15/2001 | $35,288 | COO | Executive |
| Phase 5 – Facility Rehabilitation | 5/15/2001 | 5/31/2001 | $47,648 | COO | Executive |
| Completion Payment | 6/1/2001 | 6/1/2001 | $39,365 | CEO | Executive |
| Equipment Installation | 6/1/2001 | 6/1/2001 | $63,000 | COO | Executive |
| Advertising & Promotion | 6/1/2001 | 6/1/2001 | $2,000 | Marketing | Executive |
| Prepaid Expenses (Deposits) | 6/1/2001 | 6/1/2001 | $6,000 | CEO | Executive |
| Totals | $957,945 | ||||
Management Summary
The executive management team will consist of majority owner, Mary Ellen Garner, a highly-educated Hispanic female, Marvin E. Carter, former professional musician, businessman, studio owner, record producer and concert promoter, Preston C. Porter, seasoned businessman and investor, Paul DuPont, sound engineer, producer, performing professional musician, and Greg Freeland, music director in Branson, Missouri and performing professional musician.
All members of the executive team have extensive experience, expertise, and network associations in business, education, and all aspects of the entertainment industry. Ms. Garner is Chairman and Chief Executive Officer, Mr. Carter will assume the position of President and Chief Operator, Mr. Porter will assume the position of Vice President and Treasurer and direct the banking and administration activities, Mr. DuPont will direct marketing and administration, and Mr. Freeland will direct the music and event functions. The board of directors will be elected by Ms. Garner and other shareholders from a community of qualified individuals.
Accounting services will be provided by Mercer, Mills and Kern of Trinity, and legal services will be provided by Redford & Marshall, Fort Worth, and Ronald P. Bricker, Attorney, Trinity.
6.1 Organizational Structure
Family Fair, Dba Market Plaza Showplace, has a simple proposed organization. The following is an outline of the proposed organization and responsibilities.
Board of Directors:(Final Board to be elected)
Executive and Operating Team (To be approved by Board of Directors):
Mary Ellen Garner: Founder and Director, President and CEO
Responsibilities include the overall legal and financial affairs of the business.Marvin E. Carter: Director, Executive Vice President and Chief Operator
Responsibilities include start-up improvements and overall operating activities.Preston C. Porter: Director, Vice President and Treasurer
Responsibilities will include banking and financial matters, human resources and administration.Paul DuPont: Director of Marketing and Sales
Responsibilities include overall sales and marketing activities of the operation.Greg Freeland: Director of Music and Events
Responsibilities include musical arrangements, events productions and tour agency relations.
6.2 Personnel Plan
The following table summarizes our executive personnel expenditures for the first three years. Other staff is considered in the cost of sales calculation and will consist of entertainers, musicians, and event staff. Head count and cost for entertainers and event staff employees are not shown in the Personnel Plan table.
| Personnel Plan | |||
| Year 1 | Year 2 | Year 3 | |
| President, CEO | $7,000 | $12,000 | $12,000 |
| Executive VP, Chief Operator | $7,000 | $12,000 | $12,000 |
| VP & Treasurer | $7,000 | $12,000 | $12,000 |
| Director, Marketing & Sales | $23,335 | $40,000 | $40,000 |
| Director, Events & Music | $29,165 | $50,000 | $50,000 |
| Ticket Agent | $7,000 | $24,000 | $36,000 |
| Total People | 6 | 7 | 8 |
| Total Payroll | $80,500 | $150,000 | $162,000 |
Financial Plan
The base operation is a “cash cow” with no accounts receivable or the burdensome collection efforts that accompany A/R management. Future services will be added with positive financial impact to the base operation when opportunities arise.
We expect to add revenue-producing services and activities during the first year that have not been covered in this business plan. These services will be a natural compliment to our operation and significantly add to our base revenue from regular productions. They include audio and video recording services, possible syndication of productions, sponsored radio and/or TV programs, and advertising for local merchants. Financing for new services will be arranged through cash flow, sponsorship, or outside interests.
7.1 Important Assumptions
The financial plan assumes private investor funding, a 15-year facility mortgage and founder investment for consultants, travel, business plan, and other planning costs.
Once in operation, the business will be self-sustaining and require no further financial assistance for this plan. General assumptions follow:
7.2 Break-even Analysis
The following chart and table summarize our Break-even Analysis. We have decided to treat fixed costs for this start-up plan to include the normal running costs each month for a more practical analysis. The average price per unit assumes that standard ticket prices will be $13.00 adults, $12.00 seniors and $11.00 for children under 12 years of age. The variable cost per unit assumes artist and musician fees and sales taxes to average $4.20 per ticket sold. Considering the start-up costs and the conservative position of the plan, we don’t expect to reach break-even until several months into the business operation.
The break-even assumes variable costs as shown below. This assumption is probably too high, and therefore conservative, because it is based on the highest local pay scale for musicians and artists. We will employ high-quality musicians for less than the maximum pay scale.
Also, the effects of additional revenue opportunities are not considered in the Break-even Analysis. The executive team will actively pursue other revenue producing opportunities and expect substantial success in this effort.

| Break-even Analysis | |
| Monthly Revenue Break-even | $20,684 |
| Assumptions: | |
| Average Percent Variable Cost | 35% |
| Estimated Monthly Fixed Cost | $13,504 |
7.3 Projected Profit and Loss
Our projected profit and loss is shown on the following table projecting a reasonable profit the first year. Revenues are conservative as they include only the base operation (two shows per week) and minimal special event hosting. The executive team believes that actual experience will include a minimum of three shows per week with the possibility of daily successful shows and or special events. Increases in the base operation in the second and third years consider sold out performances and additional special and private events.
Our cost of sales should be somewhat lower, and gross margin higher, than in this projection due to our commitment to careful management of entertainer and musician costs. However, we prefer to project conservative so that we maintain a positive cash flow and to allow for less than expected performance.
Dividends are not applicable in an S Corporation. Net earnings are distributed directly to shareholders. However the company will consider shareholder requests to defer income or provide pretax investment opportunities.
The detailed monthly projections are included in the appendix.


| Pro Forma Profit and Loss | |||
| Year 1 | Year 2 | Year 3 | |
| Sales | $484,400 | $912,000 | $954,000 |
| Direct Cost of Sales | $168,140 | $314,400 | $324,900 |
| Other | $0 | $0 | $0 |
| Total Cost of Sales | $168,140 | $314,400 | $324,900 |
| Gross Margin | $316,260 | $597,600 | $629,100 |
| Gross Margin % | 65.29% | 65.53% | 65.94% |
| Expenses | |||
| Payroll | $80,500 | $150,000 | $162,000 |
| Sales and Marketing and Other Expenses | $35,000 | $60,000 | $60,000 |
| Depreciation | $0 | $0 | $0 |
| Leased Equipment | $3,500 | $6,000 | $6,000 |
| Utilities | $14,000 | $24,000 | $24,000 |
| Insurance | $7,000 | $12,000 | $12,000 |
| Rent | $5,950 | $10,200 | $10,200 |
| Payroll Taxes | $16,100 | $30,000 | $32,400 |
| Other | $0 | $0 | $0 |
| Total Operating Expenses | $162,050 | $292,200 | $306,600 |
| Profit Before Interest and Taxes | $154,210 | $305,400 | $322,500 |
| EBITDA | $154,210 | $305,400 | $322,500 |
| Interest Expense | $0 | $0 | $0 |
| Taxes Incurred | $7,711 | $15,270 | $22,844 |
| Net Profit | $146,500 | $290,130 | $299,656 |
| Net Profit/Sales | 30.24% | 31.81% | 31.41% |
7.4 Projected Cash Flow
The monthly cash flow for the first year is shown in the illustration. The cash flow does not reflect distribution of earnings in the three years depicted. Shareholders may elect full distribution, partial distribution or pretax investment options to be made available by the company. The table that follows includes annual amounts only.

| Pro Forma Cash Flow | |||
| Year 1 | Year 2 | Year 3 | |
| Cash Received | |||
| Cash from Operations | |||
| Cash Sales | $484,400 | $912,000 | $954,000 |
| Subtotal Cash from Operations | $484,400 | $912,000 | $954,000 |
| Additional Cash Received | |||
| Sales Tax, VAT, HST/GST Received | $0 | $0 | $0 |
| New Current Borrowing | $0 | $0 | $0 |
| New Other Liabilities (interest-free) | $0 | $0 | $0 |
| New Long-term Liabilities | $0 | $0 | $0 |
| Sales of Other Current Assets | $0 | $0 | $0 |
| Sales of Long-term Assets | $0 | $0 | $0 |
| New Investment Received | $0 | $0 | $0 |
| Subtotal Cash Received | $484,400 | $912,000 | $954,000 |
| Expenditures | Year 1 | Year 2 | Year 3 |
| Expenditures from Operations | |||
| Cash Spending | $80,500 | $150,000 | $162,000 |
| Bill Payments | $224,355 | $468,632 | $490,661 |
| Subtotal Spent on Operations | $304,855 | $618,632 | $652,661 |
| Additional Cash Spent | |||
| Sales Tax, VAT, HST/GST Paid Out | $0 | $0 | $0 |
| Principal Repayment of Current Borrowing | $0 | $0 | $0 |
| Other Liabilities Principal Repayment | $0 | $0 | $0 |
| Long-term Liabilities Principal Repayment | $0 | $0 | $0 |
| Purchase Other Current Assets | $0 | $0 | $0 |
| Purchase Long-term Assets | $0 | $0 | $0 |
| Dividends | $0 | $0 | $0 |
| Subtotal Cash Spent | $304,855 | $618,632 | $652,661 |
| Net Cash Flow | $179,545 | $293,368 | $301,339 |
| Cash Balance | $232,045 | $525,413 | $826,752 |
7.5 Projected Balance Sheet
The balance sheet in the following table shows an attractive growth of net worth, and a healthy financial position with the conservative plan. The executive team believes and has the commitment to exceed the position projected in this plan. The monthly estimates are included in the appendix.
| Pro Forma Balance Sheet | |||
| Year 1 | Year 2 | Year 3 | |
| Assets | |||
| Current Assets | |||
| Cash | $232,045 | $525,413 | $826,752 |
| Other Current Assets | $6,000 | $6,000 | $6,000 |
| Total Current Assets | $238,045 | $531,413 | $832,752 |
| Long-term Assets | |||
| Long-term Assets | $923,000 | $923,000 | $923,000 |
| Accumulated Depreciation | $0 | $0 | $0 |
| Total Long-term Assets | $923,000 | $923,000 | $923,000 |
| Total Assets | $1,161,045 | $1,454,413 | $1,755,752 |
| Liabilities and Capital | Year 1 | Year 2 | Year 3 |
| Current Liabilities | |||
| Accounts Payable | $35,546 | $38,784 | $40,467 |
| Current Borrowing | $0 | $0 | $0 |
| Other Current Liabilities | $0 | $0 | $0 |
| Subtotal Current Liabilities | $35,546 | $38,784 | $40,467 |
| Long-term Liabilities | $639,200 | $639,200 | $639,200 |
| Total Liabilities | $674,746 | $677,984 | $679,667 |
| Paid-in Capital | $423,000 | $423,000 | $423,000 |
| Retained Earnings | ($83,200) | $63,300 | $353,430 |
| Earnings | $146,500 | $290,130 | $299,656 |
| Total Capital | $486,300 | $776,430 | $1,076,086 |
| Total Liabilities and Capital | $1,161,045 | $1,454,413 | $1,755,752 |
| Net Worth | $486,299 | $776,429 | $1,076,086 |
7.6 Business Ratios
The following are several important business ratios for the years of this plan. Industry profile ratios based on the Standard Industrial Classification (SIC) code 7922, Theatrical Producers and Services, are shown for comparison. No analysis by management is offered at this writing.
| Ratio Analysis | ||||
| Year 1 | Year 2 | Year 3 | Industry Profile | |
| Sales Growth | 0.00% | 88.27% | 4.61% | 15.20% |
| Percent of Total Assets | ||||
| Other Current Assets | 0.52% | 0.41% | 0.34% | 32.50% |
| Total Current Assets | 20.50% | 36.54% | 47.43% | 41.30% |
| Long-term Assets | 79.50% | 63.46% | 52.57% | 58.70% |
| Total Assets | 100.00% | 100.00% | 100.00% | 100.00% |
| Current Liabilities | 3.06% | 2.67% | 2.30% | 34.70% |
| Long-term Liabilities | 55.05% | 43.95% | 36.41% | 27.90% |
| Total Liabilities | 58.12% | 46.62% | 38.71% | 62.60% |
| Net Worth | 41.88% | 53.38% | 61.29% | 37.40% |
| Percent of Sales | ||||
| Sales | 100.00% | 100.00% | 100.00% | 100.00% |
| Gross Margin | 65.29% | 65.53% | 65.94% | 0.00% |
| Selling, General & Administrative Expenses | 35.05% | 33.71% | 33.83% | 74.90% |
| Advertising Expenses | 1.45% | 1.32% | 1.26% | 2.90% |
| Profit Before Interest and Taxes | 31.84% | 33.49% | 33.81% | 2.00% |
| Main Ratios | ||||
| Current | 6.70 | 13.70 | 20.58 | 1.29 |
| Quick | 6.70 | 13.70 | 20.58 | 0.85 |
| Total Debt to Total Assets | 58.12% | 46.62% | 38.71% | 62.60% |
| Pre-tax Return on Net Worth | 31.71% | 39.33% | 29.97% | 2.30% |
| Pre-tax Return on Assets | 13.28% | 21.00% | 18.37% | 6.00% |
| Additional Ratios | Year 1 | Year 2 | Year 3 | |
| Net Profit Margin | 30.24% | 31.81% | 31.41% | n.a |
| Return on Equity | 30.13% | 37.37% | 27.85% | n.a |
| Activity Ratios | ||||
| Accounts Payable Turnover | 7.24 | 12.17 | 12.17 | n.a |
| Payment Days | 27 | 29 | 29 | n.a |
| Total Asset Turnover | 0.42 | 0.63 | 0.54 | n.a |
| Debt Ratios | ||||
| Debt to Net Worth | 1.39 | 0.87 | 0.63 | n.a |
| Current Liab. to Liab. | 0.05 | 0.06 | 0.06 | n.a |
| Liquidity Ratios | ||||
| Net Working Capital | $202,500 | $492,629 | $792,286 | n.a |
| Interest Coverage | 0.00 | 0.00 | 0.00 | n.a |
| Additional Ratios | ||||
| Assets to Sales | 2.40 | 1.59 | 1.84 | n.a |
| Current Debt/Total Assets | 3% | 3% | 2% | n.a |
| Acid Test | 6.70 | 13.70 | 20.58 | n.a |
| Sales/Net Worth | 1.00 | 1.17 | 0.89 | n.a |
| Dividend Payout | 0.00 | 0.00 | 0.00 | n.a |
Appendix
| Personnel Plan | |||||||||||||
| Month 1 | Month 2 | Month 3 | Month 4 | Month 5 | Month 6 | Month 7 | Month 8 | Month 9 | Month 10 | Month 11 | Month 12 | ||
| President, CEO | 0% | $0 | $0 | $0 | $0 | $0 | $1,000 | $1,000 | $1,000 | $1,000 | $1,000 | $1,000 | $1,000 |
| Executive VP, Chief Operator | 0% | $0 | $0 | $0 | $0 | $0 | $1,000 | $1,000 | $1,000 | $1,000 | $1,000 | $1,000 | $1,000 |
| VP & Treasurer | 0% | $0 | $0 | $0 | $0 | $0 | $1,000 | $1,000 | $1,000 | $1,000 | $1,000 | $1,000 | $1,000 |
| Director, Marketing & Sales | 0% | $0 | $0 | $0 | $0 | $0 | $3,333 | $3,333 | $3,333 | $3,333 | $3,333 | $3,333 | $3,337 |
| Director, Events & Music | 0% | $0 | $0 | $0 | $0 | $0 | $4,167 | $4,167 | $4,167 | $4,167 | $4,167 | $4,167 | $4,163 |
| Ticket Agent | 0% | $0 | $0 | $0 | $0 | $0 | $1,000 | $1,000 | $1,000 | $1,000 | $1,000 | $1,000 | $1,000 |
| Total People | 0 | 0 | 0 | 0 | 0 | 6 | 6 | 6 | 6 | 6 | 6 | 6 | |
| Total Payroll | $0 | $0 | $0 | $0 | $0 | $11,500 | $11,500 | $11,500 | $11,500 | $11,500 | $11,500 | $11,500 | |
| Pro Forma Profit and Loss | |||||||||||||
| Month 1 | Month 2 | Month 3 | Month 4 | Month 5 | Month 6 | Month 7 | Month 8 | Month 9 | Month 10 | Month 11 | Month 12 | ||
| Sales | $0 | $0 | $0 | $0 | $0 | $69,200 | $69,200 | $69,200 | $69,200 | $69,200 | $69,200 | $69,200 | |
| Direct Cost of Sales | $0 | $0 | $0 | $0 | $0 | $24,020 | $24,020 | $24,020 | $24,020 | $24,020 | $24,020 | $24,020 | |
| Other | $0 | $0 | $0 | $0 | $0 | $0 | $0 | $0 | $0 | $0 | $0 | $0 | |
| Total Cost of Sales | $0 | $0 | $0 | $0 | $0 | $24,020 | $24,020 | $24,020 | $24,020 | $24,020 | $24,020 | $24,020 | |
| Gross Margin | $0 | $0 | $0 | $0 | $0 | $45,180 | $45,180 | $45,180 | $45,180 | $45,180 | $45,180 | $45,180 | |
| Gross Margin % | 0.00% | 0.00% | 0.00% | 0.00% | 0.00% | 65.29% | 65.29% | 65.29% | 65.29% | 65.29% | 65.29% | 65.29% | |
| Expenses | |||||||||||||
| Payroll | $0 | $0 | $0 | $0 | $0 | $11,500 | $11,500 | $11,500 | $11,500 | $11,500 | $11,500 | $11,500 | |
| Sales and Marketing and Other Expenses | $0 | $0 | $0 | $0 | $0 | $5,000 | $5,000 | $5,000 | $5,000 | $5,000 | $5,000 | $5,000 | |
| Depreciation | $0 | $0 | $0 | $0 | $0 | $0 | $0 | $0 | $0 | $0 | $0 | $0 | |
| Leased Equipment | $0 | $0 | $0 | $0 | $0 | $500 | $500 | $500 | $500 | $500 | $500 | $500 | |
| Utilities | $0 | $0 | $0 | $0 | $0 | $2,000 | $2,000 | $2,000 | $2,000 | $2,000 | $2,000 | $2,000 | |
| Insurance | $0 | $0 | $0 | $0 | $0 | $1,000 | $1,000 | $1,000 | $1,000 | $1,000 | $1,000 | $1,000 | |
| Rent | $0 | $0 | $0 | $0 | $0 | $850 | $850 | $850 | $850 | $850 | $850 | $850 | |
| Payroll Taxes | 20% | $0 | $0 | $0 | $0 | $0 | $2,300 | $2,300 | $2,300 | $2,300 | $2,300 | $2,300 | $2,300 |
| Other | $0 | $0 | $0 | $0 | $0 | $0 | $0 | $0 | $0 | $0 | $0 | $0 | |
| Total Operating Expenses | $0 | $0 | $0 | $0 | $0 | $23,150 | $23,150 | $23,150 | $23,150 | $23,150 | $23,150 | $23,150 | |
| Profit Before Interest and Taxes | $0 | $0 | $0 | $0 | $0 | $22,030 | $22,030 | $22,030 | $22,030 | $22,030 | $22,030 | $22,030 | |
| EBITDA | $0 | $0 | $0 | $0 | $0 | $22,030 | $22,030 | $22,030 | $22,030 | $22,030 | $22,030 | $22,030 | |
| Interest Expense | $0 | $0 | $0 | $0 | $0 | $0 | $0 | $0 | $0 | $0 | $0 | $0 | |
| Taxes Incurred | $0 | $0 | $0 | $0 | $0 | $1,102 | $1,102 | $1,102 | $1,102 | $1,102 | $1,102 | $1,102 | |
| Net Profit | $0 | $0 | $0 | $0 | $0 | $20,929 | $20,929 | $20,929 | $20,929 | $20,929 | $20,929 | $20,929 | |
| Net Profit/Sales | 0.00% | 0.00% | 0.00% | 0.00% | 0.00% | 30.24% | 30.24% | 30.24% | 30.24% | 30.24% | 30.24% | 30.24% | |
| Pro Forma Cash Flow | |||||||||||||
| Month 1 | Month 2 | Month 3 | Month 4 | Month 5 | Month 6 | Month 7 | Month 8 | Month 9 | Month 10 | Month 11 | Month 12 | ||
| Cash Received | |||||||||||||
| Cash from Operations | |||||||||||||
| Cash Sales | $0 | $0 | $0 | $0 | $0 | $69,200 | $69,200 | $69,200 | $69,200 | $69,200 | $69,200 | $69,200 | |
| Subtotal Cash from Operations | $0 | $0 | $0 | $0 | $0 | $69,200 | $69,200 | $69,200 | $69,200 | $69,200 | $69,200 | $69,200 | |
| Additional Cash Received | |||||||||||||
| Sales Tax, VAT, HST/GST Received | 0.00% | $0 | $0 | $0 | $0 | $0 | $0 | $0 | $0 | $0 | $0 | $0 | $0 |
| New Current Borrowing | $0 | $0 | $0 | $0 | $0 | $0 | $0 | $0 | $0 | $0 | $0 | $0 | |
| New Other Liabilities (interest-free) | $0 | $0 | $0 | $0 | $0 | $0 | $0 | $0 | $0 | $0 | $0 | $0 | |
| New Long-term Liabilities | $0 | $0 | $0 | $0 | $0 | $0 | $0 | $0 | $0 | $0 | $0 | $0 | |
| Sales of Other Current Assets | $0 | $0 | $0 | $0 | $0 | $0 | $0 | $0 | $0 | $0 | $0 | $0 | |
| Sales of Long-term Assets | $0 | $0 | $0 | $0 | $0 | $0 | $0 | $0 | $0 | $0 | $0 | $0 | |
| New Investment Received | $0 | $0 | $0 | $0 | $0 | $0 | $0 | $0 | $0 | $0 | $0 | $0 | |
| Subtotal Cash Received | $0 | $0 | $0 | $0 | $0 | $69,200 | $69,200 | $69,200 | $69,200 | $69,200 | $69,200 | $69,200 | |
| Expenditures | Month 1 | Month 2 | Month 3 | Month 4 | Month 5 | Month 6 | Month 7 | Month 8 | Month 9 | Month 10 | Month 11 | Month 12 | |
| Expenditures from Operations | |||||||||||||
| Cash Spending | $0 | $0 | $0 | $0 | $0 | $11,500 | $11,500 | $11,500 | $11,500 | $11,500 | $11,500 | $11,500 | |
| Bill Payments | $2,500 | $0 | $0 | $0 | $0 | $1,226 | $36,772 | $36,772 | $36,772 | $36,772 | $36,772 | $36,772 | |
| Subtotal Spent on Operations | $2,500 | $0 | $0 | $0 | $0 | $12,726 | $48,272 | $48,272 | $48,272 | $48,272 | $48,272 | $48,272 | |
| Additional Cash Spent | |||||||||||||
| Sales Tax, VAT, HST/GST Paid Out | $0 | $0 | $0 | $0 | $0 | $0 | $0 | $0 | $0 | $0 | $0 | $0 | |
| Principal Repayment of Current Borrowing | $0 | $0 | $0 | $0 | $0 | $0 | $0 | $0 | $0 | $0 | $0 | $0 | |
| Other Liabilities Principal Repayment | $0 | $0 | $0 | $0 | $0 | $0 | $0 | $0 | $0 | $0 | $0 | $0 | |
| Long-term Liabilities Principal Repayment | $0 | $0 | $0 | $0 | $0 | $0 | $0 | $0 | $0 | $0 | $0 | $0 | |
| Purchase Other Current Assets | $0 | $0 | $0 | $0 | $0 | $0 | $0 | $0 | $0 | $0 | $0 | $0 | |
| Purchase Long-term Assets | $0 | $0 | $0 | $0 | $0 | $0 | $0 | $0 | $0 | $0 | $0 | $0 | |
| Dividends | $0 | $0 | $0 | $0 | $0 | $0 | $0 | $0 | $0 | $0 | $0 | $0 | |
| Subtotal Cash Spent | $2,500 | $0 | $0 | $0 | $0 | $12,726 | $48,272 | $48,272 | $48,272 | $48,272 | $48,272 | $48,272 | |
| Net Cash Flow | ($2,500) | $0 | $0 | $0 | $0 | $56,474 | $20,929 | $20,929 | $20,929 | $20,929 | $20,929 | $20,929 | |
| Cash Balance | $50,000 | $50,000 | $50,000 | $50,000 | $50,000 | $106,474 | $127,403 | $148,331 | $169,260 | $190,188 | $211,117 | $232,045 | |
| Pro Forma Balance Sheet | |||||||||||||
| Month 1 | Month 2 | Month 3 | Month 4 | Month 5 | Month 6 | Month 7 | Month 8 | Month 9 | Month 10 | Month 11 | Month 12 | ||
| Assets | Starting Balances | ||||||||||||
| Current Assets | |||||||||||||
| Cash | $52,500 | $50,000 | $50,000 | $50,000 | $50,000 | $50,000 | $106,474 | $127,403 | $148,331 | $169,260 | $190,188 | $211,117 | $232,045 |
| Other Current Assets | $6,000 | $6,000 | $6,000 | $6,000 | $6,000 | $6,000 | $6,000 | $6,000 | $6,000 | $6,000 | $6,000 | $6,000 | $6,000 |
| Total Current Assets | $58,500 | $56,000 | $56,000 | $56,000 | $56,000 | $56,000 | $112,474 | $133,403 | $154,331 | $175,260 | $196,188 | $217,117 | $238,045 |
| Long-term Assets | |||||||||||||
| Long-term Assets | $923,000 | $923,000 | $923,000 | $923,000 | $923,000 | $923,000 | $923,000 | $923,000 | $923,000 | $923,000 | $923,000 | $923,000 | $923,000 |
| Accumulated Depreciation | $0 | $0 | $0 | $0 | $0 | $0 | $0 | $0 | $0 | $0 | $0 | $0 | $0 |
| Total Long-term Assets | $923,000 | $923,000 | $923,000 | $923,000 | $923,000 | $923,000 | $923,000 | $923,000 | $923,000 | $923,000 | $923,000 | $923,000 | $923,000 |
| Total Assets | $981,500 | $979,000 | $979,000 | $979,000 | $979,000 | $979,000 | $1,035,474 | $1,056,403 | $1,077,331 | $1,098,260 | $1,119,188 | $1,140,117 | $1,161,045 |
| Liabilities and Capital | Month 1 | Month 2 | Month 3 | Month 4 | Month 5 | Month 6 | Month 7 | Month 8 | Month 9 | Month 10 | Month 11 | Month 12 | |
| Current Liabilities | |||||||||||||
| Accounts Payable | $2,500 | $0 | $0 | $0 | $0 | $0 | $35,546 | $35,546 | $35,546 | $35,546 | $35,546 | $35,546 | $35,546 |
| Current Borrowing | $0 | $0 | $0 | $0 | $0 | $0 | $0 | $0 | $0 | $0 | $0 | $0 | $0 |
| Other Current Liabilities | $0 | $0 | $0 | $0 | $0 | $0 | $0 | $0 | $0 | $0 | $0 | $0 | $0 |
| Subtotal Current Liabilities | $2,500 | $0 | $0 | $0 | $0 | $0 | $35,546 | $35,546 | $35,546 | $35,546 | $35,546 | $35,546 | $35,546 |
| Long-term Liabilities | $639,200 | $639,200 | $639,200 | $639,200 | $639,200 | $639,200 | $639,200 | $639,200 | $639,200 | $639,200 | $639,200 | $639,200 | $639,200 |
| Total Liabilities | $641,700 | $639,200 | $639,200 | $639,200 | $639,200 | $639,200 | $674,746 | $674,746 | $674,746 | $674,746 | $674,746 | $674,746 | $674,746 |
| Paid-in Capital | $423,000 | $423,000 | $423,000 | $423,000 | $423,000 | $423,000 | $423,000 | $423,000 | $423,000 | $423,000 | $423,000 | $423,000 | $423,000 |
| Retained Earnings | ($83,200) | ($83,200) | ($83,200) | ($83,200) | ($83,200) | ($83,200) | ($83,200) | ($83,200) | ($83,200) | ($83,200) | ($83,200) | ($83,200) | ($83,200) |
| Earnings | $0 | $0 | $0 | $0 | $0 | $0 | $20,929 | $41,857 | $62,786 | $83,714 | $104,643 | $125,571 | $146,500 |
| Total Capital | $339,800 | $339,800 | $339,800 | $339,800 | $339,800 | $339,800 | $360,729 | $381,657 | $402,586 | $423,514 | $444,443 | $465,371 | $486,300 |
| Total Liabilities and Capital | $981,500 | $979,000 | $979,000 | $979,000 | $979,000 | $979,000 | $1,035,474 | $1,056,403 | $1,077,331 | $1,098,260 | $1,119,188 | $1,140,117 | $1,161,045 |
| Net Worth | $339,800 | $339,800 | $339,800 | $339,800 | $339,800 | $339,800 | $360,729 | $381,657 | $402,585 | $423,514 | $444,442 | $465,371 | $486,299 |
| Sales Forecast | |||||||||||||
| Month 1 | Month 2 | Month 3 | Month 4 | Month 5 | Month 6 | Month 7 | Month 8 | Month 9 | Month 10 | Month 11 | Month 12 | ||
| Sales | |||||||||||||
| Event Ticket Sales | 0% | $0 | $0 | $0 | $0 | $0 | $67,200 | $67,200 | $67,200 | $67,200 | $67,200 | $67,200 | $67,200 |
| Other | 0% | $0 | $0 | $0 | $0 | $0 | $2,000 | $2,000 | $2,000 | $2,000 | $2,000 | $2,000 | $2,000 |
| Total Sales | $0 | $0 | $0 | $0 | $0 | $69,200 | $69,200 | $69,200 | $69,200 | $69,200 | $69,200 | $69,200 | |
| Direct Cost of Sales | Month 1 | Month 2 | Month 3 | Month 4 | Month 5 | Month 6 | Month 7 | Month 8 | Month 9 | Month 10 | Month 11 | Month 12 | |
| Event Ticket Sales | $0 | $0 | $0 | $0 | $0 | $23,520 | $23,520 | $23,520 | $23,520 | $23,520 | $23,520 | $23,520 | |
| Other | $0 | $0 | $0 | $0 | $0 | $500 | $500 | $500 | $500 | $500 | $500 | $500 | |
| Subtotal Direct Cost of Sales | $0 | $0 | $0 | $0 | $0 | $24,020 | $24,020 | $24,020 | $24,020 | $24,020 | $24,020 | $24,020 | |


