
Mojo Music
Executive Summary
Mojo Music will be a CD store that specializes in used CDs and DVD rentals as well as blank CD/DVD recording media. Our target customers are the 23,000 students of State University and 40,000 non-student residents of the university area.
Mojo Music will be located one half block from the university campus on Taylor Street which is the major retail/commercial section of the university area. The student foot traffic on Taylor is heavy. The university bookstore is on Taylor Street, as well as numerous coffee houses, restaurants, and shops that cater to the student population.
Though the location is perfect for our target customers, it is more important to understand what our customers want from a CD store.
Twenty five years ago, it was popular among young adults to create mix cassette tapes of their favorite music for personal use and as gifts for friends. Today, with the wide distribution of CD recording equipment, Internet technology, and new recording formats like MP3, young adults now have the ability to create personalized presentations of their favorite music. The market for used CDs has exploded as a consequence of young listeners’ ability to create quality duplication from CDs. With the average price for a new CD at $16-$18, young adults would rather buy a used CD for a little over half that price ($8-$11). It is even more attractive if they can get in-store purchasing credit by selling their own CDs to the store.
Mojo Music will offer popular new releases and used CDs. We will have a attractive CD buying program that will reward customers for spending money in the store. In addition to new CDs in the store, a customer will be able to order any CD that is currently issued. We will have that CD in the store within three days.
Affordable blank CD/DVD recording media is another important key in bringing our target customers into the store. Young adults between 17-25 years of age are the largest group purchasing CD and DVD recorders. There is no store that sells recording media within a 10 mile radius of the university.
Similarly, there is no video/DVD rental store next to campus. The closest rental store is four miles off campus. Due to the drop in price for DVD players, many students own DVD/CD players, so the preferred format for movies is DVD. This is not true for the larger community with still prefers video cassette.
Mojo Music will sell blank recording media and rent movies in DVD format.
1.1 Objectives
- To become the first place our target customers will go to sell and buy CDs.
- To create a strong DVD rental business.
- To increase blank media sales by 20% each year.
1.2 Mission
Mojo Music’s mission is to offer our target customers:
- The best quality popular used CDs at affordable prices.
- The most popular new CDs at the lowest prices.
- The best recording media at affordable prices.
- A large selection of DVD rentals.
1.3 Keys to Success
The Keys to Success for Mojo Music are the following:
- Keep the money paid for used CDs in the store.
- Offer a quality selection of used CDs.
- Offer popular new CDs at a discounted price.
- Offer popular DVDs for rental.
- Offer recording media at a discounted price.
Company Summary
Mojo Music offers popular new CDs, used CDs, DVD rentals, and CD/DVD recording media. The target customers for the store are the 23,000 students of the State University. The store is located one half block from the major entrance to the university. The student group represents a unique music buying and DVD rental group that is not being served by the area’s existing CD stores or video rental outlets.
2.1 Start-up Summary
The start-up cost of Mojo Music will consist primarily of inventory and display equipment. Karl Payne will invest $50,000. In addition to securing a $100,000 SBA loan, Karl has also obtained an investment of $100,000 from a silent partner.

| Start-up | |
| Requirements | |
| Start-up Expenses | |
| Legal | $1,000 |
| Stationery etc. | $0 |
| Brochures | $0 |
| Consultants | $0 |
| Insurance | $0 |
| Rent | $4,000 |
| Inventory | $120,000 |
| Expensed Equipment | $20,000 |
| Display Equipment | $6,000 |
| Other | $0 |
| Total Start-up Expenses | $151,000 |
| Start-up Assets | |
| Cash Required | $49,000 |
| Start-up Inventory | $0 |
| Other Current Assets | $0 |
| Long-term Assets | $50,000 |
| Total Assets | $99,000 |
| Total Requirements | $250,000 |
| Start-up Funding | |
| Start-up Expenses to Fund | $151,000 |
| Start-up Assets to Fund | $99,000 |
| Total Funding Required | $250,000 |
| Assets | |
| Non-cash Assets from Start-up | $50,000 |
| Cash Requirements from Start-up | $49,000 |
| Additional Cash Raised | $0 |
| Cash Balance on Starting Date | $49,000 |
| Total Assets | $99,000 |
| Liabilities and Capital | |
| Liabilities | |
| Current Borrowing | $0 |
| Long-term Liabilities | $100,000 |
| Accounts Payable (Outstanding Bills) | $0 |
| Other Current Liabilities (interest-free) | $0 |
| Total Liabilities | $100,000 |
| Capital | |
| Planned Investment | |
| Karl Payne | $50,000 |
| Investor 2 | $100,000 |
| Other | $0 |
| Additional Investment Requirement | $0 |
| Total Planned Investment | $150,000 |
| Loss at Start-up (Start-up Expenses) | ($151,000) |
| Total Capital | ($1,000) |
| Total Capital and Liabilities | $99,000 |
| Total Funding | $250,000 |
2.2 Company Ownership
The store owner is Karl Payne who has worked in CD stores for over ten years. Most recently, he was the store manager for CD Warehouse for seven years supervising a staff 10.
Products
Mojo Music offers popular new CDs, used CDs, DVD rentals, and CD/DVD recording media. The primary focus will be to satisfy the music/DVD needs of the target customers.
- New CDs: CDs that are popular with our target group.
- Used CDs: CDs that are in good condition and that have a reasonable chance of being purchased.
- DVD rentals: Movies that are popular with our target customers.
- CD/DVD recording media: Provide the best quality for the best price.
Market Analysis Summary
It is estimated that the university student community spends over $75 million with local businesses each year. Approximately 50% of these sales are for entertainment including music and movies. The university’s commercial/retail area borders the east side of the campus and it is the main entrance onto campus. Each day, thousands of students shop and eat on Taylor Street before, after, and between classes.
Currently, if a student wanted to purchase a used CD, he/she would have to take a ten minute drive to reach the only used CD store in town. Similarly, he/she would also have to drive to reach the closest video rental store to the campus community.
Mojo Music offers the student the ability to buy a CD or rent a DVD during the day while on campus.
4.1 Market Segmentation
Mojo Music will focus on three significant customer groups:
- Used CD buyer/seller: The shelf life for music is very short with young adults. What was popular three months ago can quickly become boring. The music industry is aware of this trend and is constantly releasing the next great hit to satisfy this hunger for the new. But what does the buyer do with old CDs that are no longer being rotating into the CD player? Mojo Music will be uniquely designed to attract and retain this important customer group.
- CD/DVD recording media buyer: This customer group is very significant. They have already embraced the technology that gives them the freedom to create their own CDs and DVDs. The purchase/sell turnaround on a CD/DVD is very quick with this group. They will be a great source for used popular CDs and DVDs. Mojo Music will set up an in-house credit system that will bring this customer group into the store.
- DVD renters: As stated before, the student population represents a unique group of DVD users. Many manufacturers now make cheap CD/DVD players that are targeted at young adults. So DVD rentals are much higher with this customer group than the population as a whole. Mojo Music’s location is perfect to capture the walk-in business for DVD rentals.


| Market Analysis | |||||||
| Year 1 | Year 2 | Year 3 | Year 4 | Year 5 | |||
| Potential Customers | Growth | CAGR | |||||
| Used CD Buyer/Seller | 15% | 10,000 | 11,500 | 13,225 | 15,209 | 17,490 | 15.00% |
| CD/DVD Recording Media Buyer | 10% | 4,000 | 4,400 | 4,840 | 5,324 | 5,856 | 10.00% |
| DVD Renters | 15% | 10,000 | 11,500 | 13,225 | 15,209 | 17,490 | 15.00% |
| Other | 0% | 0 | 0 | 0 | 0 | 0 | 0.00% |
| Total | 14.21% | 24,000 | 27,400 | 31,290 | 35,742 | 40,836 | 14.21% |
4.2 Target Market Segment Strategy
The advancement of CD recording equipment, Internet technology, and new recording formats like MP3, has turned young adults into a new type of music and movie consumer. This trend has already depressed CD sales nationwide and many CD stores have gone out of business in last five years.
To be successful, a store must respond to the market opportunity the target consumer is providing. Though the game has changed, there is still tremendous opportunity if a CD store can read the market needs and trends correctly.
The student population that Mojo Music is targeting is very comfortable with the newest technology and has easy access to CD/DVD recording equipment. This creates a new expectation in the consumer’s mind concerning what is an affordable price for music. Most college-aged adults have reported in numerous industry polls that the price of new CDs should be lower. This search for a lower price led to the explosion of MP3 on the Internet. Consequently, CD recording media has increased in sales.
Quality used CDs fill the niche that this concern creates by offering a lower price for popular music.
Another area where the college-age consumers is leading the market is in the use of DVDs. At most video rental shops, DVDs are small subsection of available rentals. Currently, these shops primarily serve consumers who prefer video cassettes. Though this trend is changing, DVD owners find the selection limited.
Strategy and Implementation Summary
Mojo Music will be heavily promoting the store. We will use the student daily paper to advertise a $2 off per CD coupon. In addition, we will have a drawing for five CD/DVD players each week. We will continue the drawings for the first eight weeks of the store’s operation.
5.1 Competitive Edge
Mojo Music’s competitive edge is:
- Location: Mojo Music is on Taylor Street, one half block from the entrance to the university. The student foot traffic on Taylor Street is very strong. The closest used CD store to the university area is a ten minute drive.
- Quality used CDs: With the average price for a new CD at $16-$18, young adults would rather buy a used CD for a little over half that price ($8-$11). It is even more attractive if they can get in-store purchasing credit by selling their own CDs to the store.
- CD/DVD recording media: Young adults between 17-25 years of age are the largest group purchasing CD and DVD recorders. There is no store that sells recording media within a 10 mile radius of the university.
- DVD rentals: The closest rental store is four miles off campus. Due to the drop in price for DVD players, many students own DVD/CD players, so their reasonable format for movies are DVD.
5.2 Sales Strategy
The key to Mojo Music’s sales strategy is to get the sellers of used CDs to spend their money in the store. To accomplish this goal, we will offer the seller two options for their CDs: cash and in-store credit. In-store credit will be 20% more than cash. This can be used to buy CDs or CD/DVD recording media. In-store credit can also be used to rent DVDs.
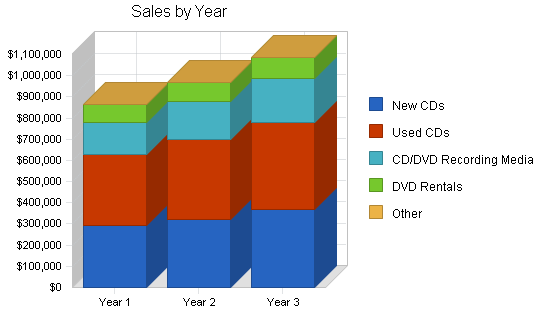
5.2.1 Sales Forecast
The following is the sales forecast for three years.

| Sales Forecast | |||
| Year 1 | Year 2 | Year 3 | |
| Unit Sales | |||
| New CDs | 18,400 | 20,000 | 23,000 |
| Used CDs | 33,500 | 38,000 | 41,000 |
| CD/DVD Recording Media | 15,100 | 18,000 | 21,000 |
| DVD Rentals | 28,100 | 30,000 | 33,000 |
| Other | 0 | 0 | 0 |
| Total Unit Sales | 95,100 | 106,000 | 118,000 |
| Unit Prices | Year 1 | Year 2 | Year 3 |
| New CDs | $16.00 | $16.00 | $16.00 |
| Used CDs | $10.00 | $10.00 | $10.00 |
| CD/DVD Recording Media | $10.00 | $10.00 | $10.00 |
| DVD Rentals | $3.00 | $3.00 | $3.00 |
| Other | $0.00 | $0.00 | $0.00 |
| Sales | |||
| New CDs | $294,400 | $320,000 | $368,000 |
| Used CDs | $335,000 | $380,000 | $410,000 |
| CD/DVD Recording Media | $151,000 | $180,000 | $210,000 |
| DVD Rentals | $84,300 | $90,000 | $99,000 |
| Other | $0 | $0 | $0 |
| Total Sales | $864,700 | $970,000 | $1,087,000 |
| Direct Unit Costs | Year 1 | Year 2 | Year 3 |
| New CDs | $11.00 | $11.00 | $11.00 |
| Used CDs | $5.00 | $5.00 | $5.00 |
| CD/DVD Recording Media | $4.00 | $4.00 | $4.00 |
| DVD Rentals | $1.00 | $1.00 | $1.00 |
| Other | $0.00 | $0.00 | $0.00 |
| Direct Cost of Sales | |||
| New CDs | $202,400 | $220,000 | $253,000 |
| Used CDs | $167,500 | $190,000 | $205,000 |
| CD/DVD Recording Media | $60,400 | $72,000 | $84,000 |
| DVD Rentals | $28,100 | $30,000 | $33,000 |
| Other | $0 | $0 | $0 |
| Subtotal Direct Cost of Sales | $458,400 | $512,000 | $575,000 |
Management Summary
Karl Payne is the owner/manager of Mojo Music. Karl has worked for over 15 years in record/CD stores. As a student at State University, Karl worked at The Record Factory, a successful downtown record store, in the late 80’s. After graduating in 1989 with a BA in english, Karl went on to managed two record/CD stores; the Palace (89-93) and the CD Warehouse. Karl is a excellent staff supervisor and will do very well in managing the staff of Mojo Music.
6.1 Personnel Plan
Mojo Music will have the following staff members:
- Manager.
- Assistant manager.
- Four customer assistants.
| Personnel Plan | |||
| Year 1 | Year 2 | Year 3 | |
| Manager | $36,000 | $40,000 | $45,000 |
| Assistant Manager | $30,000 | $33,000 | $37,000 |
| Customer Assistants | $72,000 | $75,000 | $80,000 |
| Other | $0 | $0 | $0 |
| Total People | 6 | 6 | 6 |
| Total Payroll | $138,000 | $148,000 | $162,000 |
Financial Plan
The following is the financial plan for Mojo Music.
7.1 Break-even Analysis
The monthly sales break-even point is approximately 6,200 units.

| Break-even Analysis | |
| Monthly Units Break-even | 6,215 |
| Monthly Revenue Break-even | $56,512 |
| Assumptions: | |
| Average Per-Unit Revenue | $9.09 |
| Average Per-Unit Variable Cost | $4.82 |
| Estimated Monthly Fixed Cost | $26,553 |
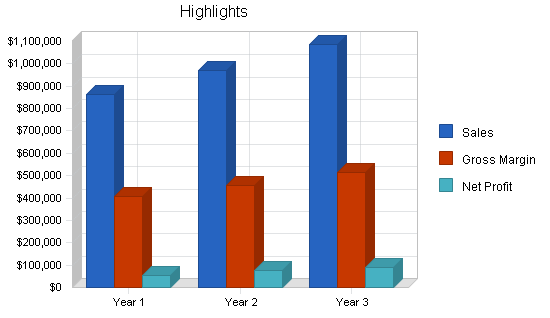
7.2 Projected Profit and Loss
The following table and charts are the projected profit and loss for three years.


| Pro Forma Profit and Loss | |||
| Year 1 | Year 2 | Year 3 | |
| Sales | $864,700 | $970,000 | $1,087,000 |
| Direct Cost of Sales | $458,400 | $512,000 | $575,000 |
| Other Production Expenses | $0 | $0 | $0 |
| Total Cost of Sales | $458,400 | $512,000 | $575,000 |
| Gross Margin | $406,300 | $458,000 | $512,000 |
| Gross Margin % | 46.99% | 47.22% | 47.10% |
| Expenses | |||
| Payroll | $138,000 | $148,000 | $162,000 |
| Sales and Marketing and Other Expenses | $100,000 | $110,000 | $130,000 |
| Depreciation | $7,140 | $7,143 | $7,143 |
| Leased Equipment | $0 | $0 | $0 |
| Utilities | $4,800 | $4,800 | $4,800 |
| Insurance | $0 | $0 | $0 |
| Rent | $48,000 | $48,000 | $48,000 |
| Payroll Taxes | $20,700 | $22,200 | $24,300 |
| Other | $0 | $0 | $0 |
| Total Operating Expenses | $318,640 | $340,143 | $376,243 |
| Profit Before Interest and Taxes | $87,660 | $117,857 | $135,757 |
| EBITDA | $94,800 | $125,000 | $142,900 |
| Interest Expense | $8,917 | $7,001 | $5,002 |
| Taxes Incurred | $23,623 | $33,257 | $39,227 |
| Net Profit | $55,120 | $77,599 | $91,529 |
| Net Profit/Sales | 6.37% | 8.00% | 8.42% |
7.3 Projected Cash Flow
The following is the projected cash flow for three years.

| Pro Forma Cash Flow | |||
| Year 1 | Year 2 | Year 3 | |
| Cash Received | |||
| Cash from Operations | |||
| Cash Sales | $216,175 | $242,500 | $271,750 |
| Cash from Receivables | $506,165 | $710,164 | $795,988 |
| Subtotal Cash from Operations | $722,340 | $952,664 | $1,067,738 |
| Additional Cash Received | |||
| Sales Tax, VAT, HST/GST Received | $0 | $0 | $0 |
| New Current Borrowing | $0 | $0 | $0 |
| New Other Liabilities (interest-free) | $0 | $0 | $0 |
| New Long-term Liabilities | $0 | $0 | $0 |
| Sales of Other Current Assets | $0 | $0 | $0 |
| Sales of Long-term Assets | $0 | $0 | $0 |
| New Investment Received | $68,000 | $0 | $0 |
| Subtotal Cash Received | $790,340 | $952,664 | $1,067,738 |
| Expenditures | Year 1 | Year 2 | Year 3 |
| Expenditures from Operations | |||
| Cash Spending | $138,000 | $148,000 | $162,000 |
| Bill Payments | $644,695 | $762,547 | $827,116 |
| Subtotal Spent on Operations | $782,695 | $910,547 | $989,116 |
| Additional Cash Spent | |||
| Sales Tax, VAT, HST/GST Paid Out | $0 | $0 | $0 |
| Principal Repayment of Current Borrowing | $0 | $0 | $0 |
| Other Liabilities Principal Repayment | $0 | $0 | $0 |
| Long-term Liabilities Principal Repayment | $19,992 | $19,992 | $19,992 |
| Purchase Other Current Assets | $0 | $0 | $0 |
| Purchase Long-term Assets | $0 | $0 | $0 |
| Dividends | $0 | $0 | $0 |
| Subtotal Cash Spent | $802,687 | $930,539 | $1,009,108 |
| Net Cash Flow | ($12,347) | $22,125 | $58,630 |
| Cash Balance | $36,653 | $58,778 | $117,408 |
7.4 Projected Balance Sheet
The following is the projected balance sheet for three years.
| Pro Forma Balance Sheet | |||
| Year 1 | Year 2 | Year 3 | |
| Assets | |||
| Current Assets | |||
| Cash | $36,653 | $58,778 | $117,408 |
| Accounts Receivable | $142,360 | $159,696 | $178,958 |
| Inventory | $59,730 | $66,714 | $74,923 |
| Other Current Assets | $0 | $0 | $0 |
| Total Current Assets | $238,743 | $285,189 | $371,290 |
| Long-term Assets | |||
| Long-term Assets | $50,000 | $50,000 | $50,000 |
| Accumulated Depreciation | $7,140 | $14,283 | $21,426 |
| Total Long-term Assets | $42,860 | $35,717 | $28,574 |
| Total Assets | $281,603 | $320,906 | $399,864 |
| Liabilities and Capital | Year 1 | Year 2 | Year 3 |
| Current Liabilities | |||
| Accounts Payable | $79,475 | $61,171 | $68,592 |
| Current Borrowing | $0 | $0 | $0 |
| Other Current Liabilities | $0 | $0 | $0 |
| Subtotal Current Liabilities | $79,475 | $61,171 | $68,592 |
| Long-term Liabilities | $80,008 | $60,016 | $40,024 |
| Total Liabilities | $159,483 | $121,187 | $108,616 |
| Paid-in Capital | $218,000 | $218,000 | $218,000 |
| Retained Earnings | ($151,000) | ($95,880) | ($18,281) |
| Earnings | $55,120 | $77,599 | $91,529 |
| Total Capital | $122,120 | $199,719 | $291,248 |
| Total Liabilities and Capital | $281,603 | $320,906 | $399,864 |
| Net Worth | $122,120 | $199,719 | $291,248 |
7.5 Business Ratios
Business ratios for the years of this plan are shown below. Industry profile ratios based on the Standard Industrial Classification (SIC) code 5735, Record and Prerecorded Tape Stores, are shown for comparison.
| Ratio Analysis | ||||
| Year 1 | Year 2 | Year 3 | Industry Profile | |
| Sales Growth | 0.00% | 12.18% | 12.06% | 2.40% |
| Percent of Total Assets | ||||
| Accounts Receivable | 50.55% | 49.76% | 44.75% | 18.30% |
| Inventory | 21.21% | 20.79% | 18.74% | 38.60% |
| Other Current Assets | 0.00% | 0.00% | 0.00% | 21.70% |
| Total Current Assets | 84.78% | 88.87% | 92.85% | 78.60% |
| Long-term Assets | 15.22% | 11.13% | 7.15% | 21.40% |
| Total Assets | 100.00% | 100.00% | 100.00% | 100.00% |
| Current Liabilities | 28.22% | 19.06% | 17.15% | 40.30% |
| Long-term Liabilities | 28.41% | 18.70% | 10.01% | 14.70% |
| Total Liabilities | 56.63% | 37.76% | 27.16% | 55.00% |
| Net Worth | 43.37% | 62.24% | 72.84% | 45.00% |
| Percent of Sales | ||||
| Sales | 100.00% | 100.00% | 100.00% | 100.00% |
| Gross Margin | 46.99% | 47.22% | 47.10% | 33.50% |
| Selling, General & Administrative Expenses | 40.61% | 39.22% | 38.68% | 18.50% |
| Advertising Expenses | 5.78% | 5.15% | 4.60% | 3.60% |
| Profit Before Interest and Taxes | 10.14% | 12.15% | 12.49% | 1.60% |
| Main Ratios | ||||
| Current | 3.00 | 4.66 | 5.41 | 1.99 |
| Quick | 2.25 | 3.57 | 4.32 | 0.78 |
| Total Debt to Total Assets | 56.63% | 37.76% | 27.16% | 55.00% |
| Pre-tax Return on Net Worth | 64.48% | 55.51% | 44.89% | 4.10% |
| Pre-tax Return on Assets | 27.96% | 34.54% | 32.70% | 9.00% |
| Additional Ratios | Year 1 | Year 2 | Year 3 | |
| Net Profit Margin | 6.37% | 8.00% | 8.42% | n.a |
| Return on Equity | 45.14% | 38.85% | 31.43% | n.a |
| Activity Ratios | ||||
| Accounts Receivable Turnover | 4.56 | 4.56 | 4.56 | n.a |
| Collection Days | 56 | 76 | 76 | n.a |
| Inventory Turnover | 10.91 | 8.10 | 8.12 | n.a |
| Accounts Payable Turnover | 9.11 | 12.17 | 12.17 | n.a |
| Payment Days | 27 | 34 | 28 | n.a |
| Total Asset Turnover | 3.07 | 3.02 | 2.72 | n.a |
| Debt Ratios | ||||
| Debt to Net Worth | 1.31 | 0.61 | 0.37 | n.a |
| Current Liab. to Liab. | 0.50 | 0.50 | 0.63 | n.a |
| Liquidity Ratios | ||||
| Net Working Capital | $159,268 | $224,018 | $302,698 | n.a |
| Interest Coverage | 9.83 | 16.83 | 27.14 | n.a |
| Additional Ratios | ||||
| Assets to Sales | 0.33 | 0.33 | 0.37 | n.a |
| Current Debt/Total Assets | 28% | 19% | 17% | n.a |
| Acid Test | 0.46 | 0.96 | 1.71 | n.a |
| Sales/Net Worth | 7.08 | 4.86 | 3.73 | n.a |
| Dividend Payout | 0.00 | 0.00 | 0.00 | n.a |
Appendix
| Sales Forecast | |||||||||||||
| Month 1 | Month 2 | Month 3 | Month 4 | Month 5 | Month 6 | Month 7 | Month 8 | Month 9 | Month 10 | Month 11 | Month 12 | ||
| Unit Sales | |||||||||||||
| New CDs | 0% | 1,000 | 1,000 | 1,300 | 1,400 | 1,800 | 2,000 | 1,500 | 1,200 | 1,600 | 1,600 | 1,900 | 2,100 |
| Used CDs | 0% | 2,000 | 2,500 | 2,500 | 2,800 | 3,000 | 3,200 | 2,500 | 2,000 | 2,800 | 3,000 | 3,200 | 4,000 |
| CD/DVD Recording Media | 0% | 1,000 | 1,000 | 1,000 | 1,300 | 1,500 | 1,300 | 1,000 | 1,000 | 1,000 | 1,300 | 1,700 | 2,000 |
| DVD Rentals | 0% | 2,000 | 1,200 | 1,300 | 1,800 | 2,200 | 2,800 | 2,000 | 2,000 | 2,800 | 3,400 | 3,400 | 3,200 |
| Other | 0% | 0 | 0 | 0 | 0 | 0 | 0 | 0 | 0 | 0 | 0 | 0 | 0 |
| Total Unit Sales | 6,000 | 5,700 | 6,100 | 7,300 | 8,500 | 9,300 | 7,000 | 6,200 | 8,200 | 9,300 | 10,200 | 11,300 | |
| Unit Prices | Month 1 | Month 2 | Month 3 | Month 4 | Month 5 | Month 6 | Month 7 | Month 8 | Month 9 | Month 10 | Month 11 | Month 12 | |
| New CDs | $16.00 | $16.00 | $16.00 | $16.00 | $16.00 | $16.00 | $16.00 | $16.00 | $16.00 | $16.00 | $16.00 | $16.00 | |
| Used CDs | $10.00 | $10.00 | $10.00 | $10.00 | $10.00 | $10.00 | $10.00 | $10.00 | $10.00 | $10.00 | $10.00 | $10.00 | |
| CD/DVD Recording Media | $10.00 | $10.00 | $10.00 | $10.00 | $10.00 | $10.00 | $10.00 | $10.00 | $10.00 | $10.00 | $10.00 | $10.00 | |
| DVD Rentals | $3.00 | $3.00 | $3.00 | $3.00 | $3.00 | $3.00 | $3.00 | $3.00 | $3.00 | $3.00 | $3.00 | $3.00 | |
| Other | $0.00 | $0.00 | $0.00 | $0.00 | $0.00 | $0.00 | $0.00 | $0.00 | $0.00 | $0.00 | $0.00 | $0.00 | |
| Sales | |||||||||||||
| New CDs | $16,000 | $16,000 | $20,800 | $22,400 | $28,800 | $32,000 | $24,000 | $19,200 | $25,600 | $25,600 | $30,400 | $33,600 | |
| Used CDs | $20,000 | $25,000 | $25,000 | $28,000 | $30,000 | $32,000 | $25,000 | $20,000 | $28,000 | $30,000 | $32,000 | $40,000 | |
| CD/DVD Recording Media | $10,000 | $10,000 | $10,000 | $13,000 | $15,000 | $13,000 | $10,000 | $10,000 | $10,000 | $13,000 | $17,000 | $20,000 | |
| DVD Rentals | $6,000 | $3,600 | $3,900 | $5,400 | $6,600 | $8,400 | $6,000 | $6,000 | $8,400 | $10,200 | $10,200 | $9,600 | |
| Other | $0 | $0 | $0 | $0 | $0 | $0 | $0 | $0 | $0 | $0 | $0 | $0 | |
| Total Sales | $52,000 | $54,600 | $59,700 | $68,800 | $80,400 | $85,400 | $65,000 | $55,200 | $72,000 | $78,800 | $89,600 | $103,200 | |
| Direct Unit Costs | Month 1 | Month 2 | Month 3 | Month 4 | Month 5 | Month 6 | Month 7 | Month 8 | Month 9 | Month 10 | Month 11 | Month 12 | |
| New CDs | 0.00% | $11.00 | $11.00 | $11.00 | $11.00 | $11.00 | $11.00 | $11.00 | $11.00 | $11.00 | $11.00 | $11.00 | $11.00 |
| Used CDs | 0.00% | $5.00 | $5.00 | $5.00 | $5.00 | $5.00 | $5.00 | $5.00 | $5.00 | $5.00 | $5.00 | $5.00 | $5.00 |
| CD/DVD Recording Media | 0.00% | $4.00 | $4.00 | $4.00 | $4.00 | $4.00 | $4.00 | $4.00 | $4.00 | $4.00 | $4.00 | $4.00 | $4.00 |
| DVD Rentals | 0.00% | $1.00 | $1.00 | $1.00 | $1.00 | $1.00 | $1.00 | $1.00 | $1.00 | $1.00 | $1.00 | $1.00 | $1.00 |
| Other | 0.00% | $0.00 | $0.00 | $0.00 | $0.00 | $0.00 | $0.00 | $0.00 | $0.00 | $0.00 | $0.00 | $0.00 | $0.00 |
| Direct Cost of Sales | |||||||||||||
| New CDs | $11,000 | $11,000 | $14,300 | $15,400 | $19,800 | $22,000 | $16,500 | $13,200 | $17,600 | $17,600 | $20,900 | $23,100 | |
| Used CDs | $10,000 | $12,500 | $12,500 | $14,000 | $15,000 | $16,000 | $12,500 | $10,000 | $14,000 | $15,000 | $16,000 | $20,000 | |
| CD/DVD Recording Media | $4,000 | $4,000 | $4,000 | $5,200 | $6,000 | $5,200 | $4,000 | $4,000 | $4,000 | $5,200 | $6,800 | $8,000 | |
| DVD Rentals | $2,000 | $1,200 | $1,300 | $1,800 | $2,200 | $2,800 | $2,000 | $2,000 | $2,800 | $3,400 | $3,400 | $3,200 | |
| Other | $0 | $0 | $0 | $0 | $0 | $0 | $0 | $0 | $0 | $0 | $0 | $0 | |
| Subtotal Direct Cost of Sales | $27,000 | $28,700 | $32,100 | $36,400 | $43,000 | $46,000 | $35,000 | $29,200 | $38,400 | $41,200 | $47,100 | $54,300 | |
| Personnel Plan | |||||||||||||
| Month 1 | Month 2 | Month 3 | Month 4 | Month 5 | Month 6 | Month 7 | Month 8 | Month 9 | Month 10 | Month 11 | Month 12 | ||
| Manager | 0% | $3,000 | $3,000 | $3,000 | $3,000 | $3,000 | $3,000 | $3,000 | $3,000 | $3,000 | $3,000 | $3,000 | $3,000 |
| Assistant Manager | 0% | $2,500 | $2,500 | $2,500 | $2,500 | $2,500 | $2,500 | $2,500 | $2,500 | $2,500 | $2,500 | $2,500 | $2,500 |
| Customer Assistants | 0% | $6,000 | $6,000 | $6,000 | $6,000 | $6,000 | $6,000 | $6,000 | $6,000 | $6,000 | $6,000 | $6,000 | $6,000 |
| Other | 0% | $0 | $0 | $0 | $0 | $0 | $0 | $0 | $0 | $0 | $0 | $0 | $0 |
| Total People | 6 | 6 | 6 | 6 | 6 | 6 | 6 | 6 | 6 | 6 | 6 | 6 | |
| Total Payroll | $11,500 | $11,500 | $11,500 | $11,500 | $11,500 | $11,500 | $11,500 | $11,500 | $11,500 | $11,500 | $11,500 | $11,500 | |
| General Assumptions | |||||||||||||
| Month 1 | Month 2 | Month 3 | Month 4 | Month 5 | Month 6 | Month 7 | Month 8 | Month 9 | Month 10 | Month 11 | Month 12 | ||
| Plan Month | 1 | 2 | 3 | 4 | 5 | 6 | 7 | 8 | 9 | 10 | 11 | 12 | |
| Current Interest Rate | 10.00% | 10.00% | 10.00% | 10.00% | 10.00% | 10.00% | 10.00% | 10.00% | 10.00% | 10.00% | 10.00% | 10.00% | |
| Long-term Interest Rate | 10.00% | 10.00% | 10.00% | 10.00% | 10.00% | 10.00% | 10.00% | 10.00% | 10.00% | 10.00% | 10.00% | 10.00% | |
| Tax Rate | 30.00% | 30.00% | 30.00% | 30.00% | 30.00% | 30.00% | 30.00% | 30.00% | 30.00% | 30.00% | 30.00% | 30.00% | |
| Other | 0 | 0 | 0 | 0 | 0 | 0 | 0 | 0 | 0 | 0 | 0 | 0 | |
| Pro Forma Profit and Loss | |||||||||||||
| Month 1 | Month 2 | Month 3 | Month 4 | Month 5 | Month 6 | Month 7 | Month 8 | Month 9 | Month 10 | Month 11 | Month 12 | ||
| Sales | $52,000 | $54,600 | $59,700 | $68,800 | $80,400 | $85,400 | $65,000 | $55,200 | $72,000 | $78,800 | $89,600 | $103,200 | |
| Direct Cost of Sales | $27,000 | $28,700 | $32,100 | $36,400 | $43,000 | $46,000 | $35,000 | $29,200 | $38,400 | $41,200 | $47,100 | $54,300 | |
| Other Production Expenses | $0 | $0 | $0 | $0 | $0 | $0 | $0 | $0 | $0 | $0 | $0 | $0 | |
| Total Cost of Sales | $27,000 | $28,700 | $32,100 | $36,400 | $43,000 | $46,000 | $35,000 | $29,200 | $38,400 | $41,200 | $47,100 | $54,300 | |
| Gross Margin | $25,000 | $25,900 | $27,600 | $32,400 | $37,400 | $39,400 | $30,000 | $26,000 | $33,600 | $37,600 | $42,500 | $48,900 | |
| Gross Margin % | 48.08% | 47.44% | 46.23% | 47.09% | 46.52% | 46.14% | 46.15% | 47.10% | 46.67% | 47.72% | 47.43% | 47.38% | |
| Expenses | |||||||||||||
| Payroll | $11,500 | $11,500 | $11,500 | $11,500 | $11,500 | $11,500 | $11,500 | $11,500 | $11,500 | $11,500 | $11,500 | $11,500 | |
| Sales and Marketing and Other Expenses | $20,000 | $20,000 | $6,000 | $6,000 | $6,000 | $6,000 | $6,000 | $6,000 | $6,000 | $6,000 | $6,000 | $6,000 | |
| Depreciation | $595 | $595 | $595 | $595 | $595 | $595 | $595 | $595 | $595 | $595 | $595 | $595 | |
| Leased Equipment | $0 | $0 | $0 | $0 | $0 | $0 | $0 | $0 | $0 | $0 | $0 | $0 | |
| Utilities | $400 | $400 | $400 | $400 | $400 | $400 | $400 | $400 | $400 | $400 | $400 | $400 | |
| Insurance | $0 | $0 | $0 | $0 | $0 | $0 | $0 | $0 | $0 | $0 | $0 | $0 | |
| Rent | $4,000 | $4,000 | $4,000 | $4,000 | $4,000 | $4,000 | $4,000 | $4,000 | $4,000 | $4,000 | $4,000 | $4,000 | |
| Payroll Taxes | 15% | $1,725 | $1,725 | $1,725 | $1,725 | $1,725 | $1,725 | $1,725 | $1,725 | $1,725 | $1,725 | $1,725 | $1,725 |
| Other | $0 | $0 | $0 | $0 | $0 | $0 | $0 | $0 | $0 | $0 | $0 | $0 | |
| Total Operating Expenses | $38,220 | $38,220 | $24,220 | $24,220 | $24,220 | $24,220 | $24,220 | $24,220 | $24,220 | $24,220 | $24,220 | $24,220 | |
| Profit Before Interest and Taxes | ($13,220) | ($12,320) | $3,380 | $8,180 | $13,180 | $15,180 | $5,780 | $1,780 | $9,380 | $13,380 | $18,280 | $24,680 | |
| EBITDA | ($12,625) | ($11,725) | $3,975 | $8,775 | $13,775 | $15,775 | $6,375 | $2,375 | $9,975 | $13,975 | $18,875 | $25,275 | |
| Interest Expense | $819 | $806 | $792 | $778 | $764 | $750 | $736 | $722 | $708 | $695 | $681 | $667 | |
| Taxes Incurred | ($4,212) | ($3,938) | $776 | $2,221 | $3,725 | $4,329 | $1,513 | $317 | $2,601 | $3,806 | $5,280 | $7,204 | |
| Net Profit | ($9,828) | ($9,188) | $1,812 | $5,182 | $8,691 | $10,101 | $3,531 | $740 | $6,070 | $8,880 | $12,320 | $16,809 | |
| Net Profit/Sales | -18.90% | -16.83% | 3.03% | 7.53% | 10.81% | 11.83% | 5.43% | 1.34% | 8.43% | 11.27% | 13.75% | 16.29% | |
| Pro Forma Cash Flow | |||||||||||||
| Month 1 | Month 2 | Month 3 | Month 4 | Month 5 | Month 6 | Month 7 | Month 8 | Month 9 | Month 10 | Month 11 | Month 12 | ||
| Cash Received | |||||||||||||
| Cash from Operations | |||||||||||||
| Cash Sales | $13,000 | $13,650 | $14,925 | $17,200 | $20,100 | $21,350 | $16,250 | $13,800 | $18,000 | $19,700 | $22,400 | $25,800 | |
| Cash from Receivables | $0 | $1,300 | $39,065 | $41,078 | $45,003 | $51,890 | $60,425 | $63,540 | $48,505 | $41,820 | $54,170 | $59,370 | |
| Subtotal Cash from Operations | $13,000 | $14,950 | $53,990 | $58,278 | $65,103 | $73,240 | $76,675 | $77,340 | $66,505 | $61,520 | $76,570 | $85,170 | |
| Additional Cash Received | |||||||||||||
| Sales Tax, VAT, HST/GST Received | 0.00% | $0 | $0 | $0 | $0 | $0 | $0 | $0 | $0 | $0 | $0 | $0 | $0 |
| New Current Borrowing | $0 | $0 | $0 | $0 | $0 | $0 | $0 | $0 | $0 | $0 | $0 | $0 | |
| New Other Liabilities (interest-free) | $0 | $0 | $0 | $0 | $0 | $0 | $0 | $0 | $0 | $0 | $0 | $0 | |
| New Long-term Liabilities | $0 | $0 | $0 | $0 | $0 | $0 | $0 | $0 | $0 | $0 | $0 | $0 | |
| Sales of Other Current Assets | $0 | $0 | $0 | $0 | $0 | $0 | $0 | $0 | $0 | $0 | $0 | $0 | |
| Sales of Long-term Assets | $0 | $0 | $0 | $0 | $0 | $0 | $0 | $0 | $0 | $0 | $0 | $0 | |
| New Investment Received | $0 | $68,000 | $0 | $0 | $0 | $0 | $0 | $0 | $0 | $0 | $0 | $0 | |
| Subtotal Cash Received | $13,000 | $82,950 | $53,990 | $58,278 | $65,103 | $73,240 | $76,675 | $77,340 | $66,505 | $61,520 | $76,570 | $85,170 | |
| Expenditures | Month 1 | Month 2 | Month 3 | Month 4 | Month 5 | Month 6 | Month 7 | Month 8 | Month 9 | Month 10 | Month 11 | Month 12 | |
| Expenditures from Operations | |||||||||||||
| Cash Spending | $11,500 | $11,500 | $11,500 | $11,500 | $11,500 | $11,500 | $11,500 | $11,500 | $11,500 | $11,500 | $11,500 | $11,500 | |
| Bill Payments | $2,648 | $78,570 | $53,429 | $49,757 | $56,607 | $66,861 | $65,530 | $37,231 | $36,917 | $63,853 | $61,264 | $72,027 | |
| Subtotal Spent on Operations | $14,148 | $90,070 | $64,929 | $61,257 | $68,107 | $78,361 | $77,030 | $48,731 | $48,417 | $75,353 | $72,764 | $83,527 | |
| Additional Cash Spent | |||||||||||||
| Sales Tax, VAT, HST/GST Paid Out | $0 | $0 | $0 | $0 | $0 | $0 | $0 | $0 | $0 | $0 | $0 | $0 | |
| Principal Repayment of Current Borrowing | $0 | $0 | $0 | $0 | $0 | $0 | $0 | $0 | $0 | $0 | $0 | $0 | |
| Other Liabilities Principal Repayment | $0 | $0 | $0 | $0 | $0 | $0 | $0 | $0 | $0 | $0 | $0 | $0 | |
| Long-term Liabilities Principal Repayment | $1,666 | $1,666 | $1,666 | $1,666 | $1,666 | $1,666 | $1,666 | $1,666 | $1,666 | $1,666 | $1,666 | $1,666 | |
| Purchase Other Current Assets | $0 | $0 | $0 | $0 | $0 | $0 | $0 | $0 | $0 | $0 | $0 | $0 | |
| Purchase Long-term Assets | $0 | $0 | $0 | $0 | $0 | $0 | $0 | $0 | $0 | $0 | $0 | $0 | |
| Dividends | $0 | $0 | $0 | $0 | $0 | $0 | $0 | $0 | $0 | $0 | $0 | $0 | |
| Subtotal Cash Spent | $15,814 | $91,736 | $66,595 | $62,923 | $69,773 | $80,027 | $78,696 | $50,397 | $50,083 | $77,019 | $74,430 | $85,193 | |
| Net Cash Flow | ($2,814) | ($8,786) | ($12,605) | ($4,646) | ($4,671) | ($6,787) | ($2,021) | $26,943 | $16,422 | ($15,499) | $2,140 | ($23) | |
| Cash Balance | $46,186 | $37,400 | $24,795 | $20,150 | $15,479 | $8,691 | $6,671 | $33,613 | $50,035 | $34,536 | $36,676 | $36,653 | |
| Pro Forma Balance Sheet | |||||||||||||
| Month 1 | Month 2 | Month 3 | Month 4 | Month 5 | Month 6 | Month 7 | Month 8 | Month 9 | Month 10 | Month 11 | Month 12 | ||
| Assets | Starting Balances | ||||||||||||
| Current Assets | |||||||||||||
| Cash | $49,000 | $46,186 | $37,400 | $24,795 | $20,150 | $15,479 | $8,691 | $6,671 | $33,613 | $50,035 | $34,536 | $36,676 | $36,653 |
| Accounts Receivable | $0 | $39,000 | $78,650 | $84,360 | $94,883 | $110,180 | $122,340 | $110,665 | $88,525 | $94,020 | $111,300 | $124,330 | $142,360 |
| Inventory | $0 | $29,700 | $31,570 | $35,310 | $40,040 | $47,300 | $50,600 | $38,500 | $32,120 | $42,240 | $45,320 | $51,810 | $59,730 |
| Other Current Assets | $0 | $0 | $0 | $0 | $0 | $0 | $0 | $0 | $0 | $0 | $0 | $0 | $0 |
| Total Current Assets | $49,000 | $114,886 | $147,620 | $144,465 | $155,072 | $172,959 | $181,631 | $155,836 | $154,258 | $186,295 | $191,156 | $212,816 | $238,743 |
| Long-term Assets | |||||||||||||
| Long-term Assets | $50,000 | $50,000 | $50,000 | $50,000 | $50,000 | $50,000 | $50,000 | $50,000 | $50,000 | $50,000 | $50,000 | $50,000 | $50,000 |
| Accumulated Depreciation | $0 | $595 | $1,190 | $1,785 | $2,380 | $2,975 | $3,570 | $4,165 | $4,760 | $5,355 | $5,950 | $6,545 | $7,140 |
| Total Long-term Assets | $50,000 | $49,405 | $48,810 | $48,215 | $47,620 | $47,025 | $46,430 | $45,835 | $45,240 | $44,645 | $44,050 | $43,455 | $42,860 |
| Total Assets | $99,000 | $164,291 | $196,430 | $192,680 | $202,692 | $219,984 | $228,061 | $201,671 | $199,498 | $230,940 | $235,206 | $256,271 | $281,603 |
| Liabilities and Capital | Month 1 | Month 2 | Month 3 | Month 4 | Month 5 | Month 6 | Month 7 | Month 8 | Month 9 | Month 10 | Month 11 | Month 12 | |
| Current Liabilities | |||||||||||||
| Accounts Payable | $0 | $76,785 | $51,777 | $47,882 | $54,378 | $64,645 | $64,287 | $36,032 | $34,785 | $61,823 | $58,875 | $69,286 | $79,475 |
| Current Borrowing | $0 | $0 | $0 | $0 | $0 | $0 | $0 | $0 | $0 | $0 | $0 | $0 | $0 |
| Other Current Liabilities | $0 | $0 | $0 | $0 | $0 | $0 | $0 | $0 | $0 | $0 | $0 | $0 | $0 |
| Subtotal Current Liabilities | $0 | $76,785 | $51,777 | $47,882 | $54,378 | $64,645 | $64,287 | $36,032 | $34,785 | $61,823 | $58,875 | $69,286 | $79,475 |
| Long-term Liabilities | $100,000 | $98,334 | $96,668 | $95,002 | $93,336 | $91,670 | $90,004 | $88,338 | $86,672 | $85,006 | $83,340 | $81,674 | $80,008 |
| Total Liabilities | $100,000 | $175,119 | $148,445 | $142,884 | $147,714 | $156,315 | $154,291 | $124,370 | $121,457 | $146,829 | $142,215 | $150,960 | $159,483 |
| Paid-in Capital | $150,000 | $150,000 | $218,000 | $218,000 | $218,000 | $218,000 | $218,000 | $218,000 | $218,000 | $218,000 | $218,000 | $218,000 | $218,000 |
| Retained Earnings | ($151,000) | ($151,000) | ($151,000) | ($151,000) | ($151,000) | ($151,000) | ($151,000) | ($151,000) | ($151,000) | ($151,000) | ($151,000) | ($151,000) | ($151,000) |
| Earnings | $0 | ($9,828) | ($19,016) | ($17,204) | ($12,022) | ($3,331) | $6,770 | $10,301 | $11,041 | $17,111 | $25,991 | $38,311 | $55,120 |
| Total Capital | ($1,000) | ($10,828) | $47,984 | $49,796 | $54,978 | $63,669 | $73,770 | $77,301 | $78,041 | $84,111 | $92,991 | $105,311 | $122,120 |
| Total Liabilities and Capital | $99,000 | $164,291 | $196,430 | $192,680 | $202,692 | $219,984 | $228,061 | $201,671 | $199,498 | $230,940 | $235,206 | $256,271 | $281,603 |
| Net Worth | ($1,000) | ($10,828) | $47,984 | $49,796 | $54,978 | $63,669 | $73,770 | $77,301 | $78,041 | $84,111 | $92,991 | $105,311 | $122,120 |


