
The Supreme Courts
Executive Summary
The Supreme Courts will be a full-service multisport complex situated along Boulder Highway in Henderson, Nevada. There are currently no other sports facilities like this one anywhere in the Las Vegas Valley. This plan will be used to define the scope of our services, as well as a means of gaining the necessary investments to open the facility. It will also be used on a continual basis in the evaluation of The Supreme Courts mission, goals, and objectives.
The keys to success for The Supreme Courts are our ability to market effectively, creating an unmatched “cool” atmosphere where people will like to be, and hiring qualified/certified and knowledgeable staff to aid in the running of our programs and leagues.
The sports and fitness club industry is a booming business that produced over $10.6 billion last year and is projected to continue its current trend according to **. The Supreme Courts is conservatively projecting a strong net profit in its first year of operation with this number increasing significantly by the end of year three.
** Confidential or proprietary information deleted.
1.1 Objectives
The main objectives for The Supreme Courts are as follows:
- Sell 800 memberships in year one, 1,200 by the end of year two, and 1,600 by the end of year three.
- Organize and develop various sports leagues and market them effectively so as to fill them to capacity (i.e. seven leagues running twice a year with 8 – 12 teams per league).
- Sponsor and/or support four community events in our first year of operation.
- Show at least a 5% return to investors in the first year of operation.
1.2 Mission
The Supreme Courts is a multisport and fitness complex designed to be used by the residents of Henderson and the surrounding areas. It is our mission to provide the best programs, staff, and equipment, to fully meet the various sports and fitness needs of our members, while generating a profit for the owners and investors. Besides providing an excellent value to our customers, The Supreme Courts is determined to create an unmatched sporting atmosphere that will add to the enjoyment of every member and employee of the facility. Dedicated to the community, The Supreme Courts strives to support and sponsor community events, as well as host them whenever possible. Our hope is that through the use of our facility, members’ enjoyment and appreciation for sports, fitness, and for life will be enhanced.
1.3 Keys to Success
The Keys to Success for The Supreme Courts are as follows:
- Marketing: We must make The Supreme Courts a common name in the Las Vegas Valley and creatively market our services to each of our market segments.
- Atmosphere of facility: By creating an unmatched “cool” atmosphere in The Supreme Courts through the use of first class equipment, floors, colors, and big screen TVs, people will want to frequent our facility often and our ability to retain members will be enhanced.
- Knowledgeable/qualified staff and management: By providing the users of the facility with knowledgeable and qualified staff who show genuine concern for the patrons, people will feel comfortable and confident that The Supreme Courts can meet all of their sport and fitness needs.
Company Summary
The Supreme Courts is a new multisport complex that will provide both members and casual users an opportunity to participate in a variety of sports and leisure programs and activities.
2.1 Company Ownership
The Supreme Courts will be a Limited Partnership C corporation that will be privately owned. Brian Ehlert and Rich Bohne will own 26% of the company each, while 12 other limited partners will each own 4%.
2.2 Start-up Summary
Our start-up requirements come to $2,500,000. Included in these costs is the land, building, all development costs, equipment, and start-up capital. The assumptions are shown in the following table and chart.

| Start-up | |
| Requirements | |
| Start-up Expenses | |
| Legal | $30,000 |
| Air Structure | $415,000 |
| Hardwood Floors | $160,000 |
| Basketball Rims, Stands… | $55,000 |
| Exercise Equipment and Misc. | $150,000 |
| Stucco | $8,000 |
| Block Fence | $90,000 |
| Concrete Footings and Slab | $185,000 |
| Site Preparation | $20,000 |
| Consultants | $3,500 |
| Mechanical | $25,000 |
| Second Floor Development and Offices | $210,000 |
| Office Equipment | $65,000 |
| Paving and Landscaping | $112,000 |
| Management Fee | $100,000 |
| Promotional Costs | $40,000 |
| Design Fees | $30,000 |
| Land | $465,000 |
| Total Start-up Expenses | $2,163,500 |
| Start-up Assets | |
| Cash Required | $336,500 |
| Start-up Inventory | $0 |
| Other Current Assets | $0 |
| Long-term Assets | $0 |
| Total Assets | $336,500 |
| Total Requirements | $2,500,000 |
| Start-up Funding | |
| Start-up Expenses to Fund | $2,163,500 |
| Start-up Assets to Fund | $336,500 |
| Total Funding Required | $2,500,000 |
| Assets | |
| Non-cash Assets from Start-up | $0 |
| Cash Requirements from Start-up | $336,500 |
| Additional Cash Raised | $0 |
| Cash Balance on Starting Date | $336,500 |
| Total Assets | $336,500 |
| Liabilities and Capital | |
| Liabilities | |
| Current Borrowing | $0 |
| Long-term Liabilities | $1,250,000 |
| Accounts Payable (Outstanding Bills) | $0 |
| Other Current Liabilities (interest-free) | $0 |
| Total Liabilities | $1,250,000 |
| Capital | |
| Planned Investment | |
| Investor 1 | $100,000 |
| Investor 2 | $100,000 |
| Investor 3 | $100,000 |
| Investor 4 | $100,000 |
| Investor 5 | $100,000 |
| Investor 6 | $100,000 |
| Investor 7 | $100,000 |
| Investor 8 | $100,000 |
| Other | $450,000 |
| Additional Investment Requirement | $0 |
| Total Planned Investment | $1,250,000 |
| Loss at Start-up (Start-up Expenses) | ($2,163,500) |
| Total Capital | ($913,500) |
| Total Capital and Liabilities | $336,500 |
| Total Funding | $2,500,000 |
Services
The Supreme Courts will be a multisport complex that provides its users with various services. A first class fitness and lifestyle center, three full-size basketball courts that can also accommodate many other sports, a food and beverage/lounge area, a massage therapy clinic and other amenities such as offices, a conference room, a childcare center, and full-service locker rooms will all be available in the facility. Along with these amenities, The Supreme Courts will provide its users with qualified and knowledgeable people to make sure all of their sport and fitness needs are met.
3.1 Weights and Fitness
The Supreme Courts will house a large fitness and lifestyle center that will match or exceed any other in the city. This fitness and lifestyle center will include top-of-the-line equipment in free weights, machine weights, and aerobic machines. The majority of the lifestyle center will be located on the upper level of the complex that will surround the three basketball courts. This will allow the users the option of watching the activities going on down below, or to watch one of the many TVs that will be set up for their enjoyment.
This aspect of the facility will be run by a certified strength and conditioning specialist (CSCS) who will hire and train his/her staff to meet the demands of the members. This person will report to and work directly with the general partners of The Supreme Courts and his/her duties will include, but will not be limited to, general supervision, personalized training for members, program development for camps and clinics, and aiding in the marketing and promotional aspects of the facility.
3.2 Courts
Three full-size basketball courts and six volleyball courts will highlight the main floor of The Supreme Courts. Along with these two sports, the floors will be able to accommodate badminton, indoor soccer, indoor field hockey, touch football, gymnastics, dance, aerobics, and more. These hardwood courts will be manufactured and installed by the industry leader, Robbins Sport Surfaces, and will be the premier sports floors in all of Henderson. With the added attraction of world class portable basketball systems from Schelde North America or BPI, The Supreme Courts will quickly become known as the place to be for leagues, camps, or pick-up games.
With his education and vast experience in this area, the scheduling of events and activities on these floors will be done by Rich Bohne, one of the general partners of The Supreme Courts. The development of sports leagues, camps, and clinics, along with other various day-to-day operations of the facility will also be Rich’s responsibility.
3.3 Food Services
On the upper level surrounding the courts there will be a food and beverage area where users of the facility can replenish their bodies. This area has been placed on the upper level so the users may have a bird’s-eye view of the happenings on the courts while enjoying their favorite non-alcoholic beverage and/or snack. Included in this area will be various big screen TVs that will show either sporting events, sports news, or appropriate programs that users wish to watch. This aspect of the facility will be crucial in providing the desired atmosphere The Supreme Courts hopes to create.

A qualified, experienced person will be hired to run this aspect of the facility. He/she will have the responsibility to meet necessary standards and to report to, and work directly with the general partners of The Supreme Courts to make sure the needs of the users in this area are met. If additional staff are required, this person will hire and train those people in accordance with The Supreme Courts policies.
3.4 Massage Therapy
An area for a massage therapy clinic will be located on the main floor of the facility. This service will be available to both the general public and users of the facility at a cost reflective of the industry standard. This amenity will be an added bonus to the users of The Supreme Courts as it will be conveniently located right inside the complex.
At this time, The Supreme Courts is deciding on whether to hire their own massage therapists or to lease out the space to an already established massage therapy practice.
3.5 Other
Other features and services The Supreme Courts will have include:
- Full-service locker rooms for both men and women that will accommodate up to 120 lockers. Large shower areas, benches, sinks, and bathroom facilities will all be included as well.
- A large childcare area that will allow users to access the facility at their convenience. The childcare will be on the first level of the complex and have a large play area that will be continuously monitored by our childcare staff. The staff will be responsible for the care and well-being of the children they are watching, along with providing a fun and interesting environment for the children. This service will be offered to the facility users for a very minimal fee.
- An administrative area housing various offices and a conference room will be located on the main floor of the facility.
- A pro shop will be strategically placed in The Supreme Courts to attract impulsive buyers. Users will pass through the pro shop upon entering and exiting the facility. The pro shop will sell sports shoes, and apparel and eventually our own line of products that will be available exclusively at The Supreme Courts. Brian Ehlert, one of the general partners, will be in charge of inventory for the pro shop, and general staff will be involved in the daily sales and service.
Market Analysis Summary
The Supreme Courts will be the only multisport complex of its kind in all of the Las Vegas Valley. Some aspects of the facility will cater mainly to the City of Henderson residents. Other aspects however, will appeal to everyone in the valley.
Because of the diversity in the activities and programs available in The Supreme Courts, our market segments vary from dedicated workout junkies to people who just want a few hours of fun and recreation.
From 1990 to 1999, memberships at health clubs rose from 20.7 million to 30.6 million according to the latest statistics from **. This trend is projected to continue. Not only that, but frequent users of fitness clubs soared by 84% during the same period. From recent surveys of over 360 fitness clubs (conducted by **), the eight most profitable programs for fitness centers were identified. The Supreme Courts offers six of these eight, including the top three. Due to the market for fitness clubs in Henderson, The Supreme Courts has a very bright future.
The average number of members for multipurpose clubs registered with ** (The Supreme Courts will be a ** member) in 1999 was over 2,104. The total number of ** clubs in 1999 was 3,185, many of which were fitness only clubs which average just over 1,200 members.
** Confidential or proprietary information deleted.
4.1 Market Segmentation
- Weekend Warriors: an important market segment for The Supreme Courts will be the weekend warriors. These people don’t like to be locked into long-term commitments but like the freedom to come and go when the opportunity presents itself. These people will be a target market for special promotions and periodic activities.
- Hardcore Fitness Buffs: another market segment for our facility will be those who view themselves as dedicated fitness gurus. These people are very particular about the type of workout equipment they use, and usually enjoy the opportunity to be “looked at” by other users of the facility. As long as the right equipment is available, these people are willing to lock into long-term commitments with a facility.
- Gym Rats: a third market segment for The Supreme Courts will be those people who love to be in a gym. Usually associated with basketball, gym rats seek to find places to play, practice, or just hang out, usually at a very reasonable price. The better the atmosphere, and the more people to watch them, the more gym rats are attracted to a facility. This is a very large market for The Supreme Courts.
- Families: this is a smaller, but important market segment for our facility. We have “something for everyone” and that will attract families that want to become members of the facility as well as families who simply want a few hours of fun every now and again. These people will also be the main target for summer camps and activities that allow for fun and education for the children while the parents enjoy some relatively cheap babysitting.
- Senior Citizens: this market segment will be our fastest growing market as more senior citizens are retiring to Henderson than any other group. When provided with health promoting programs, senior citizens are willing to participate due to the new focus on physical activity and the constant encouragement from family and physicians. In fact, this group was the fastest growing club membership segment over the last 10 years according to **. It grew up to four times faster than other segments.
- Business Travelers: another small market segment, travelers to the City of Henderson will be attracted to use this facility for various purposes without the pressure or hassle of a required membership. The simple daily walk-in fee will make The Supreme Courts a very attractive place to workout for these people.
- Tourists: another small market segment for The Supreme Courts will be the tourists who are attracted to the facility because of its size and appearance. Fabric structures often become tourist attractions because of their different and interesting appearance.
** Confidential or proprietary information deleted.

| Market Analysis | |||||||
| Year 1 | Year 2 | Year 3 | Year 4 | Year 5 | |||
| Potential Customers | Growth | CAGR | |||||
| Weekend Warriors | 3% | 132,479 | 136,453 | 140,547 | 144,763 | 149,106 | 3.00% |
| Hardcore Fitness Gurus | 3% | 6,080 | 6,262 | 6,450 | 6,643 | 6,843 | 3.00% |
| Gym Rats | 3% | 325,000 | 334,750 | 344,792 | 355,136 | 365,790 | 3.00% |
| Families | 3% | 50,000 | 51,500 | 53,045 | 54,636 | 56,275 | 3.00% |
| Senior Citizens | 7% | 24,320 | 26,022 | 27,843 | 29,793 | 31,878 | 7.00% |
| Tourists | 1% | 10,000 | 10,100 | 10,201 | 10,303 | 10,406 | 1.00% |
| Business Travelers | 0% | 3,000 | 3,000 | 3,000 | 3,000 | 3,000 | 0.00% |
| Total | 3.14% | 550,879 | 568,087 | 585,878 | 604,274 | 623,298 | 3.14% |
4.2 Target Market Segment Strategy
Due to the size and convenient location of our facility, many people will be attracted to The Supreme Courts to see what we have to offer. However, we will not be content to just wait for customers to come to us. Instead, we will focus our marketing strategies on those market segments who match our offerings. The great thing about marketing The Supreme Courts, is that each market segment relates, in certain ways, to all the others.
Our main objective with our early marketing strategy will be to get people into our facility. Once people see what we have to offer, and feel the atmosphere that will be created, they will want to return and participate in the many activities and programs that will be available to them.
Some of the ways The Supreme Courts will get people into the facility include:
- Offering tours to junior and senior high schools during the building and early completion stages of the facility.
- Having a large promotional event to open the facility that will be free to everyone.
- Hosting and/or supporting various community events that will bring in many people who otherwise would not come.
- Mailing out free day passes to all of the surrounding area.
Following the opening of The Supreme Courts, print and radio media will be used to promote both the facility and the programs that are being offered to attract new people from all over the Las Vegas Valley.
As a ** member, many resources are also available for marketing and promotional ideas that have been effective for other facilities.
** Confidential or proprietary information deleted.
4.3 Service Business Analysis
The sport and fitness business is a booming industry, with total revenues for 1999 over $10.6 billion. Because of this, fitness clubs are popping up all over the place, including airports and grocery stores! The size and scope of these clubs vary from small, individually owned workout facilities, to very elaborate, publicly owned franchises. According to statistics from **, as of July, 2000 there were 15,910 clubs in the USA with over 30 million total club members. That is an average of over 1,800 members per club. Multisport clubs, like The Supreme Courts, averaged over 2,800 members per club. One of The Supreme Courts challenges is to establish itself as a legitimate sport and fitness club that is appealing to each of its market segments, and position itself as a great deal for members and casual walk-ins alike.
** Confidential or proprietary information deleted.
4.3.1 Competition and Buying Patterns
The competition for The Supreme Courts in Henderson include two ** clubs, **, **, and **. At all of these clubs, various types of memberships are available. Some require long-term commitments while other have a minimum commitment of at least one full month.
Potential fitness club members will usually compare clubs and find the one that fits their specific needs, or has the amenities that he/she wants. Value is usually very important to these potential members as most people want to get the best value for their dollar.
** Confidential or proprietary information deleted.
Strategy and Implementation Summary
The Supreme Courts has a very large potential market. Because of the small number of recreation and fitness facilities in the City of Henderson, we feel we will become the number one sports and fitness complex quickly. This will be accomplished by actively and continuously promoting The Supreme Courts through radio and media advertisements as well as through hosting and supporting various community events.
5.1 Competitive Edge
The Supreme Courts’ competitive edge is two fold. First, The Supreme Courts is the only multisport complex that offers three full-size basketball courts that are available for the members and the community to use and/or rent. On top of this, the scope and variation of the programs that will be run from this facility are unmatched by any other club in the area. The second part of our competitive edge is the location, size, and appearance of the facility that will attract many people into the complex.
By maintaining our focus in our strategy, marketing, program development, and fulfillment, The Supreme Courts will be known as the top sports and fitness club in Henderson. We should be aware, however, that our competitive edge may be diluted if we become complacent in our program development and implementation. It will be important for The Supreme Courts to keep up with the current trends in both sport and fitness programs.
5.2 Sales Strategy
Sales in the sport and fitness club business are based on the services and amenities provided by the facility. The “something for everyone” slogan fits perfectly with The Supreme Courts. All of the users of our facility must feel like they are getting the best possible value for their money. If there is a better value, for equal services, The Supreme Courts will match or beat that value for our customers.
Each person desiring a membership at The Supreme Courts will be able to sit down with a representative and be notified of all of their membership options. During this brief discussion, the person will be also be informed of all of the services, programs, and amenities The Supreme Courts has to offer. It will be important to establish a relationship of trust with our members as membership retainment is an important aspect in our business.
5.2.1 Sales Forecast
The following table and chart give a run-down on forecasted sales for each of our sources of revenue.


| Sales Forecast | |||
| Year 1 | Year 2 | Year 3 | |
| Unit Sales | |||
| Membership Fees | 780 | 1,000 | 1,200 |
| Walk-in Fees | 10,800 | 10,800 | 11,340 |
| Camps, Clinics, and Programs | 720 | 720 | 1,500 |
| Court Rentals | 720 | 720 | 756 |
| Leagues | 2,304 | 2,048 | 2,150 |
| Personal Training | 1,080 | 1,134 | 1,191 |
| Pro Shop | 12 | 1 | 1 |
| Food and Beverages | 12 | 1 | 1 |
| Massage Therapy Clinic | 1,050 | 1,080 | 1,134 |
| Other (Outside Tournaments…) | 4 | 0 | 0 |
| Total Unit Sales | 17,482 | 17,504 | 19,273 |
| Unit Prices | Year 1 | Year 2 | Year 3 |
| Membership Fees | $647.00 | $679.35 | $679.35 |
| Walk-in Fees | $4.50 | $4.75 | $5.00 |
| Camps, Clinics, and Programs | $25.00 | $75.00 | $78.75 |
| Court Rentals | $40.00 | $42.00 | $44.10 |
| Leagues | $65.00 | $68.25 | $71.65 |
| Personal Training | $15.00 | $16.00 | $17.00 |
| Pro Shop | $1,500.00 | $18,900.00 | $19,845.00 |
| Food and Beverages | $2,500.00 | $31,500.00 | $33,075.00 |
| Massage Therapy Clinic | $5.00 | $5.25 | $5.50 |
| Other (Outside Tournaments…) | $4,000.00 | $4,200.00 | $4,350.00 |
| Sales | |||
| Membership Fees | $504,660 | $679,350 | $815,220 |
| Walk-in Fees | $48,600 | $51,300 | $56,700 |
| Camps, Clinics, and Programs | $18,000 | $54,000 | $118,125 |
| Court Rentals | $28,800 | $30,240 | $33,340 |
| Leagues | $149,760 | $139,776 | $154,048 |
| Personal Training | $16,200 | $18,144 | $20,247 |
| Pro Shop | $18,000 | $18,900 | $19,845 |
| Food and Beverages | $30,000 | $31,500 | $33,075 |
| Massage Therapy Clinic | $5,250 | $5,670 | $6,237 |
| Other (Outside Tournaments…) | $16,000 | $0 | $0 |
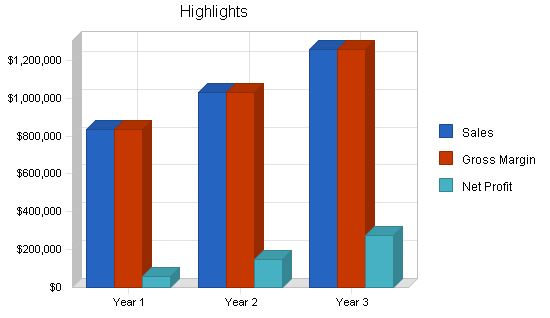
| Total Sales | $835,270 | $1,028,880 | $1,256,836 |
| Direct Unit Costs | Year 1 | Year 2 | Year 3 |
| Membership Fees | $0.00 | $0.00 | $0.00 |
| Walk-in Fees | $0.00 | $0.00 | $0.00 |
| Camps, Clinics, and Programs | $0.00 | $0.00 | $0.00 |
| Court Rentals | $0.00 | $0.00 | $0.00 |
| Leagues | $0.00 | $0.00 | $0.00 |
| Personal Training | $0.00 | $0.00 | $0.00 |
| Pro Shop | $0.00 | $0.00 | $0.00 |
| Food and Beverages | $0.00 | $0.00 | $0.00 |
| Massage Therapy Clinic | $0.00 | $0.00 | $0.00 |
| Other (Outside Tournaments…) | $0.00 | $0.00 | $0.00 |
| Direct Cost of Sales | |||
| Membership Fees | $0 | $0 | $0 |
| Walk-in Fees | $0 | $0 | $0 |
| Camps, Clinics, and Programs | $0 | $0 | $0 |
| Court Rentals | $0 | $0 | $0 |
| Leagues | $0 | $0 | $0 |
| Personal Training | $0 | $0 | $0 |
| Pro Shop | $0 | $0 | $0 |
| Food and Beverages | $0 | $0 | $0 |
| Massage Therapy Clinic | $0 | $0 | $0 |
| Other (Outside Tournaments…) | $0 | $0 | $0 |
| Subtotal Direct Cost of Sales | $0 | $0 | $0 |
5.3 Milestones
The accompanying table lists important program milestones, with dates and managers in charge, and budgets for each. The milestone schedule indicates our emphasis on planning for implementation.
What the table doesn’t show is the commitment behind it. Our business plan includes complete provisions for plan-vs.-actual analysis, and we will hold monthly follow-up meetings to discuss the variance and course corrections.

| Milestones | |||||
| Milestone | Start Date | End Date | Budget | Manager | Department |
| Business Plan | 9/11/2000 | 9/22/2000 | $0 | Rich | Department |
| Concept Plan Review | 9/15/2000 | 10/3/2000 | $3,500 | Rich | Department |
| Financial Backing Presentations | 3/1/1999 | 4/1/1999 | $0 | TBA | Department |
| Company Set Up | 3/1/1999 | 4/1/1999 | $0 | TBA | Department |
| Logo Design | 3/1/1999 | 4/1/1999 | $0 | TBA | Department |
| Other | 3/1/1999 | 3/1/1999 | $0 | TBA | Department |
| Totals | $3,500 | ||||
Management Summary
The initial management team for The Supreme Courts depends mainly on the general partners. Rich Bohne and Brian Ehlert will stay within their expertise in running the day-to-day operations of the facility such as scheduling, marketing, and promotions, along with running and developing various leagues and programs for the community. Back-up for the general partners will include staff members who will compensate for the founders lack of experience in each area. For example, qualified personnel will be hired for the food and beverage, massage therapy, and fitness areas. General help staff will be hired on a need basis as the users of the facility increase. There will also be a janitor hired for basic cleanliness and maintenance of the complex.
The Supreme Courts will have a total staff of 13 people in the first year of operation. It is projected that an additional three people will be added each year for the next two years. The majority of the salaries are projected to raise 5% per year for the first three years. This estimate may be conservative.
6.1 Personnel Plan
See the following table for a more detailed list of The Supreme Courts personnel.
| Personnel Plan | |||
| Year 1 | Year 2 | Year 3 | |
| Rich Bohne | $60,000 | $63,000 | $66,150 |
| Brian Ehlert | $60,000 | $63,000 | $66,150 |
| Fitness Area Manager | $36,000 | $37,800 | $39,690 |
| Food Service Manager | $30,000 | $31,500 | $33,075 |
| Book Keeper | $21,600 | $22,680 | $23,814 |
| General Staff (7) | $138,300 | $145,215 | $152,476 |
| Janitor | $15,000 | $15,750 | $16,538 |
| Other | $0 | $59,900 | $118,800 |
| Total People | 13 | 16 | 19 |
| Total Payroll | $360,900 | $438,845 | $516,692 |
Financial Plan
We are assuming start-up capital of $336,500 and a long-term (20 year) bank loan of $1,250,000. The remainder of the necessary financing will come through investors.
7.1 Important Assumptions
The financial plan depends on important assumptions, most of which are shown in the following table as annual assumptions. The monthly assumptions are included in the appendix. From the beginning, we recognize that collection days are critical, but not a factor we can influence easily. At least we are planning on the problem, and dealing with it. Interest rates, tax rates, and personnel burden are based on conservative assumptions.
Some of the more important underlying assumptions are:
- We assume a strong economy, without major recession.
- We assume the rate of growth for the number of sport and fitness club memberships will continue.
| General Assumptions | |||
| Year 1 | Year 2 | Year 3 | |
| Plan Month | 1 | 2 | 3 |
| Current Interest Rate | 10.00% | 10.00% | 10.00% |
| Long-term Interest Rate | 10.00% | 10.00% | 10.00% |
| Tax Rate | 16.25% | 15.00% | 16.25% |
| Other | 0 | 0 | 0 |
7.2 Break-even Analysis
The following table and chart summarize our break-even analysis.

| Break-even Analysis | |
| Monthly Units Break-even | 1,104 |
| Monthly Revenue Break-even | $52,752 |
| Assumptions: | |
| Average Per-Unit Revenue | $47.78 |
| Average Per-Unit Variable Cost | $0.00 |
| Estimated Monthly Fixed Cost | $52,752 |
7.3 Projected Profit and Loss
Our projected profit and loss is shown on the following table. We show a conservative estimate of net profits/sales, with that increasing each year. According to the research done through ** and **, these projections are very conservative and should be easily attained.
The detailed monthly projections are included in the appendix.
** Confidential or proprietary information deleted.


| Pro Forma Profit and Loss | |||
| Year 1 | Year 2 | Year 3 | |
| Sales | $835,270 | $1,028,880 | $1,256,836 |
| Direct Cost of Sales | $0 | $0 | $0 |
| Other | $0 | $0 | $0 |
| Total Cost of Sales | $0 | $0 | $0 |
| Gross Margin | $835,270 | $1,028,880 | $1,256,836 |
| Gross Margin % | 100.00% | 100.00% | 100.00% |
| Expenses | |||
| Payroll | $360,900 | $438,845 | $516,692 |
| Sales and Marketing and Other Expenses | $85,392 | $87,170 | $65,068 |
| Depreciation | $0 | $0 | $0 |
| Leased Equipment | $48,000 | $50,400 | $50,400 |
| Repairs and Maintanence | $4,800 | $5,040 | $5,292 |
| Landscape Maintanence | $3,600 | $3,780 | $3,969 |
| Accounting Fees | $4,800 | $5,040 | $5,292 |
| Legal Fees | $2,400 | $2,520 | $2,646 |
| Telephone | $3,000 | $3,150 | $3,307 |
| Utilities (Gas, Electric, Water, Sewer) | $54,000 | $56,700 | $59,535 |
| Insurance | $12,000 | $12,600 | $13,230 |
| Rent | $0 | $0 | $0 |
| Payroll Taxes | $54,135 | $65,827 | $77,504 |
| Other | $0 | $0 | $0 |
| Total Operating Expenses | $633,027 | $731,072 | $802,935 |
| Profit Before Interest and Taxes | $202,243 | $297,808 | $453,901 |
| EBITDA | $202,243 | $297,808 | $453,901 |
| Interest Expense | $125,000 | $125,000 | $125,000 |
| Taxes Incurred | $21,135 | $25,921 | $53,446 |
| Net Profit | $56,108 | $146,887 | $275,455 |
| Net Profit/Sales | 6.72% | 14.28% | 21.92% |
7.4 Projected Cash Flow
The following cash flow projections show our annual amounts only. For more detailed monthly projections please see the appendix.
Cash flow projections are critical to our success. The monthly cash flow is shown in the illustration, with one bar representing the cash flow per month, and the other the monthly balance. The annual cash flow figures are included here and the more important detailed monthly numbers are included in the appendix.

| Pro Forma Cash Flow | |||
| Year 1 | Year 2 | Year 3 | |
| Cash Received | |||
| Cash from Operations | |||
| Cash Sales | $334,108 | $411,552 | $502,734 |
| Cash from Receivables | $444,036 | $604,086 | $738,511 |
| Subtotal Cash from Operations | $778,144 | $1,015,638 | $1,241,246 |
| Additional Cash Received | |||
| Sales Tax, VAT, HST/GST Received | $0 | $0 | $0 |
| New Current Borrowing | $0 | $0 | $0 |
| New Other Liabilities (interest-free) | $0 | $0 | $0 |
| New Long-term Liabilities | $0 | $0 | $0 |
| Sales of Other Current Assets | $0 | $0 | $0 |
| Sales of Long-term Assets | $0 | $0 | $0 |
| New Investment Received | $0 | $0 | $0 |
| Subtotal Cash Received | $778,144 | $1,015,638 | $1,241,246 |
| Expenditures | Year 1 | Year 2 | Year 3 |
| Expenditures from Operations | |||
| Cash Spending | $360,900 | $438,845 | $516,692 |
| Bill Payments | $387,740 | $437,246 | $462,919 |
| Subtotal Spent on Operations | $748,640 | $876,091 | $979,611 |
| Additional Cash Spent | |||
| Sales Tax, VAT, HST/GST Paid Out | $0 | $0 | $0 |
| Principal Repayment of Current Borrowing | $0 | $0 | $0 |
| Other Liabilities Principal Repayment | $0 | $0 | $0 |
| Long-term Liabilities Principal Repayment | $0 | $0 | $0 |
| Purchase Other Current Assets | $0 | $0 | $0 |
| Purchase Long-term Assets | $0 | $0 | $0 |
| Dividends | $0 | $0 | $0 |
| Subtotal Cash Spent | $748,640 | $876,091 | $979,611 |
| Net Cash Flow | $29,503 | $139,547 | $261,635 |
| Cash Balance | $366,003 | $505,550 | $767,185 |
7.5 Projected Balance Sheet
The balance sheet in the following table shows managed but sufficient growth of net worth, and a sufficiently healthy financial position. The monthly estimates are included in the appendix.
| Pro Forma Balance Sheet | |||
| Year 1 | Year 2 | Year 3 | |
| Assets | |||
| Current Assets | |||
| Cash | $366,003 | $505,550 | $767,185 |
| Accounts Receivable | $57,126 | $70,368 | $85,958 |
| Inventory | $0 | $0 | $0 |
| Other Current Assets | $0 | $0 | $0 |
| Total Current Assets | $423,130 | $575,918 | $853,143 |
| Long-term Assets | |||
| Long-term Assets | $0 | $0 | $0 |
| Accumulated Depreciation | $0 | $0 | $0 |
| Total Long-term Assets | $0 | $0 | $0 |
| Total Assets | $423,130 | $575,918 | $853,143 |
| Liabilities and Capital | Year 1 | Year 2 | Year 3 |
| Current Liabilities | |||
| Accounts Payable | $30,521 | $36,423 | $38,194 |
| Current Borrowing | $0 | $0 | $0 |
| Other Current Liabilities | $0 | $0 | $0 |
| Subtotal Current Liabilities | $30,521 | $36,423 | $38,194 |
| Long-term Liabilities | $1,250,000 | $1,250,000 | $1,250,000 |
| Total Liabilities | $1,280,521 | $1,286,423 | $1,288,194 |
| Paid-in Capital | $1,250,000 | $1,250,000 | $1,250,000 |
| Retained Earnings | ($2,163,500) | ($2,107,392) | ($1,960,505) |
| Earnings | $56,108 | $146,887 | $275,455 |
| Total Capital | ($857,392) | ($710,505) | ($435,050) |
| Total Liabilities and Capital | $423,130 | $575,918 | $853,143 |
| Net Worth | ($857,392) | ($710,505) | ($435,050) |
7.6 Business Ratios
Business ratios for the years of this plan are shown below. Industry profile ratios based on the Standard Industrial Classification (SIC) code 7991, Sports Programs – Indoor Courts, are shown for comparison.
| Ratio Analysis | ||||
| Year 1 | Year 2 | Year 3 | Industry Profile | |
| Sales Growth | 0.00% | 23.18% | 22.16% | 15.90% |
| Percent of Total Assets | ||||
| Accounts Receivable | 13.50% | 12.22% | 10.08% | 4.30% |
| Inventory | 0.00% | 0.00% | 0.00% | 3.60% |
| Other Current Assets | 0.00% | 0.00% | 0.00% | 31.10% |
| Total Current Assets | 100.00% | 100.00% | 100.00% | 39.00% |
| Long-term Assets | 0.00% | 0.00% | 0.00% | 61.00% |
| Total Assets | 100.00% | 100.00% | 100.00% | 100.00% |
| Current Liabilities | 7.21% | 6.32% | 4.48% | 34.80% |
| Long-term Liabilities | 295.42% | 217.04% | 146.52% | 27.60% |
| Total Liabilities | 302.63% | 223.37% | 150.99% | 62.40% |
| Net Worth | -202.63% | -123.37% | -50.99% | 37.60% |
| Percent of Sales | ||||
| Sales | 100.00% | 100.00% | 100.00% | 100.00% |
| Gross Margin | 100.00% | 100.00% | 100.00% | 0.00% |
| Selling, General & Administrative Expenses | 92.14% | 85.72% | 77.76% | 73.20% |
| Advertising Expenses | 2.87% | 2.45% | 0.00% | 2.40% |
| Profit Before Interest and Taxes | 24.21% | 28.94% | 36.11% | 2.70% |
| Main Ratios | ||||
| Current | 13.86 | 15.81 | 22.34 | 1.10 |
| Quick | 13.86 | 15.81 | 22.34 | 0.73 |
| Total Debt to Total Assets | 302.63% | 223.37% | 150.99% | 62.40% |
| Pre-tax Return on Net Worth | -9.01% | -24.32% | -75.60% | 3.00% |
| Pre-tax Return on Assets | 18.26% | 30.01% | 38.55% | 7.90% |
| Additional Ratios | Year 1 | Year 2 | Year 3 | |
| Net Profit Margin | 6.72% | 14.28% | 21.92% | n.a |
| Return on Equity | 0.00% | 0.00% | 0.00% | n.a |
| Activity Ratios | ||||
| Accounts Receivable Turnover | 8.77 | 8.77 | 8.77 | n.a |
| Collection Days | 58 | 38 | 38 | n.a |
| Inventory Turnover | 0.00 | 0.00 | 0.00 | n.a |
| Accounts Payable Turnover | 13.70 | 12.17 | 12.17 | n.a |
| Payment Days | 27 | 28 | 29 | n.a |
| Total Asset Turnover | 1.97 | 1.79 | 1.47 | n.a |
| Debt Ratios | ||||
| Debt to Net Worth | 0.00 | 0.00 | 0.00 | n.a |
| Current Liab. to Liab. | 0.02 | 0.03 | 0.03 | n.a |
| Liquidity Ratios | ||||
| Net Working Capital | $392,608 | $539,495 | $814,950 | n.a |
| Interest Coverage | 1.62 | 2.38 | 3.63 | n.a |
| Additional Ratios | ||||
| Assets to Sales | 0.51 | 0.56 | 0.68 | n.a |
| Current Debt/Total Assets | 7% | 6% | 4% | n.a |
| Acid Test | 11.99 | 13.88 | 20.09 | n.a |
| Sales/Net Worth | 0.00 | 0.00 | 0.00 | n.a |
| Dividend Payout | 0.00 | 0.00 | 0.00 | n.a |
Appendix
| Sales Forecast | |||||||||||||
| Month 1 | Month 2 | Month 3 | Month 4 | Month 5 | Month 6 | Month 7 | Month 8 | Month 9 | Month 10 | Month 11 | Month 12 | ||
| Unit Sales | |||||||||||||
| Membership Fees | 0% | 175 | 150 | 40 | 40 | 35 | 35 | 80 | 65 | 45 | 40 | 40 | 35 |
| Walk-in Fees | 0% | 900 | 900 | 900 | 900 | 900 | 900 | 900 | 900 | 900 | 900 | 900 | 900 |
| Camps, Clinics, and Programs | 0% | 60 | 60 | 60 | 60 | 60 | 60 | 60 | 60 | 60 | 60 | 60 | 60 |
| Court Rentals | 0% | 60 | 60 | 60 | 60 | 60 | 60 | 60 | 60 | 60 | 60 | 60 | 60 |
| Leagues | 0% | 0 | 256 | 256 | 256 | 256 | 0 | 256 | 256 | 256 | 256 | 0 | 256 |
| Personal Training | 0% | 90 | 90 | 90 | 90 | 90 | 90 | 90 | 90 | 90 | 90 | 90 | 90 |
| Pro Shop | 0% | 1 | 1 | 1 | 1 | 1 | 1 | 1 | 1 | 1 | 1 | 1 | 1 |
| Food and Beverages | 0% | 1 | 1 | 1 | 1 | 1 | 1 | 1 | 1 | 1 | 1 | 1 | 1 |
| Massage Therapy Clinic | 0% | 60 | 90 | 90 | 90 | 90 | 90 | 90 | 90 | 90 | 90 | 90 | 90 |
| Other (Outside Tournaments…) | 0% | 0 | 1 | 0 | 0 | 1 | 0 | 0 | 1 | 0 | 0 | 1 | 0 |
| Total Unit Sales | 1,347 | 1,609 | 1,498 | 1,498 | 1,494 | 1,237 | 1,538 | 1,524 | 1,503 | 1,498 | 1,243 | 1,493 | |
| Unit Prices | Month 1 | Month 2 | Month 3 | Month 4 | Month 5 | Month 6 | Month 7 | Month 8 | Month 9 | Month 10 | Month 11 | Month 12 | |
| Membership Fees | $647.00 | $647.00 | $647.00 | $647.00 | $647.00 | $647.00 | $647.00 | $647.00 | $647.00 | $647.00 | $647.00 | $647.00 | |
| Walk-in Fees | $4.50 | $4.50 | $4.50 | $4.50 | $4.50 | $4.50 | $4.50 | $4.50 | $4.50 | $4.50 | $4.50 | $4.50 | |
| Camps, Clinics, and Programs | $25.00 | $25.00 | $25.00 | $25.00 | $25.00 | $25.00 | $25.00 | $25.00 | $25.00 | $25.00 | $25.00 | $25.00 | |
| Court Rentals | $40.00 | $40.00 | $40.00 | $40.00 | $40.00 | $40.00 | $40.00 | $40.00 | $40.00 | $40.00 | $40.00 | $40.00 | |
| Leagues | $65.00 | $65.00 | $65.00 | $65.00 | $65.00 | $65.00 | $65.00 | $65.00 | $65.00 | $65.00 | $65.00 | $65.00 | |
| Personal Training | $15.00 | $15.00 | $15.00 | $15.00 | $15.00 | $15.00 | $15.00 | $15.00 | $15.00 | $15.00 | $15.00 | $15.00 | |
| Pro Shop | $1,500.00 | $1,500.00 | $1,500.00 | $1,500.00 | $1,500.00 | $1,500.00 | $1,500.00 | $1,500.00 | $1,500.00 | $1,500.00 | $1,500.00 | $1,500.00 | |
| Food and Beverages | $2,500.00 | $2,500.00 | $2,500.00 | $2,500.00 | $2,500.00 | $2,500.00 | $2,500.00 | $2,500.00 | $2,500.00 | $2,500.00 | $2,500.00 | $2,500.00 | |
| Massage Therapy Clinic | $5.00 | $5.00 | $5.00 | $5.00 | $5.00 | $5.00 | $5.00 | $5.00 | $5.00 | $5.00 | $5.00 | $5.00 | |
| Other (Outside Tournaments…) | $4,000.00 | $4,000.00 | $4,000.00 | $4,000.00 | $4,000.00 | $4,000.00 | $4,000.00 | $4,000.00 | $4,000.00 | $4,000.00 | $4,000.00 | $4,000.00 | |
| Sales | |||||||||||||
| Membership Fees | $113,225 | $97,050 | $25,880 | $25,880 | $22,645 | $22,645 | $51,760 | $42,055 | $29,115 | $25,880 | $25,880 | $22,645 | |
| Walk-in Fees | $4,050 | $4,050 | $4,050 | $4,050 | $4,050 | $4,050 | $4,050 | $4,050 | $4,050 | $4,050 | $4,050 | $4,050 | |
| Camps, Clinics, and Programs | $1,500 | $1,500 | $1,500 | $1,500 | $1,500 | $1,500 | $1,500 | $1,500 | $1,500 | $1,500 | $1,500 | $1,500 | |
| Court Rentals | $2,400 | $2,400 | $2,400 | $2,400 | $2,400 | $2,400 | $2,400 | $2,400 | $2,400 | $2,400 | $2,400 | $2,400 | |
| Leagues | $0 | $16,640 | $16,640 | $16,640 | $16,640 | $0 | $16,640 | $16,640 | $16,640 | $16,640 | $0 | $16,640 | |
| Personal Training | $1,350 | $1,350 | $1,350 | $1,350 | $1,350 | $1,350 | $1,350 | $1,350 | $1,350 | $1,350 | $1,350 | $1,350 | |
| Pro Shop | $1,500 | $1,500 | $1,500 | $1,500 | $1,500 | $1,500 | $1,500 | $1,500 | $1,500 | $1,500 | $1,500 | $1,500 | |
| Food and Beverages | $2,500 | $2,500 | $2,500 | $2,500 | $2,500 | $2,500 | $2,500 | $2,500 | $2,500 | $2,500 | $2,500 | $2,500 | |
| Massage Therapy Clinic | $300 | $450 | $450 | $450 | $450 | $450 | $450 | $450 | $450 | $450 | $450 | $450 | |
| Other (Outside Tournaments…) | $0 | $4,000 | $0 | $0 | $4,000 | $0 | $0 | $4,000 | $0 | $0 | $4,000 | $0 | |
| Total Sales | $126,825 | $131,440 | $56,270 | $56,270 | $57,035 | $36,395 | $82,150 | $76,445 | $59,505 | $56,270 | $43,630 | $53,035 | |
| Direct Unit Costs | Month 1 | Month 2 | Month 3 | Month 4 | Month 5 | Month 6 | Month 7 | Month 8 | Month 9 | Month 10 | Month 11 | Month 12 | |
| Membership Fees | 0.00% | $0.00 | $0.00 | $0.00 | $0.00 | $0.00 | $0.00 | $0.00 | $0.00 | $0.00 | $0.00 | $0.00 | $0.00 |
| Walk-in Fees | 0.00% | $0.00 | $0.00 | $0.00 | $0.00 | $0.00 | $0.00 | $0.00 | $0.00 | $0.00 | $0.00 | $0.00 | $0.00 |
| Camps, Clinics, and Programs | 0.00% | $0.00 | $0.00 | $0.00 | $0.00 | $0.00 | $0.00 | $0.00 | $0.00 | $0.00 | $0.00 | $0.00 | $0.00 |
| Court Rentals | 0.00% | $0.00 | $0.00 | $0.00 | $0.00 | $0.00 | $0.00 | $0.00 | $0.00 | $0.00 | $0.00 | $0.00 | $0.00 |
| Leagues | 0.00% | $0.00 | $0.00 | $0.00 | $0.00 | $0.00 | $0.00 | $0.00 | $0.00 | $0.00 | $0.00 | $0.00 | $0.00 |
| Personal Training | 0.00% | $0.00 | $0.00 | $0.00 | $0.00 | $0.00 | $0.00 | $0.00 | $0.00 | $0.00 | $0.00 | $0.00 | $0.00 |
| Pro Shop | 0.00% | $0.00 | $0.00 | $0.00 | $0.00 | $0.00 | $0.00 | $0.00 | $0.00 | $0.00 | $0.00 | $0.00 | $0.00 |
| Food and Beverages | 0.00% | $0.00 | $0.00 | $0.00 | $0.00 | $0.00 | $0.00 | $0.00 | $0.00 | $0.00 | $0.00 | $0.00 | $0.00 |
| Massage Therapy Clinic | 0.00% | $0.00 | $0.00 | $0.00 | $0.00 | $0.00 | $0.00 | $0.00 | $0.00 | $0.00 | $0.00 | $0.00 | $0.00 |
| Other (Outside Tournaments…) | 0.00% | $0.00 | $0.00 | $0.00 | $0.00 | $0.00 | $0.00 | $0.00 | $0.00 | $0.00 | $0.00 | $0.00 | $0.00 |
| Direct Cost of Sales | |||||||||||||
| Membership Fees | $0 | $0 | $0 | $0 | $0 | $0 | $0 | $0 | $0 | $0 | $0 | $0 | |
| Walk-in Fees | $0 | $0 | $0 | $0 | $0 | $0 | $0 | $0 | $0 | $0 | $0 | $0 | |
| Camps, Clinics, and Programs | $0 | $0 | $0 | $0 | $0 | $0 | $0 | $0 | $0 | $0 | $0 | $0 | |
| Court Rentals | $0 | $0 | $0 | $0 | $0 | $0 | $0 | $0 | $0 | $0 | $0 | $0 | |
| Leagues | $0 | $0 | $0 | $0 | $0 | $0 | $0 | $0 | $0 | $0 | $0 | $0 | |
| Personal Training | $0 | $0 | $0 | $0 | $0 | $0 | $0 | $0 | $0 | $0 | $0 | $0 | |
| Pro Shop | $0 | $0 | $0 | $0 | $0 | $0 | $0 | $0 | $0 | $0 | $0 | $0 | |
| Food and Beverages | $0 | $0 | $0 | $0 | $0 | $0 | $0 | $0 | $0 | $0 | $0 | $0 | |
| Massage Therapy Clinic | $0 | $0 | $0 | $0 | $0 | $0 | $0 | $0 | $0 | $0 | $0 | $0 | |
| Other (Outside Tournaments…) | $0 | $0 | $0 | $0 | $0 | $0 | $0 | $0 | $0 | $0 | $0 | $0 | |
| Subtotal Direct Cost of Sales | $0 | $0 | $0 | $0 | $0 | $0 | $0 | $0 | $0 | $0 | $0 | $0 | |
| Personnel Plan | |||||||||||||
| Month 1 | Month 2 | Month 3 | Month 4 | Month 5 | Month 6 | Month 7 | Month 8 | Month 9 | Month 10 | Month 11 | Month 12 | ||
| Rich Bohne | 0% | $5,000 | $5,000 | $5,000 | $5,000 | $5,000 | $5,000 | $5,000 | $5,000 | $5,000 | $5,000 | $5,000 | $5,000 |
| Brian Ehlert | 0% | $5,000 | $5,000 | $5,000 | $5,000 | $5,000 | $5,000 | $5,000 | $5,000 | $5,000 | $5,000 | $5,000 | $5,000 |
| Fitness Area Manager | 0% | $3,000 | $3,000 | $3,000 | $3,000 | $3,000 | $3,000 | $3,000 | $3,000 | $3,000 | $3,000 | $3,000 | $3,000 |
| Food Service Manager | 0% | $2,500 | $2,500 | $2,500 | $2,500 | $2,500 | $2,500 | $2,500 | $2,500 | $2,500 | $2,500 | $2,500 | $2,500 |
| Book Keeper | 0% | $1,800 | $1,800 | $1,800 | $1,800 | $1,800 | $1,800 | $1,800 | $1,800 | $1,800 | $1,800 | $1,800 | $1,800 |
| General Staff (7) | 0% | $11,525 | $11,525 | $11,525 | $11,525 | $11,525 | $11,525 | $11,525 | $11,525 | $11,525 | $11,525 | $11,525 | $11,525 |
| Janitor | 0% | $1,250 | $1,250 | $1,250 | $1,250 | $1,250 | $1,250 | $1,250 | $1,250 | $1,250 | $1,250 | $1,250 | $1,250 |
| Other | 0% | $0 | $0 | $0 | $0 | $0 | $0 | $0 | $0 | $0 | $0 | $0 | $0 |
| Total People | 13 | 13 | 13 | 13 | 13 | 13 | 13 | 13 | 13 | 13 | 13 | 13 | |
| Total Payroll | $30,075 | $30,075 | $30,075 | $30,075 | $30,075 | $30,075 | $30,075 | $30,075 | $30,075 | $30,075 | $30,075 | $30,075 | |
| General Assumptions | |||||||||||||
| Month 1 | Month 2 | Month 3 | Month 4 | Month 5 | Month 6 | Month 7 | Month 8 | Month 9 | Month 10 | Month 11 | Month 12 | ||
| Plan Month | 1 | 2 | 3 | 4 | 5 | 6 | 7 | 8 | 9 | 10 | 11 | 12 | |
| Current Interest Rate | 10.00% | 10.00% | 10.00% | 10.00% | 10.00% | 10.00% | 10.00% | 10.00% | 10.00% | 10.00% | 10.00% | 10.00% | |
| Long-term Interest Rate | 10.00% | 10.00% | 10.00% | 10.00% | 10.00% | 10.00% | 10.00% | 10.00% | 10.00% | 10.00% | 10.00% | 10.00% | |
| Tax Rate | 30.00% | 15.00% | 15.00% | 15.00% | 15.00% | 15.00% | 15.00% | 15.00% | 15.00% | 15.00% | 15.00% | 15.00% | |
| Other | 0 | 0 | 0 | 0 | 0 | 0 | 0 | 0 | 0 | 0 | 0 | 0 | |
| Pro Forma Profit and Loss | |||||||||||||
| Month 1 | Month 2 | Month 3 | Month 4 | Month 5 | Month 6 | Month 7 | Month 8 | Month 9 | Month 10 | Month 11 | Month 12 | ||
| Sales | $126,825 | $131,440 | $56,270 | $56,270 | $57,035 | $36,395 | $82,150 | $76,445 | $59,505 | $56,270 | $43,630 | $53,035 | |
| Direct Cost of Sales | $0 | $0 | $0 | $0 | $0 | $0 | $0 | $0 | $0 | $0 | $0 | $0 | |
| Other | $0 | $0 | $0 | $0 | $0 | $0 | $0 | $0 | $0 | $0 | $0 | $0 | |
| Total Cost of Sales | $0 | $0 | $0 | $0 | $0 | $0 | $0 | $0 | $0 | $0 | $0 | $0 | |
| Gross Margin | $126,825 | $131,440 | $56,270 | $56,270 | $57,035 | $36,395 | $82,150 | $76,445 | $59,505 | $56,270 | $43,630 | $53,035 | |
| Gross Margin % | 100.00% | 100.00% | 100.00% | 100.00% | 100.00% | 100.00% | 100.00% | 100.00% | 100.00% | 100.00% | 100.00% | 100.00% | |
| Expenses | |||||||||||||
| Payroll | $30,075 | $30,075 | $30,075 | $30,075 | $30,075 | $30,075 | $30,075 | $30,075 | $30,075 | $30,075 | $30,075 | $30,075 | |
| Sales and Marketing and Other Expenses | $7,116 | $7,116 | $7,116 | $7,116 | $7,116 | $7,116 | $7,116 | $7,116 | $7,116 | $7,116 | $7,116 | $7,116 | |
| Depreciation | $0 | $0 | $0 | $0 | $0 | $0 | $0 | $0 | $0 | $0 | $0 | $0 | |
| Leased Equipment | $4,000 | $4,000 | $4,000 | $4,000 | $4,000 | $4,000 | $4,000 | $4,000 | $4,000 | $4,000 | $4,000 | $4,000 | |
| Repairs and Maintanence | $400 | $400 | $400 | $400 | $400 | $400 | $400 | $400 | $400 | $400 | $400 | $400 | |
| Landscape Maintanence | $300 | $300 | $300 | $300 | $300 | $300 | $300 | $300 | $300 | $300 | $300 | $300 | |
| Accounting Fees | $400 | $400 | $400 | $400 | $400 | $400 | $400 | $400 | $400 | $400 | $400 | $400 | |
| Legal Fees | $200 | $200 | $200 | $200 | $200 | $200 | $200 | $200 | $200 | $200 | $200 | $200 | |
| Telephone | $250 | $250 | $250 | $250 | $250 | $250 | $250 | $250 | $250 | $250 | $250 | $250 | |
| Utilities (Gas, Electric, Water, Sewer) | $4,500 | $4,500 | $4,500 | $4,500 | $4,500 | $4,500 | $4,500 | $4,500 | $4,500 | $4,500 | $4,500 | $4,500 | |
| Insurance | $1,000 | $1,000 | $1,000 | $1,000 | $1,000 | $1,000 | $1,000 | $1,000 | $1,000 | $1,000 | $1,000 | $1,000 | |
| Rent | $0 | $0 | $0 | $0 | $0 | $0 | $0 | $0 | $0 | $0 | $0 | $0 | |
| Payroll Taxes | 15% | $4,511 | $4,511 | $4,511 | $4,511 | $4,511 | $4,511 | $4,511 | $4,511 | $4,511 | $4,511 | $4,511 | $4,511 |
| Other | $0 | $0 | $0 | $0 | $0 | $0 | $0 | $0 | $0 | $0 | $0 | $0 | |
| Total Operating Expenses | $52,752 | $52,752 | $52,752 | $52,752 | $52,752 | $52,752 | $52,752 | $52,752 | $52,752 | $52,752 | $52,752 | $52,752 | |
| Profit Before Interest and Taxes | $74,073 | $78,688 | $3,518 | $3,518 | $4,283 | ($16,357) | $29,398 | $23,693 | $6,753 | $3,518 | ($9,122) | $283 | |
| EBITDA | $74,073 | $78,688 | $3,518 | $3,518 | $4,283 | ($16,357) | $29,398 | $23,693 | $6,753 | $3,518 | ($9,122) | $283 | |
| Interest Expense | $10,417 | $10,417 | $10,417 | $10,417 | $10,417 | $10,417 | $10,417 | $10,417 | $10,417 | $10,417 | $10,417 | $10,417 | |
| Taxes Incurred | $19,097 | $10,241 | ($1,035) | ($1,035) | ($920) | ($4,016) | $2,847 | $1,991 | ($550) | ($1,035) | ($2,931) | ($1,520) | |
| Net Profit | $44,559 | $58,030 | ($5,864) | ($5,864) | ($5,214) | ($22,758) | $16,134 | $11,285 | ($3,114) | ($5,864) | ($16,608) | ($8,614) | |
| Net Profit/Sales | 35.13% | 44.15% | -10.42% | -10.42% | -9.14% | -62.53% | 19.64% | 14.76% | -5.23% | -10.42% | -38.07% | -16.24% | |
| Pro Forma Cash Flow | |||||||||||||
| Month 1 | Month 2 | Month 3 | Month 4 | Month 5 | Month 6 | Month 7 | Month 8 | Month 9 | Month 10 | Month 11 | Month 12 | ||
| Cash Received | |||||||||||||
| Cash from Operations | |||||||||||||
| Cash Sales | $50,730 | $52,576 | $22,508 | $22,508 | $22,814 | $14,558 | $32,860 | $30,578 | $23,802 | $22,508 | $17,452 | $21,214 | |
| Cash from Receivables | $0 | $2,537 | $76,187 | $77,361 | $33,762 | $33,777 | $33,808 | $22,752 | $49,176 | $45,528 | $35,638 | $33,509 | |
| Subtotal Cash from Operations | $50,730 | $55,113 | $98,695 | $99,869 | $56,576 | $48,335 | $66,668 | $53,330 | $72,978 | $68,036 | $53,090 | $54,723 | |
| Additional Cash Received | |||||||||||||
| Sales Tax, VAT, HST/GST Received | 0.00% | $0 | $0 | $0 | $0 | $0 | $0 | $0 | $0 | $0 | $0 | $0 | $0 |
| New Current Borrowing | $0 | $0 | $0 | $0 | $0 | $0 | $0 | $0 | $0 | $0 | $0 | $0 | |
| New Other Liabilities (interest-free) | $0 | $0 | $0 | $0 | $0 | $0 | $0 | $0 | $0 | $0 | $0 | $0 | |
| New Long-term Liabilities | $0 | $0 | $0 | $0 | $0 | $0 | $0 | $0 | $0 | $0 | $0 | $0 | |
| Sales of Other Current Assets | $0 | $0 | $0 | $0 | $0 | $0 | $0 | $0 | $0 | $0 | $0 | $0 | |
| Sales of Long-term Assets | $0 | $0 | $0 | $0 | $0 | $0 | $0 | $0 | $0 | $0 | $0 | $0 | |
| New Investment Received | $0 | $0 | $0 | $0 | $0 | $0 | $0 | $0 | $0 | $0 | $0 | $0 | |
| Subtotal Cash Received | $50,730 | $55,113 | $98,695 | $99,869 | $56,576 | $48,335 | $66,668 | $53,330 | $72,978 | $68,036 | $53,090 | $54,723 | |
| Expenditures | Month 1 | Month 2 | Month 3 | Month 4 | Month 5 | Month 6 | Month 7 | Month 8 | Month 9 | Month 10 | Month 11 | Month 12 | |
| Expenditures from Operations | |||||||||||||
| Cash Spending | $30,075 | $30,075 | $30,075 | $30,075 | $30,075 | $30,075 | $30,075 | $30,075 | $30,075 | $30,075 | $30,075 | $30,075 | |
| Bill Payments | $1,740 | $51,896 | $42,959 | $32,059 | $32,063 | $32,071 | $29,307 | $35,913 | $35,001 | $32,528 | $31,996 | $30,210 | |
| Subtotal Spent on Operations | $31,815 | $81,971 | $73,034 | $62,134 | $62,138 | $62,146 | $59,382 | $65,988 | $65,076 | $62,603 | $62,071 | $60,285 | |
| Additional Cash Spent | |||||||||||||
| Sales Tax, VAT, HST/GST Paid Out | $0 | $0 | $0 | $0 | $0 | $0 | $0 | $0 | $0 | $0 | $0 | $0 | |
| Principal Repayment of Current Borrowing | $0 | $0 | $0 | $0 | $0 | $0 | $0 | $0 | $0 | $0 | $0 | $0 | |
| Other Liabilities Principal Repayment | $0 | $0 | $0 | $0 | $0 | $0 | $0 | $0 | $0 | $0 | $0 | $0 | |
| Long-term Liabilities Principal Repayment | $0 | $0 | $0 | $0 | $0 | $0 | $0 | $0 | $0 | $0 | $0 | $0 | |
| Purchase Other Current Assets | $0 | $0 | $0 | $0 | $0 | $0 | $0 | $0 | $0 | $0 | $0 | $0 | |
| Purchase Long-term Assets | $0 | $0 | $0 | $0 | $0 | $0 | $0 | $0 | $0 | $0 | $0 | $0 | |
| Dividends | $0 | $0 | $0 | $0 | $0 | $0 | $0 | $0 | $0 | $0 | $0 | $0 | |
| Subtotal Cash Spent | $31,815 | $81,971 | $73,034 | $62,134 | $62,138 | $62,146 | $59,382 | $65,988 | $65,076 | $62,603 | $62,071 | $60,285 | |
| Net Cash Flow | $18,915 | ($26,858) | $25,662 | $37,735 | ($5,562) | ($13,810) | $7,287 | ($12,657) | $7,902 | $5,433 | ($8,981) | ($5,562) | |
| Cash Balance | $355,415 | $328,557 | $354,219 | $391,953 | $386,391 | $372,581 | $379,868 | $367,210 | $375,113 | $380,546 | $371,565 | $366,003 | |
| Pro Forma Balance Sheet | |||||||||||||
| Month 1 | Month 2 | Month 3 | Month 4 | Month 5 | Month 6 | Month 7 | Month 8 | Month 9 | Month 10 | Month 11 | Month 12 | ||
| Assets | Starting Balances | ||||||||||||
| Current Assets | |||||||||||||
| Cash | $336,500 | $355,415 | $328,557 | $354,219 | $391,953 | $386,391 | $372,581 | $379,868 | $367,210 | $375,113 | $380,546 | $371,565 | $366,003 |
| Accounts Receivable | $0 | $76,095 | $152,423 | $109,997 | $66,399 | $66,858 | $54,917 | $70,399 | $93,514 | $80,041 | $68,275 | $58,815 | $57,126 |
| Inventory | $0 | $0 | $0 | $0 | $0 | $0 | $0 | $0 | $0 | $0 | $0 | $0 | $0 |
| Other Current Assets | $0 | $0 | $0 | $0 | $0 | $0 | $0 | $0 | $0 | $0 | $0 | $0 | $0 |
| Total Current Assets | $336,500 | $431,510 | $480,980 | $464,216 | $458,352 | $453,249 | $427,498 | $450,267 | $460,724 | $455,154 | $448,820 | $430,380 | $423,130 |
| Long-term Assets | |||||||||||||
| Long-term Assets | $0 | $0 | $0 | $0 | $0 | $0 | $0 | $0 | $0 | $0 | $0 | $0 | $0 |
| Accumulated Depreciation | $0 | $0 | $0 | $0 | $0 | $0 | $0 | $0 | $0 | $0 | $0 | $0 | $0 |
| Total Long-term Assets | $0 | $0 | $0 | $0 | $0 | $0 | $0 | $0 | $0 | $0 | $0 | $0 | $0 |
| Total Assets | $336,500 | $431,510 | $480,980 | $464,216 | $458,352 | $453,249 | $427,498 | $450,267 | $460,724 | $455,154 | $448,820 | $430,380 | $423,130 |
| Liabilities and Capital | Month 1 | Month 2 | Month 3 | Month 4 | Month 5 | Month 6 | Month 7 | Month 8 | Month 9 | Month 10 | Month 11 | Month 12 | |
| Current Liabilities | |||||||||||||
| Accounts Payable | $0 | $50,451 | $41,890 | $30,990 | $30,990 | $31,101 | $28,109 | $34,743 | $33,916 | $31,460 | $30,990 | $29,158 | $30,521 |
| Current Borrowing | $0 | $0 | $0 | $0 | $0 | $0 | $0 | $0 | $0 | $0 | $0 | $0 | $0 |
| Other Current Liabilities | $0 | $0 | $0 | $0 | $0 | $0 | $0 | $0 | $0 | $0 | $0 | $0 | $0 |
| Subtotal Current Liabilities | $0 | $50,451 | $41,890 | $30,990 | $30,990 | $31,101 | $28,109 | $34,743 | $33,916 | $31,460 | $30,990 | $29,158 | $30,521 |
| Long-term Liabilities | $1,250,000 | $1,250,000 | $1,250,000 | $1,250,000 | $1,250,000 | $1,250,000 | $1,250,000 | $1,250,000 | $1,250,000 | $1,250,000 | $1,250,000 | $1,250,000 | $1,250,000 |
| Total Liabilities | $1,250,000 | $1,300,451 | $1,291,890 | $1,280,990 | $1,280,990 | $1,281,101 | $1,278,109 | $1,284,743 | $1,283,916 | $1,281,460 | $1,280,990 | $1,279,158 | $1,280,521 |
| Paid-in Capital | $1,250,000 | $1,250,000 | $1,250,000 | $1,250,000 | $1,250,000 | $1,250,000 | $1,250,000 | $1,250,000 | $1,250,000 | $1,250,000 | $1,250,000 | $1,250,000 | $1,250,000 |
| Retained Earnings | ($2,163,500) | ($2,163,500) | ($2,163,500) | ($2,163,500) | ($2,163,500) | ($2,163,500) | ($2,163,500) | ($2,163,500) | ($2,163,500) | ($2,163,500) | ($2,163,500) | ($2,163,500) | ($2,163,500) |
| Earnings | $0 | $44,559 | $102,590 | $96,726 | $90,862 | $85,648 | $62,890 | $79,024 | $90,308 | $87,194 | $81,330 | $64,722 | $56,108 |
| Total Capital | ($913,500) | ($868,941) | ($810,910) | ($816,774) | ($822,638) | ($827,852) | ($850,610) | ($834,476) | ($823,192) | ($826,306) | ($832,170) | ($848,778) | ($857,392) |
| Total Liabilities and Capital | $336,500 | $431,510 | $480,980 | $464,216 | $458,352 | $453,249 | $427,498 | $450,267 | $460,724 | $455,154 | $448,820 | $430,380 | $423,130 |
| Net Worth | ($913,500) | ($868,941) | ($810,910) | ($816,774) | ($822,638) | ($827,852) | ($850,610) | ($834,476) | ($823,192) | ($826,306) | ($832,170) | ($848,778) | ($857,392) |

