
Falls River Theatre
Executive Summary
Falls River is a smaller town that lost its only movie theatre over 10 years ago. Since then, residents wishing to enjoy a night out at the movies have to drive about 30 miles to a theatre. And once they get to the theatre, it is usually a large antiseptic mega-plex, void of character.
The Falls River Theatre will provide the residents of Falls River with a long-awaited, hometown movie theatre. The films shown will be second run releases of the most popular movies in two target markets: families and young adults. The building that will house the facility is the historic old theatre building, built in 1936 and long-time home to the town’s acting companies. Since its closing it has been used only occassionally for community functions. Before its grand re-opening, the owners will restore the building to its former glory as one of the town’s main destinations for evening entertainment.
The two owners, Samantha Farmer and Steve Brinksman have the skills, expertise and capital to make this theatre succeed. Samantha has successfully managed a large movie house for seven years, developing skills in theatre management and movie selection while establishing important relationships with key people in the industry. Steve has the skills and ability to restore and upgrade the building so that it will be comfortable and welcoming.
With an substantial initial investment by the owners, we see modest profits by year two.

1.1 Keys to Success
- Proper film selection for the audience and the theater’s environment.
- Revenues from a mix of both traditional movie fare and other quality snacks and beverages.
- Careful management of internal finances to control costs.
- Great customer service.
1.2 Objectives
- Healthy sales in the first year, more than doubling by year three.
- Excellent revenues from concessions.
- Modest by stable profit margin by year two.
1.3 Mission
Falls River Theatre’s mission is to give our customers a big city entertainment experience in a small town. Our customers will relax in comfort and watch high-quality presentations of popular second-run movies, all within a short walk or drive from home. This is a convenience that Falls River residents have had to do without since the local theatre closed eleven years ago.
We aim to please the local community (who can wait a few weeks to see their favorite movies and don’t want to pay big city, new release prices). We will also provide our customers with satisfying and reasonably priced snack foods and beverages.
Company Summary
The Falls River Theatre, a movie house with two screens and a capacity of 400, is located on Main Street in downtown Falls River, Wisconsin. Falls River, population 12,000, has been without a local movie theatre since 1992 when the old theatre, The Kinnick, closed down due to the death of its long time owner and the lack of an interested successor. Since that time, interested movie-goers in Falls River have had to drive 45 miles to the outskirts of Madison to go to a movie.
2.1 Company Ownership
The Falls River Theatre will begin operations as a sole proprietorship, owned and operated by its two founders: Samantha Farmer and Steve Brinksman.
2.2 Start-up Summary
Samantha Farmer and Steve Brinksman will be the main investors and operators of the Falls River Theatre. Samantha has been managing a multiplex theatre in Madison for the past seven years, gaining valuable experience while she looked for an opportunity to run her own theatre. Steve has been working part-time as a contractor/handy man in the local community.
The building where the theatre will be housed has been vacant, except for the occasional rental to a community group, since the closing of the former business. This has made the building’s owners anxious to collect a regular check, so they have agreed to rent the entire building for $900 per month for the first three years. There are some repairs and upgrades needed, especially in the balcony and snack bar areas. The founders will be responsible for those repairs and those estimates are included in the start-up expenses.
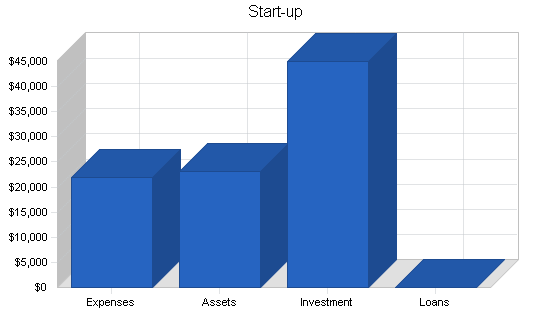
| Start-up Funding | |
| Start-up Expenses to Fund | $21,900 |
| Start-up Assets to Fund | $23,100 |
| Total Funding Required | $45,000 |
| Assets | |
| Non-cash Assets from Start-up | $10,700 |
| Cash Requirements from Start-up | $12,400 |
| Additional Cash Raised | $0 |
| Cash Balance on Starting Date | $12,400 |
| Total Assets | $23,100 |
| Liabilities and Capital | |
| Liabilities | |
| Current Borrowing | $0 |
| Long-term Liabilities | $0 |
| Accounts Payable (Outstanding Bills) | $0 |
| Other Current Liabilities (interest-free) | $0 |
| Total Liabilities | $0 |
| Capital | |
| Planned Investment | |
| Samatha Farmer | $30,000 |
| Steve Brinksman | $15,000 |
| Additional Investment Requirement | $0 |
| Total Planned Investment | $45,000 |
| Loss at Start-up (Start-up Expenses) | ($21,900) |
| Total Capital | $23,100 |
| Total Capital and Liabilities | $23,100 |
| Total Funding | $45,000 |
| Start-up | |
| Requirements | |
| Start-up Expenses | |
| Legal | $800 |
| Stationery etc. | $800 |
| Marketing materials and Advertising | $1,200 |
| Insurance (8 months) | $1,400 |
| Rent (8 months) | $2,700 |
| Counter/kitchen retrofit | $2,000 |
| Sound and Projection Equipment | $500 |
| Theatre repairs | $12,000 |
| Other | $500 |
| Total Start-up Expenses | $21,900 |
| Start-up Assets | |
| Cash Required | $12,400 |
| Start-up Inventory | $700 |
| Other Current Assets | $0 |
| Long-term Assets | $10,000 |
| Total Assets | $23,100 |
| Total Requirements | $45,000 |
Services
The Falls River Theatre will provide comfortable seating for its customers to view high quality, second run movies. The theatre’s management will be aided in movie selection by being able to see how movies have fared in their initial run, especially those that have shown success in the theatre’s two target markets: families and young adults. With two theatres in which to show movies, both markets can be targeted at the same time with minimal cannibalization.
A variety of quality, reasonably priced snack items and beverages will keep customers satisfied during their movie experience. The founders understand that the entire experience can be jeopardized by poor customer service and will seek to hire only the most customer service oriented personnel.
Market Analysis Summary
The Falls River Theatre is located in downtown Falls River, the shopping and entertainment center of town. This provides easy access for every resident of Falls River and a viable entertainment option any night of the week. The local business community has shown great support for a theatre since it would keep residents, and their spending dollars, in the community instead of one of the surrounding communities. A typical family (there are about 2,300 on Falls River) can expect to save approximately $48 for a night out at the movies by coming to a local theatre. This savings, along with quality movie selection, should keep people coming back regularly.
4.1 Market Segmentation
- Families – this segment focuses on adults and parents with younger children who don’t need to see the latest movies on release and seek an inexpensive, quality, family-oriented entertainment experience.
- Young adults – this segment is comprised of the 16-24 year old age group. This group is interested in seeing comedy and action/adventure type movies that are not directed at the younger and family markets.

| Market Analysis | |||||||
| Year 1 | Year 2 | Year 3 | Year 4 | Year 5 | |||
| Potential Customers | Growth | CAGR | |||||
| Family | 4% | 8,000 | 8,320 | 8,653 | 8,999 | 9,359 | 4.00% |
| Young adult | 4% | 4,000 | 4,160 | 4,326 | 4,499 | 4,679 | 4.00% |
| Other | 0% | 0 | 0 | 0 | 0 | 0 | 0.00% |
| Total | 4.00% | 12,000 | 12,480 | 12,979 | 13,498 | 14,038 | 4.00% |
4.2 Service Business Analysis
The Falls River community has been in need of a local movie house since the closure of its only theatre eleven years ago. With the closest movie complex located 45 miles away, movie goers options are limited – either a round trip drive of over 90 miles or in home rentals. For people who enjoy the big screen, neither offers a satisfying experience. The Falls River Theatre can satisfy those needs with quality movies in a comfortable, old-style movie theatre.
4.2.1 Competition and Buying Patterns
Competition for movie theatres comes in a number of different forms. In general you can describe the indirect competition as any entertainment alternative in the local area. Competition comes from the local skate park, pool hall and various restaurants. Restaurants also present a potential complimentary offering that we might exploit later through strategic alliances. As mention before, the direct competitor is the movie theater located 45 miles from Falls River. The inconvenience this presents for Falls River locals presents a tremendous opportunity for our theater.

4.3 Target Market Segment Strategy
These two market segments, families and young adults, are targeted specifically because they comprise the two largest segments of Falls River’s population. The Falls River Theatre is determined to be a community-oriented business and seeks to serve as much of the population as possible. With a small college in town, there is an ample student market, consumers who often have limited transportation options.
Strategy and Implementation Summary
The strategy is simple: provide fair-priced, quality entertainment close to home for the two markets that comprise the bulk of Falls River’s population.
5.1 Competitive Edge
Falls River Theatre has a distinct competitive edge in that it is the only movie theatre within 45 miles of Falls River. There are no plans at this time to build a theatre complex in the town and, since the theatre will occupy the town’s only building capable of effectively housing a theatre, there is limited direct competition. Competition will come mainly from several multi-plex theatres located in Madison, the closest being 45 miles from Falls River.
To ensure that Falls River residents are pleased with the products offered, the theatre will rely on the expertise of Samantha, who has seven years of successful theatre management experience. Since she began managing the theatre in Madison ticket sales have grown at a consistent 4% annually. This is in part due to her skills in movie selection and her emphasis on customer service. Once the theatre is up and running, her time will be devoted to movie selection, staff hiring and supervision, theatre marketing, and ordering for the snack bar.
Samantha has also developed strong relationships with several movie booking agents serving the Wisconsin area and has already negotiated an agreement. The agreement has the booking agents collecting 60% of the first year’s admission revenues. Each year after that the percentage will be reduced by 1.5% through year 5 when it stabilizes at 54%.
Steve has strong construction skills and is considered a craftsman by his peers. Initially his talents will be used to restore the theatre from its current state of slight disrepair into the town’s main attraction for evening entertainment. Once the restoration is complete, Steve will transition into a part-time role, maintaining the facility and equipment, working the counter and ticket booth, and eventually, ordering concession items.
5.2 Marketing Strategy
Falls River is a small enough town that word gets around quickly. We anticipate that a buzz will be created once the renovations begin. Excitement will build as the grand opening approaches. To encourage that excitement, we will have a countdown to opening on the building’s marquee. Concurrently, advertisements in both the local newspaper and the college’s daily will promote the opening with coupons for free items from the snack bar. Since a large share of profits will come from concessions, we want to let people know about our tasty snacks. Finally, we will use our website to keep our customers, especially the more web salvy college students, updated on the movie selection, which will change every two weeks.
5.3 Sales Strategy
The Falls River Theatre will appeal to two segments of the market:
- Adults and parents with children who seek local, fair-priced evening entertainment aimed at the whole family.
- Young adults who are interested in seeing recent releases but are constrained by an inability or unwillingness to travel.
The main sales strategy is to provide recent successful movie releases that appeal to both audiences. With two theatres, we will be able to target both segments simultaneously.
Ticket prices will be $5 for adults and $3 for children under 12.
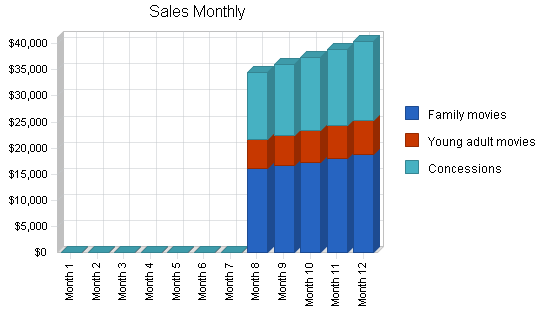
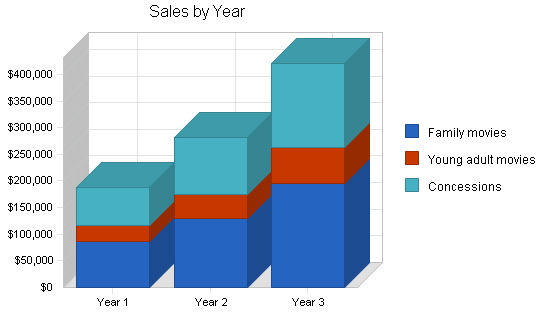
5.3.1 Sales Forecast
Sales will increase among both target segments as word spreads around town and to the surrounding communities. The increase in concession sales reflects the increased attendance. Concession sales are based on an average of $2.50 spent per ticket purchase.
| Sales Forecast | |||
| Year 1 | Year 2 | Year 3 | |
| Sales | |||
| Family movies | $86,661 | $129,992 | $194,988 |
| Young adult movies | $30,331 | $45,497 | $68,246 |
| Concessions | $70,196 | $105,293 | $157,940 |
| Total Sales | $187,188 | $280,782 | $421,173 |
| Direct Cost of Sales | Year 1 | Year 2 | Year 3 |
| Movies | $70,196 | $105,293 | $157,940 |
| Concessions | $21,059 | $31,588 | $47,382 |
| Subtotal Direct Cost of Sales | $91,254 | $136,881 | $205,322 |
5.4 Milestones
Steve will begin the theatre’s restoration in mid-January. Samantha will still be working with the theatre in Madison but will be able to contribute as-needed. Steve’s work will start inside, repairing and upgrading the facility as necessary. The main theatre’s balcony needs reinforcement. Repairs and upgrades to the concession area are also necessary. Painting will put the finishing touches on the interior of the structure. Finally, the interior should be fully restored by mid-March, once the upholstery repairs are finished.
By that time Samantha will have more time to begin work on the website, marketing materials and film selection. The weather should be turning better which will allow Steve to move outdoors to work on the front of the building. Minor repairs are needed on the marquee. A fresh coat of paint will prepare the building for customers. Samantha will also order any equipment for the concession area (some equipment is already in place and is useable), begin the hiring process and start the marketing. Finally, Steve will install the projection equipment and prepare for the grand opening.

| Milestones | |||||
| Milestone | Start Date | End Date | Budget | Manager | Department |
| Repairs and painting of interior | 1/18/2003 | 2/15/2003 | $11,000 | Steve | Marketing |
| Reupholstering theatre furniture | 2/25/2003 | 3/15/2003 | $5,000 | Steve | Marketing |
| Website design | 3/20/2003 | 3/25/2003 | $0 | Samantha | Marketing |
| Marketing materials design | 3/20/2003 | 3/25/2003 | $0 | Samantha | Web |
| Repairs and painting of exterior | 3/20/2003 | 3/25/2003 | $6,000 | Steve | Web |
| Set up projection equipment | 3/28/2003 | 4/2/2003 | $15,000 | Steve | Department |
| Film selection and scheduling | 3/28/2003 | 4/2/2003 | $250 | Samantha | Department |
| Concession equipment ordering | 4/5/2003 | 4/10/2003 | $4,000 | Samantha | Department |
| Staff hiring and scheduling | 4/5/2003 | 4/15/2003 | $200 | Samantha | Department |
| Initial marketing | 4/5/2003 | 4/20/2003 | $500 | Samantha | Department |
| Grand opening | 4/20/2003 | 4/20/2003 | $1,000 | Both | Department |
| Totals | $42,950 | ||||
Web Plan Summary
The website will be very simple. Its main purpose is to communicate to our customers what movies are showing at what times with links to each movie’s website and reviews. The design will feature an image of the theatre along with the a list of current movies and those that are coming soon and will be small enough to quickly load on most home computers. Since the movies will change every other week, maintenance should be fairly straight-forward. Arrangements have been made with both the local and college newspapers for links to our web site from theirs.
6.1 Website Marketing Strategy
The website address will be printed on tickets and it will be prominently placed on advertisements that we will run in the local paper.
6.2 Development Requirements
Development requirements are minimal, since the site will only be a few pages. The site will be built by a local website development firm. Once it has been created, the founders will be responsible for updating it with the latest movie listing each week. It is expected that this will take no longer than 1 -2 hours each week.
Management Summary
Samantha’s experience in theatre operations and management will be invaluable, she will manage the key tasks that represent the theatre once it’s up and running: film selection, marketing, and personnel. She will also initially take care of the selection and ordering of all the theatre’s supplies, including the concessions. Steve will eventually take over this role, once Sam has established the relationships and things have settled down somewhat.
Steve’s main responsibility will be to manage and execute the theatre’s restoration. Once that task is complete and the theatre is open for business, Steve will manage the maintenance of the building and work part-time in customer service (selling concessions) and ordering.
7.1 Personnel Plan
We believe that the key to customer service is happy employees. We will invest in a good team by compensating our part-time employees fairly.
| Personnel Plan | |||
| Year 1 | Year 2 | Year 3 | |
| Samantha Farmer | $33,600 | $35,280 | $37,044 |
| Steve Brinksman | $35,200 | $36,960 | $38,808 |
| Customer Service (4 part-time employees) | $9,350 | $9,818 | $10,308 |
| Other | $0 | $0 | $0 |
| Total People | 6 | 6 | 6 |
| Total Payroll | $78,150 | $82,058 | $86,160 |
Financial Plan
The following sections outline the financial analysis for Falls River Theatre.
8.1 Important Assumptions
The following shows the important General Assumptions for Falls River Theatre.
| General Assumptions | |||
| Year 1 | Year 2 | Year 3 | |
| Plan Month | 1 | 2 | 3 |
| Current Interest Rate | 10.00% | 10.00% | 10.00% |
| Long-term Interest Rate | 10.00% | 10.00% | 10.00% |
| Tax Rate | 30.00% | 30.00% | 30.00% |
| Other | 0 | 0 | 0 |
8.2 Break-even Analysis
The following Break-even Analysis shows the monthly break-even point.

| Break-even Analysis | |
| Monthly Revenue Break-even | $23,758 |
| Assumptions: | |
| Average Percent Variable Cost | 49% |
| Estimated Monthly Fixed Cost | $12,176 |
8.3 Projected Profit and Loss
The following table and charts show the Projected Profit and Loss for Falls River Theatre.


| Pro Forma Profit and Loss | |||
| Year 1 | Year 2 | Year 3 | |
| Sales | $187,188 | $280,782 | $421,173 |
| Direct Cost of Sales | $91,254 | $136,881 | $205,322 |
| Other Costs of Sales | $0 | $0 | $0 |
| Total Cost of Sales | $91,254 | $136,881 | $205,322 |
| Gross Margin | $95,934 | $143,901 | $215,851 |
| Gross Margin % | 51.25% | 51.25% | 51.25% |
| Expenses | |||
| Payroll | $78,150 | $82,058 | $86,160 |
| Sales and Marketing and Other Expenses | $3,300 | $0 | $400 |
| Depreciation | $1,992 | $0 | $0 |
| Rent | $10,800 | $0 | $900 |
| Utilities | $30,000 | $0 | $2,750 |
| Insurance | $10,150 | $0 | $1,100 |
| Payroll Taxes | $11,723 | $0 | $1,138 |
| Other | $0 | $0 | $0 |
| Total Operating Expenses | $146,115 | $82,058 | $92,448 |
| Profit Before Interest and Taxes | ($50,181) | $61,843 | $123,403 |
| EBITDA | ($48,189) | $61,843 | $123,403 |
| Interest Expense | $0 | $0 | $0 |
| Taxes Incurred | $0 | $18,553 | $37,021 |
| Net Profit | ($50,181) | $43,290 | $86,382 |
| Net Profit/Sales | -26.81% | 15.42% | 20.51% |
8.4 Projected Cash Flow
The two founders will be the sole investors. Samantha Farmer and Steve Brinksman will invest, both in early January.

| Pro Forma Cash Flow | |||
| Year 1 | Year 2 | Year 3 | |
| Cash Received | |||
| Cash from Operations | |||
| Cash Sales | $187,188 | $280,782 | $421,173 |
| Subtotal Cash from Operations | $187,188 | $280,782 | $421,173 |
| Additional Cash Received | |||
| Sales Tax, VAT, HST/GST Received | $0 | $0 | $0 |
| New Current Borrowing | $0 | $0 | $0 |
| New Other Liabilities (interest-free) | $0 | $0 | $0 |
| New Long-term Liabilities | $0 | $0 | $0 |
| Sales of Other Current Assets | $0 | $0 | $0 |
| Sales of Long-term Assets | $0 | $0 | $0 |
| New Investment Received | $60,000 | $0 | $0 |
| Subtotal Cash Received | $247,188 | $280,782 | $421,173 |
| Expenditures | Year 1 | Year 2 | Year 3 |
| Expenditures from Operations | |||
| Cash Spending | $78,150 | $82,058 | $86,160 |
| Bill Payments | $152,553 | $178,262 | $256,786 |
| Subtotal Spent on Operations | $230,703 | $260,320 | $342,946 |
| Additional Cash Spent | |||
| Sales Tax, VAT, HST/GST Paid Out | $0 | $0 | $0 |
| Principal Repayment of Current Borrowing | $0 | $0 | $0 |
| Other Liabilities Principal Repayment | $0 | $0 | $0 |
| Long-term Liabilities Principal Repayment | $0 | $0 | $0 |
| Purchase Other Current Assets | $0 | $0 | $0 |
| Purchase Long-term Assets | $0 | $0 | $0 |
| Dividends | $0 | $0 | $0 |
| Subtotal Cash Spent | $230,703 | $260,320 | $342,946 |
| Net Cash Flow | $16,485 | $20,462 | $78,227 |
| Cash Balance | $28,885 | $49,347 | $127,574 |
8.5 Projected Balance Sheet
The following table illustrates Falls River Theatre’s Projected Balance Sheet.
| Pro Forma Balance Sheet | |||
| Year 1 | Year 2 | Year 3 | |
| Assets | |||
| Current Assets | |||
| Cash | $28,885 | $49,347 | $127,574 |
| Inventory | $21,681 | $32,521 | $48,782 |
| Other Current Assets | $0 | $0 | $0 |
| Total Current Assets | $50,565 | $81,868 | $176,356 |
| Long-term Assets | |||
| Long-term Assets | $10,000 | $10,000 | $10,000 |
| Accumulated Depreciation | $1,992 | $1,992 | $1,992 |
| Total Long-term Assets | $8,008 | $8,008 | $8,008 |
| Total Assets | $58,573 | $89,876 | $184,364 |
| Liabilities and Capital | Year 1 | Year 2 | Year 3 |
| Current Liabilities | |||
| Accounts Payable | $25,654 | $13,666 | $21,772 |
| Current Borrowing | $0 | $0 | $0 |
| Other Current Liabilities | $0 | $0 | $0 |
| Subtotal Current Liabilities | $25,654 | $13,666 | $21,772 |
| Long-term Liabilities | $0 | $0 | $0 |
| Total Liabilities | $25,654 | $13,666 | $21,772 |
| Paid-in Capital | $105,000 | $105,000 | $105,000 |
| Retained Earnings | ($21,900) | ($72,081) | ($28,790) |
| Earnings | ($50,181) | $43,290 | $86,382 |
| Total Capital | $32,919 | $76,210 | $162,592 |
| Total Liabilities and Capital | $58,573 | $89,876 | $184,364 |
| Net Worth | $32,919 | $76,210 | $162,592 |
8.6 Business Ratios
Business ratios for the years of this plan are shown below. Industry profile ratios are based on the Standard Industrial Classification (SIC) code 7832, [motion picture theatres, except drive-ins].
| Ratio Analysis | ||||
| Year 1 | Year 2 | Year 3 | Industry Profile | |
| Sales Growth | 0.00% | 50.00% | 50.00% | 4.18% |
| Percent of Total Assets | ||||
| Inventory | 37.01% | 36.18% | 26.46% | 0.54% |
| Other Current Assets | 0.00% | 0.00% | 0.00% | 27.25% |
| Total Current Assets | 86.33% | 91.09% | 95.66% | 32.96% |
| Long-term Assets | 13.67% | 8.91% | 4.34% | 67.04% |
| Total Assets | 100.00% | 100.00% | 100.00% | 100.00% |
| Current Liabilities | 43.80% | 15.21% | 11.81% | 23.77% |
| Long-term Liabilities | 0.00% | 0.00% | 0.00% | 30.06% |
| Total Liabilities | 43.80% | 15.21% | 11.81% | 53.83% |
| Net Worth | 56.20% | 84.79% | 88.19% | 46.17% |
| Percent of Sales | ||||
| Sales | 100.00% | 100.00% | 100.00% | 100.00% |
| Gross Margin | 51.25% | 51.25% | 51.25% | 100.00% |
| Selling, General & Administrative Expenses | 76.99% | 0.00% | 40.59% | 76.64% |
| Advertising Expenses | 0.00% | 0.00% | 0.00% | 3.12% |
| Profit Before Interest and Taxes | -26.81% | 22.03% | 29.30% | 2.78% |
| Main Ratios | ||||
| Current | 1.97 | 5.99 | 8.10 | 0.93 |
| Quick | 1.13 | 3.61 | 5.86 | 0.63 |
| Total Debt to Total Assets | 43.80% | 15.21% | 11.81% | 2.70% |
| Pre-tax Return on Net Worth | -152.43% | 81.15% | 75.90% | 61.15% |
| Pre-tax Return on Assets | -85.67% | 68.81% | 66.93% | 6.94% |
| Additional Ratios | Year 1 | Year 2 | Year 3 | |
| Net Profit Margin | -26.81% | 15.42% | 20.51% | n.a |
| Return on Equity | -152.43% | 56.80% | 53.13% | n.a |
| Activity Ratios | ||||
| Inventory Turnover | 10.40 | 5.05 | 5.05 | n.a |
| Accounts Payable Turnover | 6.95 | 12.17 | 12.17 | n.a |
| Payment Days | 27 | 43 | 24 | n.a |
| Total Asset Turnover | 3.20 | 3.12 | 2.28 | n.a |
| Debt Ratios | ||||
| Debt to Net Worth | 0.78 | 0.18 | 0.13 | n.a |
| Current Liab. to Liab. | 1.00 | 1.00 | 1.00 | n.a |
| Liquidity Ratios | ||||
| Net Working Capital | $24,911 | $68,202 | $154,584 | n.a |
| Interest Coverage | 0.00 | 0.00 | 0.00 | n.a |
| Additional Ratios | ||||
| Assets to Sales | 0.31 | 0.32 | 0.44 | n.a |
| Current Debt/Total Assets | 44% | 15% | 12% | n.a |
| Acid Test | 1.13 | 3.61 | 5.86 | n.a |
| Sales/Net Worth | 5.69 | 3.68 | 2.59 | n.a |
| Dividend Payout | 0.00 | 0.00 | 0.00 | n.a |
Appendix
| Sales Forecast | |||||||||||||
| Month 1 | Month 2 | Month 3 | Month 4 | Month 5 | Month 6 | Month 7 | Month 8 | Month 9 | Month 10 | Month 11 | Month 12 | ||
| Sales | |||||||||||||
| Family movies | 0% | $0 | $0 | $0 | $0 | $0 | $0 | $0 | $16,000 | $16,640 | $17,306 | $17,998 | $18,718 |
| Young adult movies | 0% | $0 | $0 | $0 | $0 | $0 | $0 | $0 | $5,600 | $5,824 | $6,057 | $6,299 | $6,551 |
| Concessions | 0% | $0 | $0 | $0 | $0 | $0 | $0 | $0 | $12,960 | $13,478 | $14,018 | $14,578 | $15,161 |
| Total Sales | $0 | $0 | $0 | $0 | $0 | $0 | $0 | $34,560 | $35,942 | $37,380 | $38,875 | $40,430 | |
| Direct Cost of Sales | Month 1 | Month 2 | Month 3 | Month 4 | Month 5 | Month 6 | Month 7 | Month 8 | Month 9 | Month 10 | Month 11 | Month 12 | |
| Movies | $0 | $0 | $0 | $0 | $0 | $0 | $0 | $12,960 | $13,478 | $14,018 | $14,578 | $15,161 | |
| Concessions | $0 | $0 | $0 | $0 | $0 | $0 | $0 | $3,888 | $4,044 | $4,205 | $4,373 | $4,548 | |
| Subtotal Direct Cost of Sales | $0 | $0 | $0 | $0 | $0 | $0 | $0 | $16,848 | $17,522 | $18,223 | $18,952 | $19,710 | |
| Personnel Plan | |||||||||||||
| Month 1 | Month 2 | Month 3 | Month 4 | Month 5 | Month 6 | Month 7 | Month 8 | Month 9 | Month 10 | Month 11 | Month 12 | ||
| Samantha Farmer | 0% | $1,600 | $1,600 | $1,600 | $3,200 | $3,200 | $3,200 | $3,200 | $3,200 | $3,200 | $3,200 | $3,200 | $3,200 |
| Steve Brinksman | 0% | $3,200 | $3,200 | $3,200 | $3,200 | $3,200 | $3,200 | $3,200 | $3,200 | $2,400 | $2,400 | $2,400 | $2,400 |
| Customer Service (4 part-time employees) | 0% | $0 | $0 | $0 | $0 | $0 | $0 | $850 | $1,700 | $1,700 | $1,700 | $1,700 | $1,700 |
| Other | 0% | $0 | $0 | $0 | $0 | $0 | $0 | $0 | $0 | $0 | $0 | $0 | $0 |
| Total People | 2 | 2 | 2 | 2 | 2 | 2 | 4 | 6 | 6 | 6 | 6 | 6 | |
| Total Payroll | $4,800 | $4,800 | $4,800 | $6,400 | $6,400 | $6,400 | $7,250 | $8,100 | $7,300 | $7,300 | $7,300 | $7,300 | |
| General Assumptions | |||||||||||||
| Month 1 | Month 2 | Month 3 | Month 4 | Month 5 | Month 6 | Month 7 | Month 8 | Month 9 | Month 10 | Month 11 | Month 12 | ||
| Plan Month | 1 | 2 | 3 | 4 | 5 | 6 | 7 | 8 | 9 | 10 | 11 | 12 | |
| Current Interest Rate | 10.00% | 10.00% | 10.00% | 10.00% | 10.00% | 10.00% | 10.00% | 10.00% | 10.00% | 10.00% | 10.00% | 10.00% | |
| Long-term Interest Rate | 10.00% | 10.00% | 10.00% | 10.00% | 10.00% | 10.00% | 10.00% | 10.00% | 10.00% | 10.00% | 10.00% | 10.00% | |
| Tax Rate | 30.00% | 30.00% | 30.00% | 30.00% | 30.00% | 30.00% | 30.00% | 30.00% | 30.00% | 30.00% | 30.00% | 30.00% | |
| Other | 0 | 0 | 0 | 0 | 0 | 0 | 0 | 0 | 0 | 0 | 0 | 0 | |
| Pro Forma Profit and Loss | |||||||||||||
| Month 1 | Month 2 | Month 3 | Month 4 | Month 5 | Month 6 | Month 7 | Month 8 | Month 9 | Month 10 | Month 11 | Month 12 | ||
| Sales | $0 | $0 | $0 | $0 | $0 | $0 | $0 | $34,560 | $35,942 | $37,380 | $38,875 | $40,430 | |
| Direct Cost of Sales | $0 | $0 | $0 | $0 | $0 | $0 | $0 | $16,848 | $17,522 | $18,223 | $18,952 | $19,710 | |
| Other Costs of Sales | $0 | $0 | $0 | $0 | $0 | $0 | $0 | $0 | $0 | $0 | $0 | $0 | |
| Total Cost of Sales | $0 | $0 | $0 | $0 | $0 | $0 | $0 | $16,848 | $17,522 | $18,223 | $18,952 | $19,710 | |
| Gross Margin | $0 | $0 | $0 | $0 | $0 | $0 | $0 | $17,712 | $18,420 | $19,157 | $19,924 | $20,721 | |
| Gross Margin % | 0.00% | 0.00% | 0.00% | 0.00% | 0.00% | 0.00% | 0.00% | 51.25% | 51.25% | 51.25% | 51.25% | 51.25% | |
| Expenses | |||||||||||||
| Payroll | $4,800 | $4,800 | $4,800 | $6,400 | $6,400 | $6,400 | $7,250 | $8,100 | $7,300 | $7,300 | $7,300 | $7,300 | |
| Sales and Marketing and Other Expenses | $0 | $0 | $0 | $0 | $0 | $0 | $600 | $1,100 | $400 | $400 | $400 | $400 | |
| Depreciation | $166 | $166 | $166 | $166 | $166 | $166 | $166 | $166 | $166 | $166 | $166 | $166 | |
| Rent | $900 | $900 | $900 | $900 | $900 | $900 | $900 | $900 | $900 | $900 | $900 | $900 | |
| Utilities | $2,500 | $2,500 | $2,500 | $2,500 | $2,500 | $2,500 | $2,500 | $2,500 | $2,500 | $2,500 | $2,500 | $2,500 | |
| Insurance | $700 | $700 | $700 | $700 | $700 | $700 | $700 | $850 | $1,100 | $1,100 | $1,100 | $1,100 | |
| Payroll Taxes | 15% | $720 | $720 | $720 | $960 | $960 | $960 | $1,088 | $1,215 | $1,095 | $1,095 | $1,095 | $1,095 |
| Other | $0 | $0 | $0 | $0 | $0 | $0 | $0 | $0 | $0 | $0 | $0 | $0 | |
| Total Operating Expenses | $9,786 | $9,786 | $9,786 | $11,626 | $11,626 | $11,626 | $13,204 | $14,831 | $13,461 | $13,461 | $13,461 | $13,461 | |
| Profit Before Interest and Taxes | ($9,786) | ($9,786) | ($9,786) | ($11,626) | ($11,626) | ($11,626) | ($13,204) | $2,881 | $4,959 | $5,696 | $6,463 | $7,260 | |
| EBITDA | ($9,620) | ($9,620) | ($9,620) | ($11,460) | ($11,460) | ($11,460) | ($13,038) | $3,047 | $5,125 | $5,862 | $6,629 | $7,426 | |
| Interest Expense | $0 | $0 | $0 | $0 | $0 | $0 | $0 | $0 | $0 | $0 | $0 | $0 | |
| Taxes Incurred | $0 | $0 | $0 | $0 | $0 | $0 | $0 | $0 | $0 | $0 | $0 | $0 | |
| Net Profit | ($9,786) | ($9,786) | ($9,786) | ($11,626) | ($11,626) | ($11,626) | ($13,204) | $2,881 | $4,959 | $5,696 | $6,463 | $7,260 | |
| Net Profit/Sales | 0.00% | 0.00% | 0.00% | 0.00% | 0.00% | 0.00% | 0.00% | 8.34% | 13.80% | 15.24% | 16.62% | 17.96% | |
| Pro Forma Cash Flow | |||||||||||||
| Month 1 | Month 2 | Month 3 | Month 4 | Month 5 | Month 6 | Month 7 | Month 8 | Month 9 | Month 10 | Month 11 | Month 12 | ||
| Cash Received | |||||||||||||
| Cash from Operations | |||||||||||||
| Cash Sales | $0 | $0 | $0 | $0 | $0 | $0 | $0 | $34,560 | $35,942 | $37,380 | $38,875 | $40,430 | |
| Subtotal Cash from Operations | $0 | $0 | $0 | $0 | $0 | $0 | $0 | $34,560 | $35,942 | $37,380 | $38,875 | $40,430 | |
| Additional Cash Received | |||||||||||||
| Sales Tax, VAT, HST/GST Received | 0.00% | $0 | $0 | $0 | $0 | $0 | $0 | $0 | $0 | $0 | $0 | $0 | $0 |
| New Current Borrowing | $0 | $0 | $0 | $0 | $0 | $0 | $0 | $0 | $0 | $0 | $0 | $0 | |
| New Other Liabilities (interest-free) | $0 | $0 | $0 | $0 | $0 | $0 | $0 | $0 | $0 | $0 | $0 | $0 | |
| New Long-term Liabilities | $0 | $0 | $0 | $0 | $0 | $0 | $0 | $0 | $0 | $0 | $0 | $0 | |
| Sales of Other Current Assets | $0 | $0 | $0 | $0 | $0 | $0 | $0 | $0 | $0 | $0 | $0 | $0 | |
| Sales of Long-term Assets | $0 | $0 | $0 | $0 | $0 | $0 | $0 | $0 | $0 | $0 | $0 | $0 | |
| New Investment Received | $60,000 | $0 | $0 | $0 | $0 | $0 | $0 | $0 | $0 | $0 | $0 | $0 | |
| Subtotal Cash Received | $60,000 | $0 | $0 | $0 | $0 | $0 | $0 | $34,560 | $35,942 | $37,380 | $38,875 | $40,430 | |
| Expenditures | Month 1 | Month 2 | Month 3 | Month 4 | Month 5 | Month 6 | Month 7 | Month 8 | Month 9 | Month 10 | Month 11 | Month 12 | |
| Expenditures from Operations | |||||||||||||
| Cash Spending | $4,800 | $4,800 | $4,800 | $6,400 | $6,400 | $6,400 | $7,250 | $8,100 | $7,300 | $7,300 | $7,300 | $7,300 | |
| Bill Payments | $161 | $4,820 | $4,820 | $4,828 | $5,060 | $5,060 | $5,084 | $6,969 | $40,680 | $24,283 | $25,014 | $25,775 | |
| Subtotal Spent on Operations | $4,961 | $9,620 | $9,620 | $11,228 | $11,460 | $11,460 | $12,334 | $15,069 | $47,980 | $31,583 | $32,314 | $33,075 | |
| Additional Cash Spent | |||||||||||||
| Sales Tax, VAT, HST/GST Paid Out | $0 | $0 | $0 | $0 | $0 | $0 | $0 | $0 | $0 | $0 | $0 | $0 | |
| Principal Repayment of Current Borrowing | $0 | $0 | $0 | $0 | $0 | $0 | $0 | $0 | $0 | $0 | $0 | $0 | |
| Other Liabilities Principal Repayment | $0 | $0 | $0 | $0 | $0 | $0 | $0 | $0 | $0 | $0 | $0 | $0 | |
| Long-term Liabilities Principal Repayment | $0 | $0 | $0 | $0 | $0 | $0 | $0 | $0 | $0 | $0 | $0 | $0 | |
| Purchase Other Current Assets | $0 | $0 | $0 | $0 | $0 | $0 | $0 | $0 | $0 | $0 | $0 | $0 | |
| Purchase Long-term Assets | $0 | $0 | $0 | $0 | $0 | $0 | $0 | $0 | $0 | $0 | $0 | $0 | |
| Dividends | $0 | $0 | $0 | $0 | $0 | $0 | $0 | $0 | $0 | $0 | $0 | $0 | |
| Subtotal Cash Spent | $4,961 | $9,620 | $9,620 | $11,228 | $11,460 | $11,460 | $12,334 | $15,069 | $47,980 | $31,583 | $32,314 | $33,075 | |
| Net Cash Flow | $55,039 | ($9,620) | ($9,620) | ($11,228) | ($11,460) | ($11,460) | ($12,334) | $19,491 | ($12,037) | $5,798 | $6,561 | $7,355 | |
| Cash Balance | $67,439 | $57,819 | $48,199 | $36,971 | $25,511 | $14,051 | $1,717 | $21,208 | $9,170 | $14,968 | $21,529 | $28,885 | |
| Pro Forma Balance Sheet | |||||||||||||
| Month 1 | Month 2 | Month 3 | Month 4 | Month 5 | Month 6 | Month 7 | Month 8 | Month 9 | Month 10 | Month 11 | Month 12 | ||
| Assets | Starting Balances | ||||||||||||
| Current Assets | |||||||||||||
| Cash | $12,400 | $67,439 | $57,819 | $48,199 | $36,971 | $25,511 | $14,051 | $1,717 | $21,208 | $9,170 | $14,968 | $21,529 | $28,885 |
| Inventory | $700 | $700 | $700 | $700 | $700 | $700 | $700 | $700 | $18,533 | $19,274 | $20,045 | $20,847 | $21,681 |
| Other Current Assets | $0 | $0 | $0 | $0 | $0 | $0 | $0 | $0 | $0 | $0 | $0 | $0 | $0 |
| Total Current Assets | $13,100 | $68,139 | $58,519 | $48,899 | $37,671 | $26,211 | $14,751 | $2,417 | $39,740 | $28,445 | $35,013 | $42,376 | $50,565 |
| Long-term Assets | |||||||||||||
| Long-term Assets | $10,000 | $10,000 | $10,000 | $10,000 | $10,000 | $10,000 | $10,000 | $10,000 | $10,000 | $10,000 | $10,000 | $10,000 | $10,000 |
| Accumulated Depreciation | $0 | $166 | $332 | $498 | $664 | $830 | $996 | $1,162 | $1,328 | $1,494 | $1,660 | $1,826 | $1,992 |
| Total Long-term Assets | $10,000 | $9,834 | $9,668 | $9,502 | $9,336 | $9,170 | $9,004 | $8,838 | $8,672 | $8,506 | $8,340 | $8,174 | $8,008 |
| Total Assets | $23,100 | $77,973 | $68,187 | $58,401 | $47,007 | $35,381 | $23,755 | $11,255 | $48,412 | $36,951 | $43,353 | $50,550 | $58,573 |
| Liabilities and Capital | Month 1 | Month 2 | Month 3 | Month 4 | Month 5 | Month 6 | Month 7 | Month 8 | Month 9 | Month 10 | Month 11 | Month 12 | |
| Current Liabilities | |||||||||||||
| Accounts Payable | $0 | $4,659 | $4,659 | $4,659 | $4,891 | $4,891 | $4,891 | $5,595 | $39,871 | $23,450 | $24,156 | $24,890 | $25,654 |
| Current Borrowing | $0 | $0 | $0 | $0 | $0 | $0 | $0 | $0 | $0 | $0 | $0 | $0 | $0 |
| Other Current Liabilities | $0 | $0 | $0 | $0 | $0 | $0 | $0 | $0 | $0 | $0 | $0 | $0 | $0 |
| Subtotal Current Liabilities | $0 | $4,659 | $4,659 | $4,659 | $4,891 | $4,891 | $4,891 | $5,595 | $39,871 | $23,450 | $24,156 | $24,890 | $25,654 |
| Long-term Liabilities | $0 | $0 | $0 | $0 | $0 | $0 | $0 | $0 | $0 | $0 | $0 | $0 | $0 |
| Total Liabilities | $0 | $4,659 | $4,659 | $4,659 | $4,891 | $4,891 | $4,891 | $5,595 | $39,871 | $23,450 | $24,156 | $24,890 | $25,654 |
| Paid-in Capital | $45,000 | $105,000 | $105,000 | $105,000 | $105,000 | $105,000 | $105,000 | $105,000 | $105,000 | $105,000 | $105,000 | $105,000 | $105,000 |
| Retained Earnings | ($21,900) | ($21,900) | ($21,900) | ($21,900) | ($21,900) | ($21,900) | ($21,900) | ($21,900) | ($21,900) | ($21,900) | ($21,900) | ($21,900) | ($21,900) |
| Earnings | $0 | ($9,786) | ($19,572) | ($29,358) | ($40,984) | ($52,610) | ($64,236) | ($77,440) | ($74,559) | ($69,599) | ($63,903) | ($57,440) | ($50,181) |
| Total Capital | $23,100 | $73,314 | $63,528 | $53,742 | $42,116 | $30,490 | $18,864 | $5,661 | $8,542 | $13,501 | $19,197 | $25,660 | $32,919 |
| Total Liabilities and Capital | $23,100 | $77,973 | $68,187 | $58,401 | $47,007 | $35,381 | $23,755 | $11,255 | $48,412 | $36,951 | $43,353 | $50,550 | $58,573 |
| Net Worth | $23,100 | $73,314 | $63,528 | $53,742 | $42,116 | $30,490 | $18,864 | $5,660 | $8,542 | $13,501 | $19,197 | $25,660 | $32,919 |


