
Second Run Pizza
Executive Summary
The number of movie theaters is decreasing as the major chains create megaplexes that pile more people into smaller spaces. This profit strategy has left once popular downtown theaters vacant. Second Run Pizza is a theater/restaurant business that believes there is a significant number of theater-goers that are craving a more satisfying and enjoyable way to catch a movie and a bit to eat. Second Run Pizza is renovating the downtown Majestic Theater and creating a medium-size restaurant that will show second-run movies that have proven to still be popular to our target market. We will offer a totally unique dining and movie experience at a affordable price that will fill the theater space with repeat customers.
The owners of Second Run Pizza, Robert Williamson and Judy Fillmore, stress two factors that they believe assures the success of the business:
- Judy’s 15 years experience as a manager of four of the city’s most successful restaurants and Robert’s experience as manager of the Lighthouse Theater, a small art house theater which has recently returned to profitability under Robert’s stewardship.
- Robert’s strong seven year working relationship with Premiere Film Distributors which will provide the second run films for Second Run Pizza.
Our market and financial analyses indicate that with a start-up expenditure of $300,000 we can generate $600,000 in sales by the end of year one, and produce high net profits by the end of year three.

1.1 Objectives
-
Sales over $600K the first year, more than a million by the third.
-
Personnel costs less than $300K the first year.
-
Profitable in first year, with net profits increasing each year.
1.2 Mission
Second Run’s mission is to create a new theater experience for our customers that will be so enjoyable and satisfying that they will return often and recommend Second Run to their friends and family. Our customers will be delighted with our level of service, the quality of the food, and a theater environment that is second to none. When the film ends and the applause die out, we believe that our customers will prefer to watch a new movie at Second Run rather than to ever be squeezed into a Megaplex again.
1.3 Keys to Success
- Selection of popular films that work best in the group viewing environment; i.e. comedies, scary or adventure films.
- Provide exceptional service that leaves an impression.
- Consistent entertainment atmosphere and product quality.
- Managing our internal finances and cash flow to enable upward capital growth.
- Strict control of all costs, at all times, without exception.
Company Summary
Second Run Pizza is a single-unit, medium-sized restaurant. We focus on pizza and a few creative Italian dishes. The restaurant will be located downtown near the major shopping centers and evening entertainment establishments.
2.1 Start-up Summary
The founders of the company are Robert Williamson and Judy Fillmore. Judy focuses on the financial issues and Robert on the personnel issues. Judy earned her business major undergraduate degree from the University of Berkeley. A lease for the location has been secured for $2,000 per month. The theater will have to be equipped as a restaurant. It will be able to set up shop in time to begin turning a profit by the end of month eleven and be profitable in the second year. Both Robert and Judy are investing $150,000 each to start up the company.

| Start-up Funding | |
| Start-up Expenses to Fund | $140,800 |
| Start-up Assets to Fund | $159,200 |
| Total Funding Required | $300,000 |
| Assets | |
| Non-cash Assets from Start-up | $10,000 |
| Cash Requirements from Start-up | $149,200 |
| Additional Cash Raised | $0 |
| Cash Balance on Starting Date | $149,200 |
| Total Assets | $159,200 |
| Liabilities and Capital | |
| Liabilities | |
| Current Borrowing | $0 |
| Long-term Liabilities | $0 |
| Accounts Payable (Outstanding Bills) | $0 |
| Other Current Liabilities (interest-free) | $0 |
| Total Liabilities | $0 |
| Capital | |
| Planned Investment | |
| Investor 1 | $150,000 |
| Investor 2 | $150,000 |
| Other | $0 |
| Additional Investment Requirement | $0 |
| Total Planned Investment | $300,000 |
| Loss at Start-up (Start-up Expenses) | ($140,800) |
| Total Capital | $159,200 |
| Total Capital and Liabilities | $159,200 |
| Total Funding | $300,000 |
| Start-up | |
| Requirements | |
| Start-up Expenses | |
| Legal | $1,000 |
| Stationery etc. | $1,000 |
| Insurance | $1,800 |
| Rent | $2,000 |
| Projection Equipment | $40,000 |
| Kitchen | $40,000 |
| Initial Marketing | $15,000 |
| Dining Products | $5,000 |
| Interior Refit | $35,000 |
| Total Start-up Expenses | $140,800 |
| Start-up Assets | |
| Cash Required | $149,200 |
| Other Current Assets | $10,000 |
| Long-term Assets | $0 |
| Total Assets | $159,200 |
| Total Requirements | $300,000 |
2.2 Company Ownership
The restaurant will start out as a simple sole proprietorship, owned by its founders.
Services
The Menu:
The menu is extremely simple. Pizza is the perfect finger food for watching a movie. We will also include select Italian dishes that fit will in the viewing environment.
Movies:
The films will be chosen with two target audiences in mind. The first is the families that will come to Second Run Pizza to watch movies like Shrek and Spy Kids. These movies will be shown three times during the afternoon. The second group is young adults who will come to the evening shows to watch movies like Jeepers Peepers, the Fast and the Furious, and Rush Hour 2. There will be three evening showings of these films. In addition, there will be midnight movies for the college crowd on Friday and Saturday.
Market Analysis Summary
We believe that our unique dining environment will attract our target customers. The central location of Second Run Pizza to the downtown shopping and entertainment center makes the restaurant easily accessible. Once inside, the customer will find watching a movie at comfortable table seating, while enjoying great food, is a experience to repeat again and again with friends.
4.1 Market Segmentation
Families:
We are focusing on parents with children who want to catch a movie with a pizza in the afternoon or early evening, before or after shopping at the downtown mall.
Young Adults:
The second group we are going to focus on is young adults ages 18 – 26 for the evening shows. We believe that this target group will enjoy this unique way to watch a film and Second Run Pizza will become a common place for friends to have an affordable evening’s entertainment together.

| Market Analysis | |||||||
| Year 1 | Year 2 | Year 3 | Year 4 | Year 5 | |||
| Potential Customers | Growth | CAGR | |||||
| Families | 15% | 400,000 | 460,000 | 529,000 | 608,350 | 699,603 | 15.00% |
| Young Adults | 10% | 200,000 | 220,000 | 242,000 | 266,200 | 292,820 | 10.00% |
| Other | 0% | 0 | 0 | 0 | 0 | 0 | 0.00% |
| Total | 13.41% | 600,000 | 680,000 | 771,000 | 874,550 | 992,423 | 13.41% |
Strategy and Implementation Summary
Our strategy is simple, we intend to succeed by giving our target customers a combination of great food and a relaxed enjoyable environment that creates a memorable experience.
5.1 Competitive Edge
Our competitive edge is two fold:
- The experience of Robert and Judy in managing Second Run Pizza.
- The agreement with Premiere Film Distributors which have agreed to supply Second Run Pizza with second run movies.
Co-owner Judy Fillmore has been a fixture of the city’s restaurant scene for the past 15 years. She managed four successful restaurants and has received industry accolades for her operational excellence. She is now a highly sought consultant on improving restaurant operating efficiency and work flow. Her client list include the city’s best restaurants.
Robert Williamson has 20 years of experience in the movie theater industry. Robert was the manager of the city’s largest multiplex for seven years before taking a position with Premiere Film Distributors where he served as a regional distribution coordinator for six years. When Robert took over the challenge of managing the Lighthouse Theater, the business was failing and losing significant market share to the larger chain theaters. Under his management, the theater regained its vitality as an Indie film center. Usage levels increase by 200% over a two-year period and the theater soon became a key feature in the city’s cultural community. The combination of Judy and Robert’s experience will ensure that Second Run will be a unique competitive force in both the theater and restaurant industries.

The owners have negotiated an agreement with Premiere Film Distributors that will assure that the Second Run will have best available second run films. Premiere Film Distributors will provide the films and will receive 75% of the admission revenue. This is a better return for the distributor who normally receive only 50% of admission revenue for second run films. In exchange, Second Run will get the films most popular with their target customers.
5.2 Sales Strategy
Our initial sales strategy is to flood our target consumers with free movie coupons for the first three months of operation. The $1.50 charge for the film will be waived with the coupon. These coupons will be in the city’s daily paper as well as the student papers of Claremont University and Jefferson College.
The film charge is really incidental. Second Run’s profits will come from food sales. Menu pricing will reflect this focus. Our prices will be higher than a traditional Pizza restaurant but we believe the unique dining environment will justify those prices with our customers.
On the traditional slow days (Monday and Tuesday) we will offer cheaper fare (spaghetti) and market these days to college students as spaghetti movie night. In addition, we will have two for one date nights, where couples will only be charged for one admission.
Sales projections for this plan are presented in the following topics.
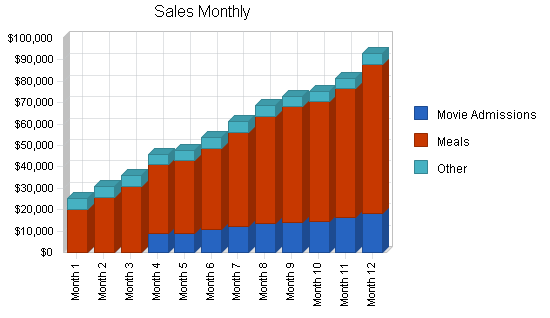
5.2.1 Sales Forecast
This chart represents our forecast for income on a monthly basis. The table presents yearly expected sales. Complete monthly forecast figures for the first year are presented in the appendix.

| Sales Forecast | |||
| Year 1 | Year 2 | Year 3 | |
| Unit Sales | |||
| Movie Admissions | 78,400 | 90,000 | 100,000 |
| Meals | 25,725 | 33,000 | 40,000 |
| Other | 12,000 | 13,000 | 14,000 |
| Total Unit Sales | 116,125 | 136,000 | 154,000 |
| Unit Prices | Year 1 | Year 2 | Year 3 |
| Movie Admissions | $1.50 | $1.50 | $2.00 |
| Meals | $20.00 | $20.00 | $22.00 |
| Other | $5.00 | $5.00 | $5.00 |
| Sales | |||
| Movie Admissions | $117,600 | $135,000 | $200,000 |
| Meals | $514,500 | $660,000 | $880,000 |
| Other | $60,000 | $65,000 | $70,000 |
| Total Sales | $692,100 | $860,000 | $1,150,000 |
| Direct Unit Costs | Year 1 | Year 2 | Year 3 |
| Movie Admissions | $1.20 | $1.20 | $1.60 |
| Meals | $3.00 | $3.00 | $3.00 |
| Other | $0.50 | $0.50 | $0.50 |
| Direct Cost of Sales | |||
| Movie Admissions | $94,080 | $108,000 | $160,000 |
| Meals | $77,175 | $99,000 | $120,000 |
| Other | $6,000 | $6,500 | $7,000 |
| Subtotal Direct Cost of Sales | $177,255 | $213,500 | $287,000 |
5.3 Milestones
The following table lists important program milestones, with dates and budgets for each. The milestones schedule indicates our emphasis on planning for implementation.
| Milestones | |||||
| Milestone | Start Date | End Date | Budget | Manager | Department |
| Tables and Chairs | 11/4/2001 | 11/13/2001 | $3,000 | ABC | Marketing |
| Decorations | 11/4/2001 | 11/18/2001 | $2,000 | ABC | Marketing |
| Painting/reconstuction of Resturant | 11/1/2001 | 12/22/2001 | $25,000 | ABC | Web |
| Food for Opening | 12/28/2001 | 12/29/2001 | $1,000 | ABC | Web |
| Production of Menus | 11/13/2001 | 12/16/2001 | $400 | ABC | Department |
| Buying Supplies for Kitchen | 11/16/2001 | 12/20/2001 | $5,000 | ABC | Department |
| Set Up Projection Equipment | 12/20/2001 | 12/28/2001 | $40,000 | ABC | Department |
| Establish Film Schedule | 11/1/2001 | 12/28/2001 | $1,000 | ABC | Department |
| Staff Hiring | 12/4/2001 | 12/22/2001 | $0 | ABC | Department |
| Staff Schedules | 12/25/2001 | 12/28/2001 | $0 | ABC | Department |
| Distribution of Advertising | 12/5/2001 | 1/1/2001 | $0 | ABC | Department |
| Totals | $77,400 | ||||
Management Summary
Judy will be responsible for hiring, training and supervision of all restaurant staff. As we stated previously, Judy is the best in her field and will have no trouble in assembling a team that will be eager to participate in the success of Second Run.
Robert’s management focus will be marketing and responsibilities related to the presentation of the film. It is widely acknowledged that Robert’s marketing of the Lighthouse Theater pulled it out of the red and into its current profitability.
6.1 Personnel Plan
As the personnel plan shows, we expect to invest in a good team, fairly compensated. We think the planned staff is in good proportion to the size of the restaurant and projected revenues.
| Personnel Plan | |||
| Year 1 | Year 2 | Year 3 | |
| Manager | $48,000 | $53,000 | $58,000 |
| Hostess | $36,000 | $40,000 | $44,000 |
| Kitchen Staff | $60,000 | $64,000 | $68,000 |
| Cleaning | $36,000 | $38,000 | $40,000 |
| Servers | $72,000 | $72,000 | $72,000 |
| Projectionist | $36,000 | $40,000 | $44,000 |
| Total People | 12 | 15 | 18 |
| Total Payroll | $288,000 | $307,000 | $326,000 |
Financial Plan
We will invest $300,000 of our own capital. This will provide the start-up financing required.
7.1 Break-even Analysis
Our break-even analysis is based on the average of the first-year numbers for total sales by meal served, total cost of sales, and all operating expenses. These are presented as per-unit revenue, per-unit cost, and fixed costs. We realize that this is not the same as fixed cost, but these conservative assumptions make for a better estimate of real risk.

| Break-even Analysis | |
| Monthly Units Break-even | 7,778 |
| Monthly Revenue Break-even | $46,356 |
| Assumptions: | |
| Average Per-Unit Revenue | $5.96 |
| Average Per-Unit Variable Cost | $1.53 |
| Estimated Monthly Fixed Cost | $34,483 |
7.2 Projected Profit and Loss
The following table and chart shows projected profit and loss.


| Pro Forma Profit and Loss | |||
| Year 1 | Year 2 | Year 3 | |
| Sales | $692,100 | $860,000 | $1,150,000 |
| Direct Cost of Sales | $177,255 | $213,500 | $287,000 |
| Movie Screening Expenses | $77,861 | $96,750 | $129,375 |
| Total Cost of Sales | $255,116 | $310,250 | $416,375 |
| Gross Margin | $436,984 | $549,750 | $733,625 |
| Gross Margin % | 63.14% | 63.92% | 63.79% |
| Expenses | |||
| Payroll | $288,000 | $307,000 | $326,000 |
| Sales and Marketing and Other Expenses | $22,600 | $8,000 | $8,000 |
| Depreciation | $0 | $0 | $0 |
| Leased Equipment | $0 | $0 | $0 |
| Utilities | $14,400 | $14,400 | $14,400 |
| Insurance | $21,600 | $21,600 | $21,600 |
| Rent | $24,000 | $24,000 | $24,000 |
| Payroll Taxes | $43,200 | $46,050 | $48,900 |
| Other | $0 | $0 | $0 |
| Total Operating Expenses | $413,800 | $421,050 | $442,900 |
| Profit Before Interest and Taxes | $23,184 | $128,700 | $290,725 |
| EBITDA | $23,184 | $128,700 | $290,725 |
| Interest Expense | $0 | $0 | $0 |
| Taxes Incurred | $6,955 | $38,610 | $87,218 |
| Net Profit | $16,229 | $90,090 | $203,508 |
| Net Profit/Sales | 2.34% | 10.48% | 17.70% |
7.3 Projected Cash Flow
The table and chart shows projected cash flow for the year.

| Pro Forma Cash Flow | |||
| Year 1 | Year 2 | Year 3 | |
| Cash Received | |||
| Cash from Operations | |||
| Cash Sales | $692,100 | $860,000 | $1,150,000 |
| Subtotal Cash from Operations | $692,100 | $860,000 | $1,150,000 |
| Additional Cash Received | |||
| Sales Tax, VAT, HST/GST Received | $0 | $0 | $0 |
| New Current Borrowing | $0 | $0 | $0 |
| New Other Liabilities (interest-free) | $0 | $0 | $0 |
| New Long-term Liabilities | $0 | $0 | $0 |
| Sales of Other Current Assets | $0 | $0 | $0 |
| Sales of Long-term Assets | $0 | $0 | $0 |
| New Investment Received | $0 | $0 | $0 |
| Subtotal Cash Received | $692,100 | $860,000 | $1,150,000 |
| Expenditures | Year 1 | Year 2 | Year 3 |
| Expenditures from Operations | |||
| Cash Spending | $288,000 | $307,000 | $326,000 |
| Bill Payments | $337,234 | $475,500 | $607,541 |
| Subtotal Spent on Operations | $625,234 | $782,500 | $933,541 |
| Additional Cash Spent | |||
| Sales Tax, VAT, HST/GST Paid Out | $0 | $0 | $0 |
| Principal Repayment of Current Borrowing | $0 | $0 | $0 |
| Other Liabilities Principal Repayment | $0 | $0 | $0 |
| Long-term Liabilities Principal Repayment | $0 | $0 | $0 |
| Purchase Other Current Assets | $0 | $0 | $0 |
| Purchase Long-term Assets | $0 | $0 | $0 |
| Dividends | $0 | $0 | $0 |
| Subtotal Cash Spent | $625,234 | $782,500 | $933,541 |
| Net Cash Flow | $66,866 | $77,500 | $216,459 |
| Cash Balance | $216,066 | $293,566 | $510,026 |
7.4 Projected Balance Sheet
The table shows projected balance sheet for three years.
| Pro Forma Balance Sheet | |||
| Year 1 | Year 2 | Year 3 | |
| Assets | |||
| Current Assets | |||
| Cash | $216,066 | $293,566 | $510,026 |
| Other Current Assets | $10,000 | $10,000 | $10,000 |
| Total Current Assets | $226,066 | $303,566 | $520,026 |
| Long-term Assets | |||
| Long-term Assets | $0 | $0 | $0 |
| Accumulated Depreciation | $0 | $0 | $0 |
| Total Long-term Assets | $0 | $0 | $0 |
| Total Assets | $226,066 | $303,566 | $520,026 |
| Liabilities and Capital | Year 1 | Year 2 | Year 3 |
| Current Liabilities | |||
| Accounts Payable | $50,638 | $38,047 | $50,999 |
| Current Borrowing | $0 | $0 | $0 |
| Other Current Liabilities | $0 | $0 | $0 |
| Subtotal Current Liabilities | $50,638 | $38,047 | $50,999 |
| Long-term Liabilities | $0 | $0 | $0 |
| Total Liabilities | $50,638 | $38,047 | $50,999 |
| Paid-in Capital | $300,000 | $300,000 | $300,000 |
| Retained Earnings | ($140,800) | ($124,571) | ($34,481) |
| Earnings | $16,229 | $90,090 | $203,508 |
| Total Capital | $175,429 | $265,519 | $469,026 |
| Total Liabilities and Capital | $226,066 | $303,566 | $520,026 |
| Net Worth | $175,429 | $265,519 | $469,026 |
7.5 Business Ratios
Business ratios for the years of this plan are shown below. Industry Profile ratios based on the Standard Industrial Classification (SIC) code 5813, Eating Places, are shown for comparison.
| Ratio Analysis | ||||
| Year 1 | Year 2 | Year 3 | Industry Profile | |
| Sales Growth | 0.00% | 24.26% | 33.72% | 1.90% |
| Percent of Total Assets | ||||
| Other Current Assets | 4.42% | 3.29% | 1.92% | 44.60% |
| Total Current Assets | 100.00% | 100.00% | 100.00% | 52.30% |
| Long-term Assets | 0.00% | 0.00% | 0.00% | 47.70% |
| Total Assets | 100.00% | 100.00% | 100.00% | 100.00% |
| Current Liabilities | 22.40% | 12.53% | 9.81% | 28.20% |
| Long-term Liabilities | 0.00% | 0.00% | 0.00% | 23.10% |
| Total Liabilities | 22.40% | 12.53% | 9.81% | 51.30% |
| Net Worth | 77.60% | 87.47% | 90.19% | 48.70% |
| Percent of Sales | ||||
| Sales | 100.00% | 100.00% | 100.00% | 100.00% |
| Gross Margin | 63.14% | 63.92% | 63.79% | 42.30% |
| Selling, General & Administrative Expenses | 60.79% | 53.45% | 46.10% | 23.40% |
| Advertising Expenses | 3.27% | 0.93% | 0.70% | 2.40% |
| Profit Before Interest and Taxes | 3.35% | 14.97% | 25.28% | 2.80% |
| Main Ratios | ||||
| Current | 4.46 | 7.98 | 10.20 | 1.14 |
| Quick | 4.46 | 7.98 | 10.20 | 0.74 |
| Total Debt to Total Assets | 22.40% | 12.53% | 9.81% | 51.30% |
| Pre-tax Return on Net Worth | 13.22% | 48.47% | 61.98% | 5.20% |
| Pre-tax Return on Assets | 10.26% | 42.40% | 55.91% | 10.60% |
| Additional Ratios | Year 1 | Year 2 | Year 3 | |
| Net Profit Margin | 2.34% | 10.48% | 17.70% | n.a |
| Return on Equity | 9.25% | 33.93% | 43.39% | n.a |
| Activity Ratios | ||||
| Accounts Payable Turnover | 7.66 | 12.17 | 12.17 | n.a |
| Payment Days | 27 | 35 | 26 | n.a |
| Total Asset Turnover | 3.06 | 2.83 | 2.21 | n.a |
| Debt Ratios | ||||
| Debt to Net Worth | 0.29 | 0.14 | 0.11 | n.a |
| Current Liab. to Liab. | 1.00 | 1.00 | 1.00 | n.a |
| Liquidity Ratios | ||||
| Net Working Capital | $175,429 | $265,519 | $469,026 | n.a |
| Interest Coverage | 0.00 | 0.00 | 0.00 | n.a |
| Additional Ratios | ||||
| Assets to Sales | 0.33 | 0.35 | 0.45 | n.a |
| Current Debt/Total Assets | 22% | 13% | 10% | n.a |
| Acid Test | 4.46 | 7.98 | 10.20 | n.a |
| Sales/Net Worth | 3.95 | 3.24 | 2.45 | n.a |
| Dividend Payout | 0.00 | 0.00 | 0.00 | n.a |
Appendix
| Sales Forecast | |||||||||||||
| Month 1 | Month 2 | Month 3 | Month 4 | Month 5 | Month 6 | Month 7 | Month 8 | Month 9 | Month 10 | Month 11 | Month 12 | ||
| Unit Sales | |||||||||||||
| Movie Admissions | 0% | 0 | 0 | 0 | 6,000 | 6,000 | 7,200 | 8,200 | 9,000 | 9,400 | 9,600 | 11,000 | 12,000 |
| Meals | 0% | 1,000 | 1,290 | 1,545 | 1,600 | 1,690 | 1,900 | 2,200 | 2,500 | 2,700 | 2,800 | 3,000 | 3,500 |
| Other | 0% | 1,000 | 1,000 | 1,000 | 1,000 | 1,000 | 1,000 | 1,000 | 1,000 | 1,000 | 1,000 | 1,000 | 1,000 |
| Total Unit Sales | 2,000 | 2,290 | 2,545 | 8,600 | 8,690 | 10,100 | 11,400 | 12,500 | 13,100 | 13,400 | 15,000 | 16,500 | |
| Unit Prices | Month 1 | Month 2 | Month 3 | Month 4 | Month 5 | Month 6 | Month 7 | Month 8 | Month 9 | Month 10 | Month 11 | Month 12 | |
| Movie Admissions | $1.50 | $1.50 | $1.50 | $1.50 | $1.50 | $1.50 | $1.50 | $1.50 | $1.50 | $1.50 | $1.50 | $1.50 | |
| Meals | $20.00 | $20.00 | $20.00 | $20.00 | $20.00 | $20.00 | $20.00 | $20.00 | $20.00 | $20.00 | $20.00 | $20.00 | |
| Other | $5.00 | $5.00 | $5.00 | $5.00 | $5.00 | $5.00 | $5.00 | $5.00 | $5.00 | $5.00 | $5.00 | $5.00 | |
| Sales | |||||||||||||
| Movie Admissions | $0 | $0 | $0 | $9,000 | $9,000 | $10,800 | $12,300 | $13,500 | $14,100 | $14,400 | $16,500 | $18,000 | |
| Meals | $20,000 | $25,800 | $30,900 | $32,000 | $33,800 | $38,000 | $44,000 | $50,000 | $54,000 | $56,000 | $60,000 | $70,000 | |
| Other | $5,000 | $5,000 | $5,000 | $5,000 | $5,000 | $5,000 | $5,000 | $5,000 | $5,000 | $5,000 | $5,000 | $5,000 | |
| Total Sales | $25,000 | $30,800 | $35,900 | $46,000 | $47,800 | $53,800 | $61,300 | $68,500 | $73,100 | $75,400 | $81,500 | $93,000 | |
| Direct Unit Costs | Month 1 | Month 2 | Month 3 | Month 4 | Month 5 | Month 6 | Month 7 | Month 8 | Month 9 | Month 10 | Month 11 | Month 12 | |
| Movie Admissions | 0.00% | $1.20 | $1.20 | $1.20 | $1.20 | $1.20 | $1.20 | $1.20 | $1.20 | $1.20 | $1.20 | $1.20 | $1.20 |
| Meals | 0.00% | $3.00 | $3.00 | $3.00 | $3.00 | $3.00 | $3.00 | $3.00 | $3.00 | $3.00 | $3.00 | $3.00 | $3.00 |
| Other | 0.00% | $0.50 | $0.50 | $0.50 | $0.50 | $0.50 | $0.50 | $0.50 | $0.50 | $0.50 | $0.50 | $0.50 | $0.50 |
| Direct Cost of Sales | |||||||||||||
| Movie Admissions | $0 | $0 | $0 | $7,200 | $7,200 | $8,640 | $9,840 | $10,800 | $11,280 | $11,520 | $13,200 | $14,400 | |
| Meals | $3,000 | $3,870 | $4,635 | $4,800 | $5,070 | $5,700 | $6,600 | $7,500 | $8,100 | $8,400 | $9,000 | $10,500 | |
| Other | $500 | $500 | $500 | $500 | $500 | $500 | $500 | $500 | $500 | $500 | $500 | $500 | |
| Subtotal Direct Cost of Sales | $3,500 | $4,370 | $5,135 | $12,500 | $12,770 | $14,840 | $16,940 | $18,800 | $19,880 | $20,420 | $22,700 | $25,400 | |
| Personnel Plan | |||||||||||||
| Month 1 | Month 2 | Month 3 | Month 4 | Month 5 | Month 6 | Month 7 | Month 8 | Month 9 | Month 10 | Month 11 | Month 12 | ||
| Manager | 0% | $4,000 | $4,000 | $4,000 | $4,000 | $4,000 | $4,000 | $4,000 | $4,000 | $4,000 | $4,000 | $4,000 | $4,000 |
| Hostess | 0% | $3,000 | $3,000 | $3,000 | $3,000 | $3,000 | $3,000 | $3,000 | $3,000 | $3,000 | $3,000 | $3,000 | $3,000 |
| Kitchen Staff | 0% | $5,000 | $5,000 | $5,000 | $5,000 | $5,000 | $5,000 | $5,000 | $5,000 | $5,000 | $5,000 | $5,000 | $5,000 |
| Cleaning | 0% | $3,000 | $3,000 | $3,000 | $3,000 | $3,000 | $3,000 | $3,000 | $3,000 | $3,000 | $3,000 | $3,000 | $3,000 |
| Servers | 0% | $6,000 | $6,000 | $6,000 | $6,000 | $6,000 | $6,000 | $6,000 | $6,000 | $6,000 | $6,000 | $6,000 | $6,000 |
| Projectionist | 0% | $3,000 | $3,000 | $3,000 | $3,000 | $3,000 | $3,000 | $3,000 | $3,000 | $3,000 | $3,000 | $3,000 | $3,000 |
| Total People | 12 | 12 | 12 | 12 | 12 | 12 | 12 | 12 | 12 | 12 | 12 | 12 | |
| Total Payroll | $24,000 | $24,000 | $24,000 | $24,000 | $24,000 | $24,000 | $24,000 | $24,000 | $24,000 | $24,000 | $24,000 | $24,000 | |
| General Assumptions | |||||||||||||
| Month 1 | Month 2 | Month 3 | Month 4 | Month 5 | Month 6 | Month 7 | Month 8 | Month 9 | Month 10 | Month 11 | Month 12 | ||
| Plan Month | 1 | 2 | 3 | 4 | 5 | 6 | 7 | 8 | 9 | 10 | 11 | 12 | |
| Current Interest Rate | 10.00% | 10.00% | 10.00% | 10.00% | 10.00% | 10.00% | 10.00% | 10.00% | 10.00% | 10.00% | 10.00% | 10.00% | |
| Long-term Interest Rate | 10.00% | 10.00% | 10.00% | 10.00% | 10.00% | 10.00% | 10.00% | 10.00% | 10.00% | 10.00% | 10.00% | 10.00% | |
| Tax Rate | 30.00% | 30.00% | 30.00% | 30.00% | 30.00% | 30.00% | 30.00% | 30.00% | 30.00% | 30.00% | 30.00% | 30.00% | |
| Other | 0 | 0 | 0 | 0 | 0 | 0 | 0 | 0 | 0 | 0 | 0 | 0 | |
| Pro Forma Profit and Loss | |||||||||||||
| Month 1 | Month 2 | Month 3 | Month 4 | Month 5 | Month 6 | Month 7 | Month 8 | Month 9 | Month 10 | Month 11 | Month 12 | ||
| Sales | $25,000 | $30,800 | $35,900 | $46,000 | $47,800 | $53,800 | $61,300 | $68,500 | $73,100 | $75,400 | $81,500 | $93,000 | |
| Direct Cost of Sales | $3,500 | $4,370 | $5,135 | $12,500 | $12,770 | $14,840 | $16,940 | $18,800 | $19,880 | $20,420 | $22,700 | $25,400 | |
| Movie Screening Expenses | $2,813 | $3,465 | $4,039 | $5,175 | $5,378 | $6,053 | $6,896 | $7,706 | $8,224 | $8,483 | $9,169 | $10,463 | |
| Total Cost of Sales | $6,313 | $7,835 | $9,174 | $17,675 | $18,148 | $20,893 | $23,836 | $26,506 | $28,104 | $28,903 | $31,869 | $35,863 | |
| Gross Margin | $18,688 | $22,965 | $26,726 | $28,325 | $29,653 | $32,908 | $37,464 | $41,994 | $44,996 | $46,498 | $49,631 | $57,138 | |
| Gross Margin % | 74.75% | 74.56% | 74.45% | 61.58% | 62.03% | 61.17% | 61.12% | 61.30% | 61.55% | 61.67% | 60.90% | 61.44% | |
| Expenses | |||||||||||||
| Payroll | $24,000 | $24,000 | $24,000 | $24,000 | $24,000 | $24,000 | $24,000 | $24,000 | $24,000 | $24,000 | $24,000 | $24,000 | |
| Sales and Marketing and Other Expenses | $5,000 | $5,000 | $5,000 | $1,000 | $1,000 | $800 | $800 | $800 | $800 | $800 | $800 | $800 | |
| Depreciation | $0 | $0 | $0 | $0 | $0 | $0 | $0 | $0 | $0 | $0 | $0 | $0 | |
| Leased Equipment | $0 | $0 | $0 | $0 | $0 | $0 | $0 | $0 | $0 | $0 | $0 | $0 | |
| Utilities | $1,200 | $1,200 | $1,200 | $1,200 | $1,200 | $1,200 | $1,200 | $1,200 | $1,200 | $1,200 | $1,200 | $1,200 | |
| Insurance | $1,800 | $1,800 | $1,800 | $1,800 | $1,800 | $1,800 | $1,800 | $1,800 | $1,800 | $1,800 | $1,800 | $1,800 | |
| Rent | $2,000 | $2,000 | $2,000 | $2,000 | $2,000 | $2,000 | $2,000 | $2,000 | $2,000 | $2,000 | $2,000 | $2,000 | |
| Payroll Taxes | 15% | $3,600 | $3,600 | $3,600 | $3,600 | $3,600 | $3,600 | $3,600 | $3,600 | $3,600 | $3,600 | $3,600 | $3,600 |
| Other | $0 | $0 | $0 | $0 | $0 | $0 | $0 | $0 | $0 | $0 | $0 | $0 | |
| Total Operating Expenses | $37,600 | $37,600 | $37,600 | $33,600 | $33,600 | $33,400 | $33,400 | $33,400 | $33,400 | $33,400 | $33,400 | $33,400 | |
| Profit Before Interest and Taxes | ($18,913) | ($14,635) | ($10,874) | ($5,275) | ($3,948) | ($493) | $4,064 | $8,594 | $11,596 | $13,098 | $16,231 | $23,738 | |
| EBITDA | ($18,913) | ($14,635) | ($10,874) | ($5,275) | ($3,948) | ($493) | $4,064 | $8,594 | $11,596 | $13,098 | $16,231 | $23,738 | |
| Interest Expense | $0 | $0 | $0 | $0 | $0 | $0 | $0 | $0 | $0 | $0 | $0 | $0 | |
| Taxes Incurred | ($5,674) | ($4,391) | ($3,262) | ($1,583) | ($1,184) | ($148) | $1,219 | $2,578 | $3,479 | $3,929 | $4,869 | $7,121 | |
| Net Profit | ($13,239) | ($10,245) | ($7,612) | ($3,693) | ($2,763) | ($345) | $2,845 | $6,016 | $8,117 | $9,168 | $11,362 | $16,616 | |
| Net Profit/Sales | -52.96% | -33.26% | -21.20% | -8.03% | -5.78% | -0.64% | 4.64% | 8.78% | 11.10% | 12.16% | 13.94% | 17.87% | |
| Pro Forma Cash Flow | |||||||||||||
| Month 1 | Month 2 | Month 3 | Month 4 | Month 5 | Month 6 | Month 7 | Month 8 | Month 9 | Month 10 | Month 11 | Month 12 | ||
| Cash Received | |||||||||||||
| Cash from Operations | |||||||||||||
| Cash Sales | $25,000 | $30,800 | $35,900 | $46,000 | $47,800 | $53,800 | $61,300 | $68,500 | $73,100 | $75,400 | $81,500 | $93,000 | |
| Subtotal Cash from Operations | $25,000 | $30,800 | $35,900 | $46,000 | $47,800 | $53,800 | $61,300 | $68,500 | $73,100 | $75,400 | $81,500 | $93,000 | |
| Additional Cash Received | |||||||||||||
| Sales Tax, VAT, HST/GST Received | 0.00% | $0 | $0 | $0 | $0 | $0 | $0 | $0 | $0 | $0 | $0 | $0 | $0 |
| New Current Borrowing | $0 | $0 | $0 | $0 | $0 | $0 | $0 | $0 | $0 | $0 | $0 | $0 | |
| New Other Liabilities (interest-free) | $0 | $0 | $0 | $0 | $0 | $0 | $0 | $0 | $0 | $0 | $0 | $0 | |
| New Long-term Liabilities | $0 | $0 | $0 | $0 | $0 | $0 | $0 | $0 | $0 | $0 | $0 | $0 | |
| Sales of Other Current Assets | $0 | $0 | $0 | $0 | $0 | $0 | $0 | $0 | $0 | $0 | $0 | $0 | |
| Sales of Long-term Assets | $0 | $0 | $0 | $0 | $0 | $0 | $0 | $0 | $0 | $0 | $0 | $0 | |
| New Investment Received | $0 | $0 | $0 | $0 | $0 | $0 | $0 | $0 | $0 | $0 | $0 | $0 | |
| Subtotal Cash Received | $25,000 | $30,800 | $35,900 | $46,000 | $47,800 | $53,800 | $61,300 | $68,500 | $73,100 | $75,400 | $81,500 | $93,000 | |
| Expenditures | Month 1 | Month 2 | Month 3 | Month 4 | Month 5 | Month 6 | Month 7 | Month 8 | Month 9 | Month 10 | Month 11 | Month 12 | |
| Expenditures from Operations | |||||||||||||
| Cash Spending | $24,000 | $24,000 | $24,000 | $24,000 | $24,000 | $24,000 | $24,000 | $24,000 | $24,000 | $24,000 | $24,000 | $24,000 | |
| Bill Payments | $475 | $14,332 | $17,127 | $19,718 | $25,722 | $26,683 | $30,288 | $34,590 | $38,568 | $41,024 | $42,362 | $46,346 | |
| Subtotal Spent on Operations | $24,475 | $38,332 | $41,127 | $43,718 | $49,722 | $50,683 | $54,288 | $58,590 | $62,568 | $65,024 | $66,362 | $70,346 | |
| Additional Cash Spent | |||||||||||||
| Sales Tax, VAT, HST/GST Paid Out | $0 | $0 | $0 | $0 | $0 | $0 | $0 | $0 | $0 | $0 | $0 | $0 | |
| Principal Repayment of Current Borrowing | $0 | $0 | $0 | $0 | $0 | $0 | $0 | $0 | $0 | $0 | $0 | $0 | |
| Other Liabilities Principal Repayment | $0 | $0 | $0 | $0 | $0 | $0 | $0 | $0 | $0 | $0 | $0 | $0 | |
| Long-term Liabilities Principal Repayment | $0 | $0 | $0 | $0 | $0 | $0 | $0 | $0 | $0 | $0 | $0 | $0 | |
| Purchase Other Current Assets | $0 | $0 | $0 | $0 | $0 | $0 | $0 | $0 | $0 | $0 | $0 | $0 | |
| Purchase Long-term Assets | $0 | $0 | $0 | $0 | $0 | $0 | $0 | $0 | $0 | $0 | $0 | $0 | |
| Dividends | $0 | $0 | $0 | $0 | $0 | $0 | $0 | $0 | $0 | $0 | $0 | $0 | |
| Subtotal Cash Spent | $24,475 | $38,332 | $41,127 | $43,718 | $49,722 | $50,683 | $54,288 | $58,590 | $62,568 | $65,024 | $66,362 | $70,346 | |
| Net Cash Flow | $525 | ($7,532) | ($5,227) | $2,282 | ($1,922) | $3,117 | $7,012 | $9,910 | $10,532 | $10,376 | $15,138 | $22,654 | |
| Cash Balance | $149,725 | $142,193 | $136,966 | $139,249 | $137,327 | $140,445 | $147,456 | $157,366 | $167,899 | $178,275 | $193,413 | $216,066 | |
| Pro Forma Balance Sheet | |||||||||||||
| Month 1 | Month 2 | Month 3 | Month 4 | Month 5 | Month 6 | Month 7 | Month 8 | Month 9 | Month 10 | Month 11 | Month 12 | ||
| Assets | Starting Balances | ||||||||||||
| Current Assets | |||||||||||||
| Cash | $149,200 | $149,725 | $142,193 | $136,966 | $139,249 | $137,327 | $140,445 | $147,456 | $157,366 | $167,899 | $178,275 | $193,413 | $216,066 |
| Other Current Assets | $10,000 | $10,000 | $10,000 | $10,000 | $10,000 | $10,000 | $10,000 | $10,000 | $10,000 | $10,000 | $10,000 | $10,000 | $10,000 |
| Total Current Assets | $159,200 | $159,725 | $152,193 | $146,966 | $149,249 | $147,327 | $150,445 | $157,456 | $167,366 | $177,899 | $188,275 | $203,413 | $226,066 |
| Long-term Assets | |||||||||||||
| Long-term Assets | $0 | $0 | $0 | $0 | $0 | $0 | $0 | $0 | $0 | $0 | $0 | $0 | $0 |
| Accumulated Depreciation | $0 | $0 | $0 | $0 | $0 | $0 | $0 | $0 | $0 | $0 | $0 | $0 | $0 |
| Total Long-term Assets | $0 | $0 | $0 | $0 | $0 | $0 | $0 | $0 | $0 | $0 | $0 | $0 | $0 |
| Total Assets | $159,200 | $159,725 | $152,193 | $146,966 | $149,249 | $147,327 | $150,445 | $157,456 | $167,366 | $177,899 | $188,275 | $203,413 | $226,066 |
| Liabilities and Capital | Month 1 | Month 2 | Month 3 | Month 4 | Month 5 | Month 6 | Month 7 | Month 8 | Month 9 | Month 10 | Month 11 | Month 12 | |
| Current Liabilities | |||||||||||||
| Accounts Payable | $0 | $13,764 | $16,476 | $18,861 | $24,836 | $25,678 | $29,140 | $33,307 | $37,202 | $39,617 | $40,824 | $44,600 | $50,638 |
| Current Borrowing | $0 | $0 | $0 | $0 | $0 | $0 | $0 | $0 | $0 | $0 | $0 | $0 | $0 |
| Other Current Liabilities | $0 | $0 | $0 | $0 | $0 | $0 | $0 | $0 | $0 | $0 | $0 | $0 | $0 |
| Subtotal Current Liabilities | $0 | $13,764 | $16,476 | $18,861 | $24,836 | $25,678 | $29,140 | $33,307 | $37,202 | $39,617 | $40,824 | $44,600 | $50,638 |
| Long-term Liabilities | $0 | $0 | $0 | $0 | $0 | $0 | $0 | $0 | $0 | $0 | $0 | $0 | $0 |
| Total Liabilities | $0 | $13,764 | $16,476 | $18,861 | $24,836 | $25,678 | $29,140 | $33,307 | $37,202 | $39,617 | $40,824 | $44,600 | $50,638 |
| Paid-in Capital | $300,000 | $300,000 | $300,000 | $300,000 | $300,000 | $300,000 | $300,000 | $300,000 | $300,000 | $300,000 | $300,000 | $300,000 | $300,000 |
| Retained Earnings | ($140,800) | ($140,800) | ($140,800) | ($140,800) | ($140,800) | ($140,800) | ($140,800) | ($140,800) | ($140,800) | ($140,800) | ($140,800) | ($140,800) | ($140,800) |
| Earnings | $0 | ($13,239) | ($23,483) | ($31,095) | ($34,787) | ($37,551) | ($37,895) | ($35,051) | ($29,035) | ($20,918) | ($11,750) | ($388) | $16,229 |
| Total Capital | $159,200 | $145,961 | $135,717 | $128,105 | $124,413 | $121,649 | $121,305 | $124,149 | $130,165 | $138,282 | $147,451 | $158,812 | $175,429 |
| Total Liabilities and Capital | $159,200 | $159,725 | $152,193 | $146,966 | $149,249 | $147,327 | $150,445 | $157,456 | $167,366 | $177,899 | $188,275 | $203,413 | $226,066 |
| Net Worth | $159,200 | $145,961 | $135,717 | $128,105 | $124,413 | $121,649 | $121,305 | $124,149 | $130,165 | $138,282 | $147,451 | $158,812 | $175,429 |

