
Recycled Riding Dreams
Executive Summary
Recycled Riding Dreams will offer quality used motorcycles and motorcycle parts to a growing market of motorcycling hobbyists. For the beginner, Recycled Riding Dreams offers excellent value in a first bike that will not bust the customer’s budget. For the experienced biker, quality used parts will cut the cost of repairs and modifications by 50% to 75%.
Over the past ten years, biking has developed an entirely new customer base among baby boomer men, ages 40 to 65. Last year, motorcycle sales for this age group was twice that of young men, ages 18 to 25. In Montclair, motorcycle sales exceeded $6 million in 2000 and sales are predicted to grow by 15% this year.
Montclair is a city of 650,000 residents with an average income of $28,000. The city has seven motorcycle organizations and sponsors an annual cycling event as part of the city’s spring celebration.
Brian Jefferson, owner of Recycled Riding Dreams is one of most respected and best known motorcyclist in Montclair. Brian is the president of the largest motorcycle organization in the city with over 800 members. Last year, Brian lead the motorcycle parade during the city’s spring celebration.
Brian’s connection with the motorcycling community and the growing demand for quality used motorcycles and motorcycle parts will make Recycled Riding Dreams one of the most popular shops in the city.

1.1 Objectives
The objectives of Recycled Riding Dreams are:
- Capture the majority of the used motorcycle business in the Montclair.
- Offer our customers a superior service, at a low price.
1.2 Mission
The mission of Recycled Riding Dreams is to become the primary resource for used motorcycle parts in Montclair.
1.3 Keys to Success
The keys to success for Recycled Riding Dreams are:
- Customer referrals.
- Exceeding the customer’s expectation for quality, timeliness and price.
Company Summary
Recycled Riding Dreams will offer quality used motorcycles and motorcycle parts to a growing market of motorcycling hobbyists. The shop will purchase used and damaged bikes as well as used motorcycle parts.
2.1 Company Ownership
Recycled Riding Dreams is owned by Brian Jefferson.
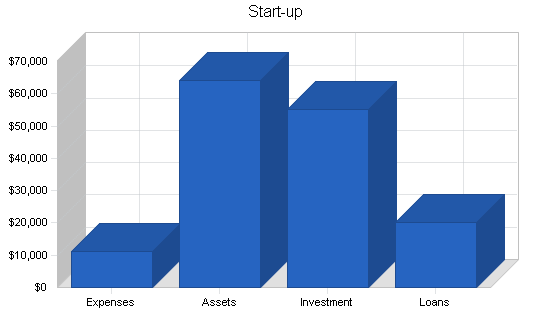
2.2 Start-up Summary
Brian Jefferson will invest $55,000 in Recycled Riding Dreams. Brian will also secure a $20,000 loan. The initial inventory for Recycled Riding Dreams will be $45,000. The focus of this inventory will be on engine and electrical parts. The source of these parts are motorcycle hobbyists who sell the parts in order to purchase upgrade parts for their own motorcycles.
The following table and chart show projected initial start-up costs for Recycled Riding Dreams.
| Start-up | |
| Requirements | |
| Start-up Expenses | |
| Legal | $1,000 |
| Stationery etc. | $200 |
| Insurance | $500 |
| Rent | $1,300 |
| Display Equipment | $3,000 |
| Expensed Equipment | $5,000 |
| Total Start-up Expenses | $11,000 |
| Start-up Assets | |
| Cash Required | $4,000 |
| Start-up Inventory | $45,000 |
| Other Current Assets | $0 |
| Long-term Assets | $15,000 |
| Total Assets | $64,000 |
| Total Requirements | $75,000 |
| Start-up Funding | |
| Start-up Expenses to Fund | $11,000 |
| Start-up Assets to Fund | $64,000 |
| Total Funding Required | $75,000 |
| Assets | |
| Non-cash Assets from Start-up | $60,000 |
| Cash Requirements from Start-up | $4,000 |
| Additional Cash Raised | $0 |
| Cash Balance on Starting Date | $4,000 |
| Total Assets | $64,000 |
| Liabilities and Capital | |
| Liabilities | |
| Current Borrowing | $0 |
| Long-term Liabilities | $20,000 |
| Accounts Payable (Outstanding Bills) | $0 |
| Other Current Liabilities (interest-free) | $0 |
| Total Liabilities | $20,000 |
| Capital | |
| Planned Investment | |
| Brian Jefferson | $55,000 |
| Other | $0 |
| Additional Investment Requirement | $0 |
| Total Planned Investment | $55,000 |
| Loss at Start-up (Start-up Expenses) | ($11,000) |
| Total Capital | $44,000 |
| Total Capital and Liabilities | $64,000 |
| Total Funding | $75,000 |
Products
Recycled Riding Dreams offers the following products:
- Used Motorcycles: These cycles have been inspected and occasionally reconditioned in order to offer the customer the best value.
- Used Parts: These quality parts include engine parts, bodywork, gas tanks, electrical parts, frame, and chassis wheels and brakes.
Market Analysis Summary
Over the past ten years, biking has developed an entirely new customer base among baby boomer men, ages 40 to 65. Last year, motorcycle sales for this age group was twice that of young men, ages 18 to 25. These two groups represent 80% of motorcycle sales. In Montclair, motorcycle sales exceeded $6 million in 2000 and sales are predicted to grow by 10% this year. The city has ten motorcycle organizations and sponsors an annual cycling event as part of the city’s spring celebration.
The demographics suggest that there is a large market for used motorcycles and motorcycle parts, especially among experienced bikers. This is particularly important because the experienced customer will seek out a shop where the owner has a reputation for quality and service in the motorcycle community.
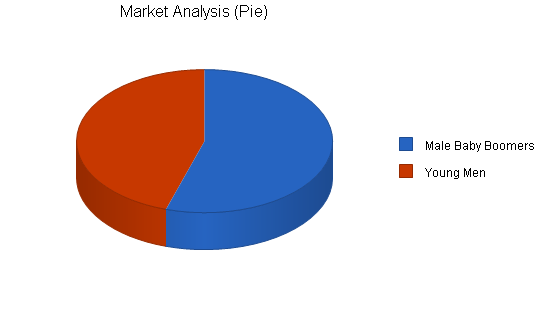
4.1 Market Segmentation
Recycled Riding Dreams will focus on two customer groups:
- Male baby boomers, ages 40 – 65.
- Young men, ages 18 – 25.
| Market Analysis | |||||||
| Year 1 | Year 2 | Year 3 | Year 4 | Year 5 | |||
| Potential Customers | Growth | CAGR | |||||
| Male Baby Boomers | 6% | 85,000 | 90,100 | 95,506 | 101,236 | 107,310 | 6.00% |
| Young Men | 5% | 70,000 | 73,500 | 77,175 | 81,034 | 85,086 | 5.00% |
| Total | 5.55% | 155,000 | 163,600 | 172,681 | 182,270 | 192,396 | 5.55% |
Strategy and Implementation Summary
Excellent word of mouth among motorcycle hobbyists is the foundation of Recycled Riding Dreams. The motorcycle community in Montclair is close and used by its members to locate resources and services. Each satisfied customer of Recycled Riding Dreams will bring in more business.
5.1 Competitive Edge
Brian Jefferson, owner of Recycled Riding Dreams is one of most respected and best known motorcyclist in Montclair. Brian is the president of the largest motorcycle organization in the city with over 800 members. He has been a motorcycle hobbyist for 15 years and has built a reputation for quality customizing of motorcycles. For the past five years, Brian has served as a resource in locating used motorcycles and motorcycle parts for hobbyists.
Recycled Riding Dreams’ competitive edge is Brian’s visibility in the motorcycling community.
5.2 Sales Strategy
Recycled Riding Dreams will open with a Customization Show and Competition. During the first month of operation, Recycled Riding Dreams will offer a 15% discount on all purchases over $50. Brian will also offer a standard 10% discount to members of the city’s seven motorcycle organizations.
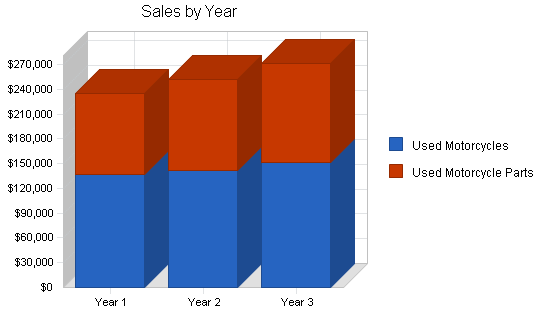
5.2.1 Sales Forecast
The table and charts below show Recycled Riding Dreams projected sales forecast for three years.

| Sales Forecast | |||
| Year 1 | Year 2 | Year 3 | |
| Sales | |||
| Used Motorcycles | $137,000 | $142,000 | $152,000 |
| Used Motorcycle Parts | $98,000 | $110,000 | $119,000 |
| Total Sales | $235,000 | $252,000 | $271,000 |
| Direct Cost of Sales | Year 1 | Year 2 | Year 3 |
| Used Motorcycles | $62,500 | $63,000 | $69,000 |
| Used Motorcycle Parts | $45,000 | $54,000 | $58,000 |
| Subtotal Direct Cost of Sales | $107,500 | $117,000 | $127,000 |
Management Summary
Brian Jefferson will manage the daily operations of the shop.
6.1 Personnel Plan
Besides Brian Jefferson, Recycled Riding Dreams will have one additional employee.
| Personnel Plan | |||
| Year 1 | Year 2 | Year 3 | |
| Brian Jefferson | $36,000 | $39,000 | $42,000 |
| Staff Person | $33,600 | $35,000 | $37,000 |
| Total People | 2 | 2 | 2 |
| Total Payroll | $69,600 | $74,000 | $79,000 |
Financial Plan
The following is the financial plan for Recycled Riding Dreams.
7.1 Break-even Analysis
The monthly break-even point is approximately $16,000.

| Break-even Analysis | |
| Monthly Revenue Break-even | $16,638 |
| Assumptions: | |
| Average Percent Variable Cost | 46% |
| Estimated Monthly Fixed Cost | $9,027 |
7.2 Projected Profit and Loss
The following table and charts shows projected profit and loss for three years.


| Pro Forma Profit and Loss | |||
| Year 1 | Year 2 | Year 3 | |
| Sales | $235,000 | $252,000 | $271,000 |
| Direct Cost of Sales | $107,500 | $117,000 | $127,000 |
| Other Production Expenses | $0 | $0 | $0 |
| Total Cost of Sales | $107,500 | $117,000 | $127,000 |
| Gross Margin | $127,500 | $135,000 | $144,000 |
| Gross Margin % | 54.26% | 53.57% | 53.14% |
| Expenses | |||
| Payroll | $69,600 | $74,000 | $79,000 |
| Sales and Marketing and Other Expenses | $6,000 | $6,000 | $6,000 |
| Depreciation | $4,284 | $4,284 | $4,284 |
| Leased Equipment | $0 | $0 | $0 |
| Utilities | $2,400 | $2,400 | $2,400 |
| Insurance | $0 | $0 | $0 |
| Rent | $15,600 | $15,600 | $15,600 |
| Payroll Taxes | $10,440 | $11,100 | $11,850 |
| Other | $0 | $0 | $0 |
| Total Operating Expenses | $108,324 | $113,384 | $119,134 |
| Profit Before Interest and Taxes | $19,176 | $21,616 | $24,866 |
| EBITDA | $23,460 | $25,900 | $29,150 |
| Interest Expense | $2,000 | $2,000 | $2,000 |
| Taxes Incurred | $5,153 | $5,885 | $6,860 |
| Net Profit | $12,023 | $13,731 | $16,006 |
| Net Profit/Sales | 5.12% | 5.45% | 5.91% |
7.3 Projected Cash Flow
The table and chart show the projected cash flow for three years.

| Pro Forma Cash Flow | |||
| Year 1 | Year 2 | Year 3 | |
| Cash Received | |||
| Cash from Operations | |||
| Cash Sales | $94,000 | $100,800 | $108,400 |
| Cash from Receivables | $116,820 | $149,451 | $160,645 |
| Subtotal Cash from Operations | $210,820 | $250,251 | $269,045 |
| Additional Cash Received | |||
| Sales Tax, VAT, HST/GST Received | $0 | $0 | $0 |
| New Current Borrowing | $0 | $0 | $0 |
| New Other Liabilities (interest-free) | $0 | $0 | $0 |
| New Long-term Liabilities | $0 | $0 | $0 |
| Sales of Other Current Assets | $0 | $0 | $0 |
| Sales of Long-term Assets | $0 | $0 | $0 |
| New Investment Received | $0 | $0 | $0 |
| Subtotal Cash Received | $210,820 | $250,251 | $269,045 |
| Expenditures | Year 1 | Year 2 | Year 3 |
| Expenditures from Operations | |||
| Cash Spending | $69,600 | $74,000 | $79,000 |
| Bill Payments | $108,864 | $153,470 | $171,723 |
| Subtotal Spent on Operations | $178,464 | $227,470 | $250,723 |
| Additional Cash Spent | |||
| Sales Tax, VAT, HST/GST Paid Out | $0 | $0 | $0 |
| Principal Repayment of Current Borrowing | $0 | $0 | $0 |
| Other Liabilities Principal Repayment | $0 | $0 | $0 |
| Long-term Liabilities Principal Repayment | $0 | $0 | $0 |
| Purchase Other Current Assets | $0 | $0 | $0 |
| Purchase Long-term Assets | $0 | $0 | $0 |
| Dividends | $0 | $0 | $0 |
| Subtotal Cash Spent | $178,464 | $227,470 | $250,723 |
| Net Cash Flow | $32,356 | $22,780 | $18,322 |
| Cash Balance | $36,356 | $59,137 | $77,459 |

7.4 Projected Balance Sheet
The table shows the projected balance sheet for three years.
| Pro Forma Balance Sheet | |||
| Year 1 | Year 2 | Year 3 | |
| Assets | |||
| Current Assets | |||
| Cash | $36,356 | $59,137 | $77,459 |
| Accounts Receivable | $24,180 | $25,929 | $27,884 |
| Inventory | $10,550 | $11,482 | $12,464 |
| Other Current Assets | $0 | $0 | $0 |
| Total Current Assets | $71,086 | $96,548 | $117,806 |
| Long-term Assets | |||
| Long-term Assets | $15,000 | $15,000 | $15,000 |
| Accumulated Depreciation | $4,284 | $8,568 | $12,852 |
| Total Long-term Assets | $10,716 | $6,432 | $2,148 |
| Total Assets | $81,802 | $102,980 | $119,954 |
| Liabilities and Capital | Year 1 | Year 2 | Year 3 |
| Current Liabilities | |||
| Accounts Payable | $5,779 | $13,226 | $14,194 |
| Current Borrowing | $0 | $0 | $0 |
| Other Current Liabilities | $0 | $0 | $0 |
| Subtotal Current Liabilities | $5,779 | $13,226 | $14,194 |
| Long-term Liabilities | $20,000 | $20,000 | $20,000 |
| Total Liabilities | $25,779 | $33,226 | $34,194 |
| Paid-in Capital | $55,000 | $55,000 | $55,000 |
| Retained Earnings | ($11,000) | $1,023 | $14,754 |
| Earnings | $12,023 | $13,731 | $16,006 |
| Total Capital | $56,023 | $69,754 | $85,761 |
| Total Liabilities and Capital | $81,802 | $102,980 | $119,954 |
| Net Worth | $56,023 | $69,754 | $85,761 |
7.5 Business Ratios
Business ratios for the years of this plan are shown below. Industry profile ratios based on the Standard Industrial Classification (SIC) code 5015, Motor Vehicle Parts Used, are shown for comparison.
| Ratio Analysis | ||||
| Year 1 | Year 2 | Year 3 | Industry Profile | |
| Sales Growth | 0.00% | 7.23% | 7.54% | 12.20% |
| Percent of Total Assets | ||||
| Accounts Receivable | 29.56% | 25.18% | 23.25% | 28.00% |
| Inventory | 12.90% | 11.15% | 10.39% | 38.90% |
| Other Current Assets | 0.00% | 0.00% | 0.00% | 16.40% |
| Total Current Assets | 86.90% | 93.75% | 98.21% | 83.30% |
| Long-term Assets | 13.10% | 6.25% | 1.79% | 16.70% |
| Total Assets | 100.00% | 100.00% | 100.00% | 100.00% |
| Current Liabilities | 7.06% | 12.84% | 11.83% | 38.90% |
| Long-term Liabilities | 24.45% | 19.42% | 16.67% | 12.30% |
| Total Liabilities | 31.51% | 32.26% | 28.51% | 51.20% |
| Net Worth | 68.49% | 67.74% | 71.49% | 48.80% |
| Percent of Sales | ||||
| Sales | 100.00% | 100.00% | 100.00% | 100.00% |
| Gross Margin | 54.26% | 53.57% | 53.14% | 23.10% |
| Selling, General & Administrative Expenses | 49.14% | 48.12% | 47.23% | 14.00% |
| Advertising Expenses | 2.55% | 2.38% | 2.21% | 0.70% |
| Profit Before Interest and Taxes | 8.16% | 8.58% | 9.18% | 2.00% |
| Main Ratios | ||||
| Current | 12.30 | 7.30 | 8.30 | 2.16 |
| Quick | 10.47 | 6.43 | 7.42 | 0.96 |
| Total Debt to Total Assets | 31.51% | 32.26% | 28.51% | 51.20% |
| Pre-tax Return on Net Worth | 30.66% | 28.12% | 26.66% | 5.30% |
| Pre-tax Return on Assets | 21.00% | 19.05% | 19.06% | 10.90% |
| Additional Ratios | Year 1 | Year 2 | Year 3 | |
| Net Profit Margin | 5.12% | 5.45% | 5.91% | n.a |
| Return on Equity | 21.46% | 19.69% | 18.66% | n.a |
| Activity Ratios | ||||
| Accounts Receivable Turnover | 5.83 | 5.83 | 5.83 | n.a |
| Collection Days | 57 | 60 | 60 | n.a |
| Inventory Turnover | 6.76 | 10.62 | 10.61 | n.a |
| Accounts Payable Turnover | 19.84 | 12.17 | 12.17 | n.a |
| Payment Days | 27 | 22 | 29 | n.a |
| Total Asset Turnover | 2.87 | 2.45 | 2.26 | n.a |
| Debt Ratios | ||||
| Debt to Net Worth | 0.46 | 0.48 | 0.40 | n.a |
| Current Liab. to Liab. | 0.22 | 0.40 | 0.42 | n.a |
| Liquidity Ratios | ||||
| Net Working Capital | $65,307 | $83,322 | $103,613 | n.a |
| Interest Coverage | 9.59 | 10.81 | 12.43 | n.a |
| Additional Ratios | ||||
| Assets to Sales | 0.35 | 0.41 | 0.44 | n.a |
| Current Debt/Total Assets | 7% | 13% | 12% | n.a |
| Acid Test | 6.29 | 4.47 | 5.46 | n.a |
| Sales/Net Worth | 4.19 | 3.61 | 3.16 | n.a |
| Dividend Payout | 0.00 | 0.00 | 0.00 | n.a |
Appendix
| Sales Forecast | |||||||||||||
| Month 1 | Month 2 | Month 3 | Month 4 | Month 5 | Month 6 | Month 7 | Month 8 | Month 9 | Month 10 | Month 11 | Month 12 | ||
| Sales | |||||||||||||
| Used Motorcycles | 0% | $9,000 | $11,000 | $12,000 | $12,000 | $12,000 | $12,000 | $12,000 | $11,000 | $12,000 | $11,000 | $12,000 | $11,000 |
| Used Motorcycle Parts | 0% | $4,000 | $5,000 | $7,000 | $8,000 | $9,000 | $10,000 | $8,000 | $9,000 | $10,000 | $10,000 | $9,000 | $9,000 |
| Total Sales | $13,000 | $16,000 | $19,000 | $20,000 | $21,000 | $22,000 | $20,000 | $20,000 | $22,000 | $21,000 | $21,000 | $20,000 | |
| Direct Cost of Sales | Month 1 | Month 2 | Month 3 | Month 4 | Month 5 | Month 6 | Month 7 | Month 8 | Month 9 | Month 10 | Month 11 | Month 12 | |
| Used Motorcycles | $5,000 | $5,000 | $6,000 | $6,000 | $6,000 | $6,000 | $6,000 | $5,000 | $6,000 | $5,000 | $6,000 | $500 | |
| Used Motorcycle Parts | $2,000 | $2,500 | $3,500 | $4,000 | $4,500 | $5,000 | $4,000 | $4,500 | $5,000 | $5,000 | $4,500 | $500 | |
| Subtotal Direct Cost of Sales | $7,000 | $7,500 | $9,500 | $10,000 | $10,500 | $11,000 | $10,000 | $9,500 | $11,000 | $10,000 | $10,500 | $1,000 | |
| Personnel Plan | |||||||||||||
| Month 1 | Month 2 | Month 3 | Month 4 | Month 5 | Month 6 | Month 7 | Month 8 | Month 9 | Month 10 | Month 11 | Month 12 | ||
| Brian Jefferson | 0% | $3,000 | $3,000 | $3,000 | $3,000 | $3,000 | $3,000 | $3,000 | $3,000 | $3,000 | $3,000 | $3,000 | $3,000 |
| Staff Person | 0% | $2,800 | $2,800 | $2,800 | $2,800 | $2,800 | $2,800 | $2,800 | $2,800 | $2,800 | $2,800 | $2,800 | $2,800 |
| Total People | 2 | 2 | 2 | 2 | 2 | 2 | 2 | 2 | 2 | 2 | 2 | 2 | |
| Total Payroll | $5,800 | $5,800 | $5,800 | $5,800 | $5,800 | $5,800 | $5,800 | $5,800 | $5,800 | $5,800 | $5,800 | $5,800 | |
| General Assumptions | |||||||||||||
| Month 1 | Month 2 | Month 3 | Month 4 | Month 5 | Month 6 | Month 7 | Month 8 | Month 9 | Month 10 | Month 11 | Month 12 | ||
| Plan Month | 1 | 2 | 3 | 4 | 5 | 6 | 7 | 8 | 9 | 10 | 11 | 12 | |
| Current Interest Rate | 10.00% | 10.00% | 10.00% | 10.00% | 10.00% | 10.00% | 10.00% | 10.00% | 10.00% | 10.00% | 10.00% | 10.00% | |
| Long-term Interest Rate | 10.00% | 10.00% | 10.00% | 10.00% | 10.00% | 10.00% | 10.00% | 10.00% | 10.00% | 10.00% | 10.00% | 10.00% | |
| Tax Rate | 30.00% | 30.00% | 30.00% | 30.00% | 30.00% | 30.00% | 30.00% | 30.00% | 30.00% | 30.00% | 30.00% | 30.00% | |
| Other | 0 | 0 | 0 | 0 | 0 | 0 | 0 | 0 | 0 | 0 | 0 | 0 | |
| Pro Forma Profit and Loss | |||||||||||||
| Month 1 | Month 2 | Month 3 | Month 4 | Month 5 | Month 6 | Month 7 | Month 8 | Month 9 | Month 10 | Month 11 | Month 12 | ||
| Sales | $13,000 | $16,000 | $19,000 | $20,000 | $21,000 | $22,000 | $20,000 | $20,000 | $22,000 | $21,000 | $21,000 | $20,000 | |
| Direct Cost of Sales | $7,000 | $7,500 | $9,500 | $10,000 | $10,500 | $11,000 | $10,000 | $9,500 | $11,000 | $10,000 | $10,500 | $1,000 | |
| Other Production Expenses | $0 | $0 | $0 | $0 | $0 | $0 | $0 | $0 | $0 | $0 | $0 | $0 | |
| Total Cost of Sales | $7,000 | $7,500 | $9,500 | $10,000 | $10,500 | $11,000 | $10,000 | $9,500 | $11,000 | $10,000 | $10,500 | $1,000 | |
| Gross Margin | $6,000 | $8,500 | $9,500 | $10,000 | $10,500 | $11,000 | $10,000 | $10,500 | $11,000 | $11,000 | $10,500 | $19,000 | |
| Gross Margin % | 46.15% | 53.13% | 50.00% | 50.00% | 50.00% | 50.00% | 50.00% | 52.50% | 50.00% | 52.38% | 50.00% | 95.00% | |
| Expenses | |||||||||||||
| Payroll | $5,800 | $5,800 | $5,800 | $5,800 | $5,800 | $5,800 | $5,800 | $5,800 | $5,800 | $5,800 | $5,800 | $5,800 | |
| Sales and Marketing and Other Expenses | $500 | $500 | $500 | $500 | $500 | $500 | $500 | $500 | $500 | $500 | $500 | $500 | |
| Depreciation | $357 | $357 | $357 | $357 | $357 | $357 | $357 | $357 | $357 | $357 | $357 | $357 | |
| Leased Equipment | $0 | $0 | $0 | $0 | $0 | $0 | $0 | $0 | $0 | $0 | $0 | $0 | |
| Utilities | $200 | $200 | $200 | $200 | $200 | $200 | $200 | $200 | $200 | $200 | $200 | $200 | |
| Insurance | $0 | $0 | $0 | $0 | $0 | $0 | $0 | $0 | $0 | $0 | $0 | $0 | |
| Rent | $1,300 | $1,300 | $1,300 | $1,300 | $1,300 | $1,300 | $1,300 | $1,300 | $1,300 | $1,300 | $1,300 | $1,300 | |
| Payroll Taxes | 15% | $870 | $870 | $870 | $870 | $870 | $870 | $870 | $870 | $870 | $870 | $870 | $870 |
| Other | $0 | $0 | $0 | $0 | $0 | $0 | $0 | $0 | $0 | $0 | $0 | $0 | |
| Total Operating Expenses | $9,027 | $9,027 | $9,027 | $9,027 | $9,027 | $9,027 | $9,027 | $9,027 | $9,027 | $9,027 | $9,027 | $9,027 | |
| Profit Before Interest and Taxes | ($3,027) | ($527) | $473 | $973 | $1,473 | $1,973 | $973 | $1,473 | $1,973 | $1,973 | $1,473 | $9,973 | |
| EBITDA | ($2,670) | ($170) | $830 | $1,330 | $1,830 | $2,330 | $1,330 | $1,830 | $2,330 | $2,330 | $1,830 | $10,330 | |
| Interest Expense | $167 | $167 | $167 | $167 | $167 | $167 | $167 | $167 | $167 | $167 | $167 | $167 | |
| Taxes Incurred | ($958) | ($208) | $92 | $242 | $392 | $542 | $242 | $392 | $542 | $542 | $392 | $2,942 | |
| Net Profit | ($2,236) | ($486) | $214 | $564 | $914 | $1,264 | $564 | $914 | $1,264 | $1,264 | $914 | $6,864 | |
| Net Profit/Sales | -17.20% | -3.03% | 1.13% | 2.82% | 4.35% | 5.75% | 2.82% | 4.57% | 5.75% | 6.02% | 4.35% | 34.32% | |
| Pro Forma Cash Flow | |||||||||||||
| Month 1 | Month 2 | Month 3 | Month 4 | Month 5 | Month 6 | Month 7 | Month 8 | Month 9 | Month 10 | Month 11 | Month 12 | ||
| Cash Received | |||||||||||||
| Cash from Operations | |||||||||||||
| Cash Sales | $5,200 | $6,400 | $7,600 | $8,000 | $8,400 | $8,800 | $8,000 | $8,000 | $8,800 | $8,400 | $8,400 | $8,000 | |
| Cash from Receivables | $0 | $260 | $7,860 | $9,660 | $11,420 | $12,020 | $12,620 | $13,160 | $12,000 | $12,040 | $13,180 | $12,600 | |
| Subtotal Cash from Operations | $5,200 | $6,660 | $15,460 | $17,660 | $19,820 | $20,820 | $20,620 | $21,160 | $20,800 | $20,440 | $21,580 | $20,600 | |
| Additional Cash Received | |||||||||||||
| Sales Tax, VAT, HST/GST Received | 0.00% | $0 | $0 | $0 | $0 | $0 | $0 | $0 | $0 | $0 | $0 | $0 | $0 |
| New Current Borrowing | $0 | $0 | $0 | $0 | $0 | $0 | $0 | $0 | $0 | $0 | $0 | $0 | |
| New Other Liabilities (interest-free) | $0 | $0 | $0 | $0 | $0 | $0 | $0 | $0 | $0 | $0 | $0 | $0 | |
| New Long-term Liabilities | $0 | $0 | $0 | $0 | $0 | $0 | $0 | $0 | $0 | $0 | $0 | $0 | |
| Sales of Other Current Assets | $0 | $0 | $0 | $0 | $0 | $0 | $0 | $0 | $0 | $0 | $0 | $0 | |
| Sales of Long-term Assets | $0 | $0 | $0 | $0 | $0 | $0 | $0 | $0 | $0 | $0 | $0 | $0 | |
| New Investment Received | $0 | $0 | $0 | $0 | $0 | $0 | $0 | $0 | $0 | $0 | $0 | $0 | |
| Subtotal Cash Received | $5,200 | $6,660 | $15,460 | $17,660 | $19,820 | $20,820 | $20,620 | $21,160 | $20,800 | $20,440 | $21,580 | $20,600 | |
| Expenditures | Month 1 | Month 2 | Month 3 | Month 4 | Month 5 | Month 6 | Month 7 | Month 8 | Month 9 | Month 10 | Month 11 | Month 12 | |
| Expenditures from Operations | |||||||||||||
| Cash Spending | $5,800 | $5,800 | $5,800 | $5,800 | $5,800 | $5,800 | $5,800 | $5,800 | $5,800 | $5,800 | $5,800 | $5,800 | |
| Bill Payments | $69 | $2,104 | $2,839 | $3,134 | $3,652 | $14,500 | $15,030 | $12,185 | $12,507 | $16,104 | $12,545 | $14,195 | |
| Subtotal Spent on Operations | $5,869 | $7,904 | $8,639 | $8,934 | $9,452 | $20,300 | $20,830 | $17,985 | $18,307 | $21,904 | $18,345 | $19,995 | |
| Additional Cash Spent | |||||||||||||
| Sales Tax, VAT, HST/GST Paid Out | $0 | $0 | $0 | $0 | $0 | $0 | $0 | $0 | $0 | $0 | $0 | $0 | |
| Principal Repayment of Current Borrowing | $0 | $0 | $0 | $0 | $0 | $0 | $0 | $0 | $0 | $0 | $0 | $0 | |
| Other Liabilities Principal Repayment | $0 | $0 | $0 | $0 | $0 | $0 | $0 | $0 | $0 | $0 | $0 | $0 | |
| Long-term Liabilities Principal Repayment | $0 | $0 | $0 | $0 | $0 | $0 | $0 | $0 | $0 | $0 | $0 | $0 | |
| Purchase Other Current Assets | $0 | $0 | $0 | $0 | $0 | $0 | $0 | $0 | $0 | $0 | $0 | $0 | |
| Purchase Long-term Assets | $0 | $0 | $0 | $0 | $0 | $0 | $0 | $0 | $0 | $0 | $0 | $0 | |
| Dividends | $0 | $0 | $0 | $0 | $0 | $0 | $0 | $0 | $0 | $0 | $0 | $0 | |
| Subtotal Cash Spent | $5,869 | $7,904 | $8,639 | $8,934 | $9,452 | $20,300 | $20,830 | $17,985 | $18,307 | $21,904 | $18,345 | $19,995 | |
| Net Cash Flow | ($669) | ($1,244) | $6,821 | $8,726 | $10,368 | $520 | ($210) | $3,175 | $2,493 | ($1,464) | $3,235 | $605 | |
| Cash Balance | $3,331 | $2,087 | $8,909 | $17,635 | $28,003 | $28,523 | $28,313 | $31,487 | $33,981 | $32,517 | $35,752 | $36,356 | |
| Pro Forma Balance Sheet | |||||||||||||
| Month 1 | Month 2 | Month 3 | Month 4 | Month 5 | Month 6 | Month 7 | Month 8 | Month 9 | Month 10 | Month 11 | Month 12 | ||
| Assets | Starting Balances | ||||||||||||
| Current Assets | |||||||||||||
| Cash | $4,000 | $3,331 | $2,087 | $8,909 | $17,635 | $28,003 | $28,523 | $28,313 | $31,487 | $33,981 | $32,517 | $35,752 | $36,356 |
| Accounts Receivable | $0 | $7,800 | $17,140 | $20,680 | $23,020 | $24,200 | $25,380 | $24,760 | $23,600 | $24,800 | $25,360 | $24,780 | $24,180 |
| Inventory | $45,000 | $38,000 | $30,500 | $21,000 | $11,000 | $11,550 | $12,100 | $11,000 | $10,450 | $12,100 | $11,000 | $11,550 | $10,550 |
| Other Current Assets | $0 | $0 | $0 | $0 | $0 | $0 | $0 | $0 | $0 | $0 | $0 | $0 | $0 |
| Total Current Assets | $49,000 | $49,131 | $49,727 | $50,589 | $51,655 | $63,753 | $66,003 | $64,073 | $65,537 | $70,881 | $68,877 | $72,082 | $71,086 |
| Long-term Assets | |||||||||||||
| Long-term Assets | $15,000 | $15,000 | $15,000 | $15,000 | $15,000 | $15,000 | $15,000 | $15,000 | $15,000 | $15,000 | $15,000 | $15,000 | $15,000 |
| Accumulated Depreciation | $0 | $357 | $714 | $1,071 | $1,428 | $1,785 | $2,142 | $2,499 | $2,856 | $3,213 | $3,570 | $3,927 | $4,284 |
| Total Long-term Assets | $15,000 | $14,643 | $14,286 | $13,929 | $13,572 | $13,215 | $12,858 | $12,501 | $12,144 | $11,787 | $11,430 | $11,073 | $10,716 |
| Total Assets | $64,000 | $63,774 | $64,013 | $64,518 | $65,227 | $76,968 | $78,861 | $76,574 | $77,681 | $82,668 | $80,307 | $83,155 | $81,802 |
| Liabilities and Capital | Month 1 | Month 2 | Month 3 | Month 4 | Month 5 | Month 6 | Month 7 | Month 8 | Month 9 | Month 10 | Month 11 | Month 12 | |
| Current Liabilities | |||||||||||||
| Accounts Payable | $0 | $2,009 | $2,734 | $3,024 | $3,169 | $13,996 | $14,624 | $11,773 | $11,966 | $15,688 | $12,063 | $13,996 | $5,779 |
| Current Borrowing | $0 | $0 | $0 | $0 | $0 | $0 | $0 | $0 | $0 | $0 | $0 | $0 | $0 |
| Other Current Liabilities | $0 | $0 | $0 | $0 | $0 | $0 | $0 | $0 | $0 | $0 | $0 | $0 | $0 |
| Subtotal Current Liabilities | $0 | $2,009 | $2,734 | $3,024 | $3,169 | $13,996 | $14,624 | $11,773 | $11,966 | $15,688 | $12,063 | $13,996 | $5,779 |
| Long-term Liabilities | $20,000 | $20,000 | $20,000 | $20,000 | $20,000 | $20,000 | $20,000 | $20,000 | $20,000 | $20,000 | $20,000 | $20,000 | $20,000 |
| Total Liabilities | $20,000 | $22,009 | $22,734 | $23,024 | $23,169 | $33,996 | $34,624 | $31,773 | $31,966 | $35,688 | $32,063 | $33,996 | $25,779 |
| Paid-in Capital | $55,000 | $55,000 | $55,000 | $55,000 | $55,000 | $55,000 | $55,000 | $55,000 | $55,000 | $55,000 | $55,000 | $55,000 | $55,000 |
| Retained Earnings | ($11,000) | ($11,000) | ($11,000) | ($11,000) | ($11,000) | ($11,000) | ($11,000) | ($11,000) | ($11,000) | ($11,000) | ($11,000) | ($11,000) | ($11,000) |
| Earnings | $0 | ($2,236) | ($2,721) | ($2,507) | ($1,942) | ($1,028) | $237 | $801 | $1,715 | $2,980 | $4,244 | $5,159 | $12,023 |
| Total Capital | $44,000 | $41,764 | $41,279 | $41,493 | $42,058 | $42,972 | $44,237 | $44,801 | $45,715 | $46,980 | $48,244 | $49,159 | $56,023 |
| Total Liabilities and Capital | $64,000 | $63,774 | $64,013 | $64,518 | $65,227 | $76,968 | $78,861 | $76,574 | $77,681 | $82,668 | $80,307 | $83,155 | $81,802 |
| Net Worth | $44,000 | $41,764 | $41,279 | $41,493 | $42,058 | $42,972 | $44,237 | $44,801 | $45,715 | $46,980 | $48,244 | $49,159 | $56,023 |


