
Lowland Heights Roadhouse
Executive Summary
Introduction
The long-term goal of Lowland Heights Roadhouse for temporary lodging, restaurant, bar and RV Park by creating a differentiated experience capitalizing on personal service, the historical nature of the Roadhouse buildings, and its unique location in one of the most attractive parts of South Central Weststate. We plan to be more than a great lodging, restaurant, bar and RV Park. We plan to create an environment of pampered luxury that surpasses the standard fare for Dusty Corners. Expanding our exposure via the Internet and introducing the Greenhorn Valley to people that have not yet discovered this year-round paradise will allow us to maintain a higher than average occupancy rate and above average profits.
Location
The Lowland Heights Roadhouse is located in South Central Weststate at the northern end of the Greenhorn Valley and is surrounded by the Ombligo de Dios mountain range on the east and the Lost Pony hills on the west. The Roadhouse is located on a main thoroughfare Route 173, located approximately 52 miles north of Silver Gulch and 47 miles southwest of Friday Falls.
The Company
Lowland Heights Roadhouse is an established Motel and RV Park, and has been in operation for the last forty-four years as Thirsty Creek Lodge and The Lodge at Lowland Heights. After taking possession and a brief period of becoming established, we added a restaurant to ensure a steady flow of patrons (hunters, tourists and locals) through its doors. The past four owners had only owned the property for two to three years each, the business has not been operated to its fullest capacity and was run down. Next spring we plan on adding a full service coin-operated laundry facility (washing, drying, and optional folding) along with a four bay self-serve car wash.
The Lowland Heights Roadhouse is a dba of Golden Cholla Enterprises LLC, a Weststate Corporation owned and operated by Tory Britts and assisted by her husband Gisli Njerdginsyn.
Britts and Njerdginsyn will operate the Roadhouse as a hunting resort during the months of September to December. During the rest of the year it will operate as a vacation resort (January to August). The lodge will be opened year round 24 hours a day, 7 days a week.
Our Services
The Lowland Heights Roadhouse was originally built in 1954. Each of our rooms is equipped with two double beds or a queen bed, and rooms with a second bedroom or kitchenette are available. We have a full-service restaurant, a bar with a dance floor that provides live entertainment, and eight RV sites with hook-ups. Next spring we will be putting in full-service coin-operated laundry facilities (washing, drying, and optional folding) along with a four-bay self-serve car wash. The Roadhouse also has on-site front desk service. The buildings have undergone a number of restorations and we plan more, possibly adding 10 more motel units next spring.
As the Roadhouse becomes established through the peak season, we plan to expand our services to the residents of Dusty Corners and surrounding cities in time for the off-season. The large dance floor area is ideal for formal or informal gatherings (e.g. wedding receptions, club meetings, Christmas parties, family reunions, etc.).
The Market
Lowland Heights Roadhouse’s target market strategy is based on becoming a destination choice for the people in the Greenhorn Valley who are looking for a place to relax or recharge. The target markets that we are going to pursue are people or families looking for a vacation destination, honeymooners, family reunions, hunters, and drop-in customers. Our setting and facility is a natural for people or families to visit, what with the Greenhorn Valley having so many outdoor things to do. A modest projection for increased unit rental is 30% per year, and since there is no laundromat or car wash within 50 miles the sky’s the limit since there is no competition.
The restaurant has increased in sales weekly as the only competition is a Mexican food restaurant in town and nothing else for 20 miles. This projection is without any significant increase in advertising or exposure, but is based on the general average increase in tourism.
Our three major customer segments are tourists, hunters from all over the United States since this area is known for great hunting of elk and deer, and local patrons who need the facilities for various events. Subscriptions to various Web services will provide international exposure to potential customers for nominal annual fees, plus we have a website http//www.lodgeatlowlandheights.com. The Roadhouse would like to see a 10% increase in customers on a yearly basis.
Financial Considerations
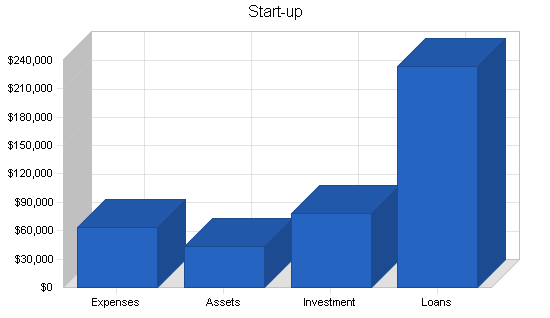
Golden Cholla Enterprises LLC dba the Lowland Heights Roadhouse will be acquired via a Small Business Administration (SBA) loan with the buyers supplying 20% down. We are assuming an initial capital start-up, as shown in the Start-up table, for operating expenses which we have already contributed.
We estimate average monthly fixed costs, including operating expenses and mortgage payment, as presented in the Financial Plan chapter below. Peak and off-season will have significant impact on the monthly earnings. For the first year, on-season revenues will offset off-season losses. As Lowland Heights Roadhouse builds its market position among the local patrons, we anticipate that off-season revenues will be enough to break even during that season.

1.1 Objectives
The objective of the Lowland Heights Roadhouse for the first three years of operation include:
- Open the Lowland Heights Roadhouse “turnkey operation” with existing bookings from the previous owners, and new bookings under an uncreased rental rate after possession.
- Exceeding the customer’s expectations for hunting and vacationing accommodations.
- Maintaining a 90% occupancy rate each month.
- Assembling an experience and effective staff.
- To increase the number of clients by 10% each year.
- Increase exposure and market using Internet technology and direct advertising.
- Through incentives and increased exposure on the Internet, we hope to increase off-season occupancy by 30% the first year.
- Increase off-season use by expanding into other uses for property (cater parties, receptions, weddings, etc.).
1.2 Keys to Success
The primary keys to success for the Lowland Heights Roadhouse will be based on the following factors:
- Provide a facility that is first class with attention to detail.
- Give each guest a sense that he or she is our top priority.
- Provide quality meals.
- Retain our guests to ensure repeat bookings and referrals.
1.3 Mission
The mission of Lowland Heights Roadhouse is to become the best choice in Prickly Pear County for temporary lodging by expanding our exposure via the Internet (with multiple networks and links), and introducing the area to market segments that have not yet discovered this year-round hunter’s dream. We plan to be more than a great Roadhouse. We plan to create an environment of conveniences that surpasses the standard fare for Dusty Corners.
The Roadhouse guests will have every need met to ensure his/her comfort. For special occasions, catered meals, chilled wine, etc. can be provided for an additional fee. During the weekends, guests will return to the Roadhouse in the evening and find a fine restaurant to dine at before turning in.

As the Lowland Heights Roadhouse becomes established through the peak season, we plan to expand our services to the residents of Dusty Corners and neighboring cities in time for the off-season. The large dining area can convert into a large area, ideal for formal or informal gatherings (i.e. wedding receptions, family reunions, Christmas parties, etc.). The outdoors, with its access to the mountains, opens several additional opportunities. With the capability for a catered reception inside, the Roadhouse will make events smooth and easy for the guests. As owners we intend to see that attention to detail and service and good food will be followed by a staff dedicated to each guest.
Company Summary
The Lowland Heights Roadhouse is located in South Central Weststate at the northern end of the Greenhorn Valley and is surrounded by the Ombligo de Dios mountain range on the east and the Lost Pony Hills on the west. The Roadhouse is located on a main thoroughfare Route 173, located approximately 52 miles north of Silver Gulch and 47 miles southwest of Friday Falls.
2.1 Company Ownership
Lowland Heights Roadhouse is a dba of Golden Cholla Enterprises LLC, a Weststate Corporation owned and operated by Tory Britts and assisted by her husband Gisli Njerdginsyn.
2.2 Start-up Summary
Tory Britts (owner) and husband Gisli Njerdginsyn will invest heavily in the business. Golden Cholla Enterprises LLC dba Lowland Heights Roadhouse will be acquired via a Small Business Administration (SBA) loan with Britts supplying a down payment on the property as part of her investment.
| Start-up Funding | |
| Start-up Expenses to Fund | $63,175 |
| Start-up Assets to Fund | $43,033 |
| Total Funding Required | $106,208 |
| Assets | |
| Non-cash Assets from Start-up | $25,033 |
| Cash Requirements from Start-up | $18,000 |
| Additional Cash Raised | $205,582 |
| Cash Balance on Starting Date | $223,582 |
| Total Assets | $248,616 |
| Liabilities and Capital | |
| Liabilities | |
| Current Borrowing | $0 |
| Long-term Liabilities | $232,000 |
| Accounts Payable (Outstanding Bills) | $1,047 |
| Other Current Liabilities (interest-free) | $744 |
| Total Liabilities | $233,791 |
| Capital | |
| Planned Investment | |
| Tory Britts | $78,000 |
| Investor | $0 |
| Additional Investment Requirement | $0 |
| Total Planned Investment | $78,000 |
| Loss at Start-up (Start-up Expenses) | ($63,175) |
| Total Capital | $14,825 |
| Total Capital and Liabilities | $248,616 |
| Total Funding | $311,791 |
| Start-up | |
| Requirements | |
| Start-up Expenses | |
| Legal | $2,300 |
| Stationery etc. | $75 |
| Brochures | $600 |
| Property Downpayment | $58,000 |
| Lodge Setup | $200 |
| Lease until closing of Property | $1,300 |
| Direct – TV | $200 |
| Insurance | $500 |
| Total Start-up Expenses | $63,175 |
| Start-up Assets | |
| Cash Required | $18,000 |
| Start-up Inventory | $0 |
| Other Current Assets | $9,827 |
| Long-term Assets | $15,206 |
| Total Assets | $43,033 |
| Total Requirements | $106,208 |
Services
Lowland Heights Roadhouse will offer customers eight 1-bedroom units and two 2-bedroom units. Two units have a kitchenette and 2 units can be used together as a suite. Each unit is equipped with two double beds or a queen bed.
We have a full-service restaurant, a bar with a dance floor that provides live entertainment, and eight RV sites with hook-ups. Next spring we will be putting in full-service coin-operated laundry facilities (washing, drying, and optional folding) along with a four bay self-serve car wash.
Market Analysis Summary
The Lowland Heights Roadhouse’s target market strategy is based on becoming a destination choice for families and hunters in the greater Greenhorn Valley region who are looking for a place to relax or hunt or recharge. The target markets that we are going to pursue are people looking for a vacation or hunting destination, and drop-in customers. We envision many hunters from all over the United States, as some do now, coming to stay and hunt in this great Greenhorn Valley region. The setting and our facilities make the Lowland Heights Roadhouse a natural destination choice for people. The Roadhouse would like to see a 10% increase in customers on a yearly basis.
4.1 Market Segmentation
Our target market strategy is based on becoming a destination for people who are looking to get away for a vacation or an area to hunt in. Our marketing strategy is based on superior performance in the following areas:
- Quality facilities
- Beautiful location
- Customer service
The target markets are separated into three segments; “Vacationers,” “Hunters,” and “Drop-ins.” The primary marketing opportunity is selling to these accessible target market segments by focusing on their vacation and recreational needs.
Vacationers
During the spring and summer months, the Lowland Heights Roadhouse area is a beautiful wilderness retreat with over 50 hiking trails nearby and other outdoor recreational activities.
Hunters
The Lowland Heights Roadhouse locale is one of the best hunting areas in the U.S.
Drop-ins
When rooms are available we will welcome the drop-in customer who is looking for a place to stay for the night. Our sign can be seen from Route 173, a main thoroughfare, and we expect to get quite a few drop-ins.

| Market Analysis | |||||||
| Year 1 | Year 2 | Year 3 | Year 4 | Year 5 | |||
| Potential Customers | Growth | CAGR | |||||
| Hunters | 15% | 90,000 | 103,500 | 119,025 | 136,879 | 157,411 | 15.00% |
| Drop-ins | 10% | 20,000 | 22,000 | 24,200 | 26,620 | 29,282 | 10.00% |
| Spring & Summer Visitors | 15% | 60,000 | 69,000 | 79,350 | 91,253 | 104,941 | 15.00% |
| Total | 14.45% | 170,000 | 194,500 | 222,575 | 254,752 | 291,634 | 14.45% |
4.2 Service Business Analysis
The Lowland Heights Roadhouse is a 10 room facility, restaurant, bar and RV Park that has full hook-ups that provides overnight lodging, and lunch, dinner and spirits in a country setting in the Greenhorn Valley. There is only one other restaurant and motel in the area. Most people who need lodging in the area make reservations in advance to assure room availability.
4.3 Competition and Buying Patterns
The Lowland Heights Roadhouse offers a unique country environment, which caters to an ever increasing group of travelers. Our Lodge creates a climate of home, where guests become temporary members of a larger family. The Roadhouse’s homey feel opens itself to guests, allowing them to participate and share in the richness of a community, while still allowing whatever degree of privacy is preferred. Meals or drinks can be shared with the innkeeper and other travelers allowing new relationships to be created and old ones enriched. Or, meals can be taken in the privacy of the guest’s room.
A variety of settings are available in the Roadhouse, situated to enable individuals or small groups to locate the perfect setting for whatever mood or activity one is pursuing (eating, drinking, watching television, playing pool, etc.). At the Roadhouse, a guest is a guest in one’s home, not a customer. It becomes a place to return to: at the end of a day, or during the next vacation (like going home).
Strategy and Implementation Summary
The primary sales and marketing strategy for the Lowland Heights Roadhouse includes these factors:
- To offer a motel, restaurant and RV Park facility that will appeal to the vacationer or hunter.
- To provide unmatched customer service to our guests.
- To concentrate our marketing in the greater Greenhorn Valley area.
5.1 Competitive Edge
The Lowland Heights Roadhouse sets itself apart from similar competition in the following ways.
- Location: Having a motel, restaurant, bar, and RV Park all at one facility is a huge plus, because guests never have to leave.
- Our rooms: Each room is individually decorated with a country setting that is tasteful and comfortable. You feel as if you have stepped back in time.
- Customer service: Customer service is our number one priority. The Lowland Heights Roadhouse will treat each guest as if they are family.
Another significant advantage for the Lowland Heights Roadhouse is its location. Being located in the Greenhorn Valley area, the Roadhouse is uniquely positioned, centrally located to hunting areas, a national park, and historical places.
5.2 Marketing Strategy
Our marketing strategy is based on becoming a destination for vacationers and hunters who are looking for truly beautiful and unique lodgings. With the greater Greenhorn Valley area our main target market the Lowland Heights Roadhouse will use several different approaches to advertise our facility. We will use the Yellow Pages to advertise, as well as develop a Web page that will show our Lodge with our motel, restaurant, bar and RV Park. On Route 173 we will have an eye catching sign that will alert potential drop-ins of our existence. The Roadhouse is confident that it will not take long, with word-of-mouth recommendations from past customers, to build up to full capacity.
With the right exposure, we believe that an un-tapped market of vacationers and hunters can be enticed to Greenhorn Valley and the Lowland Heights Roadhouse. Membership in WorldRes.com (an international Web catalog for lodging) will put us in front of millions of computer screens on a daily basis.
The WorldRes partner network allows real-time reservations on today’s most popular websites, including AOL, Yahoo!, and Lycos. In addition, WorldRes has developed exclusive relationships with destination and special activity websites and call centers. WorldRes provides a free connection to the SABRE travel agent system, providing access to over 100,000 agents worldwide, as well as to users of Travelocity, one of the most popular online travel sites.
All of this visibility is free, with the exception of a five to ten percent transaction fee for any booking made directly via the service and online; much less expensive, yet more comprehensive than traditional advertising. However, not all lodging patrons are computer savvy. Therefore, we will be placing seasonal specific advertisements in regional newspapers and major city magazines.
5.3 Sales Strategy
The Lowland Heights Roadhouse will rent its rooms directly to repeat customers, as well as via traditional travel agents and through the Internet. All reservations will be handled by Tory or Gisli. Repeat customers will have the privilege of priority reservations during the high season. As mentioned above, we will also list the Lowland Heights Roadhouse on www.worldres.com, which will make it available to millions of international tourists.
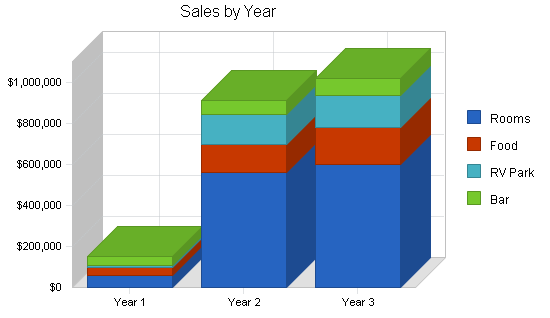
5.3.1 Sales Forecast
The sales forecast table is broken down into two main revenue streams: Reservations and Drop-ins. The sales forecast for the upcoming year is based on a 10% growth rate for direct sales. The Lowland Heights Roadhouse has 10 rooms to offer its guests at a rate of $44 – $89 per night. We expect the number of rooms occupied to increase as the year progresses. In spite of the economic unpredictability we are experiencing, these projections appear attainable and take the increasing base into consideration. Growth rates for the years 2005 and 2006 are based on percentage increases as follows:
- Reservations: 10% growth rate per year.
- Drop-ins: 10% growth rate per year.

| Sales Forecast | |||
| Year 1 | Year 2 | Year 3 | |
| Sales | |||
| Rooms | $58,838 | $560,000 | $600,000 |
| Food | $36,556 | $140,000 | $180,000 |
| RV Park | $10,147 | $145,000 | $160,000 |
| Bar | $45,854 | $70,000 | $82,000 |
| Total Sales | $151,394 | $915,000 | $1,022,000 |
| Direct Cost of Sales | Year 1 | Year 2 | Year 3 |
| Rooms | $300 | $500 | $600 |
| Food | $6,865 | $28,000 | $36,000 |
| RV Park | $180 | $250 | $350 |
| Bar | $3,926 | $6,100 | $7,200 |
| Subtotal Direct Cost of Sales | $11,271 | $34,850 | $44,150 |
Web Plan Summary
The Lowland Heights Roadhouse website will focus on the features the Roadhouse has to offer. Each room with its different options will be on the site as well as pictures of the Roadhouse and the facilities that it has to offer. The lunch/dinner menu will be displayed. Room rates will be given, with maps on how to get to here. Attractions within 30 miles will be on the site and other local color will be shown. Reservations can be made online if the consumer wishes to do so.
6.1 Website Marketing Strategy
Our website marketing strategy will focus on Vacationers & Hunters who are looking for a vacation or hunting destination that is both close and comfortabley homelike. The Weststate area will be our main focal point. The Lowland Heights Roadhouse will promote through our website by using:
- Detailed photos of the Roadhouse and surrounding area.
- Price list of our rooms and our restaurant menu.
6.2 Development Requirements
Gisli Njerdginsyn, along with Website Pros, Inc. will develop the website. The site itself is up now and it will be an ongoing effort to add new information to the site as we see necessary. Gisli has 25 years in computers and management and has experience working with websites. Every aspect of the site will be handled by Tory (owner) and Gisli including company logo, Web page format, and maintenance of the site. Website Pros will host the site.
Management Summary
The Lowland Heights Roadhouse will operate as an owner-occupied business. A small staff will be hired early next year consisting of a cook and maid along with a maintenance man. The rest of the tasks will be done by Tory and Gisli.
Gisli right now is responsible for the outside maintenance of the grounds and cleaning of the motel rooms, and website activities.
Tory will be the general manger, organize and decide on any management idea’s on the day-to-day operations on the inside. She will order product and food from the vendors, and both will handle reservations. Both Tory and Gisli will promote the Lowland Heights Roadhouse through the advertising methods discussed in the marketing strategy section. Tory will also do the cooking and bartendering.
7.1 Personnel Plan
The personnel needed for the Lowland Heights Roadhouse are the following:
- Manager
- Assistant manager
- Cook – to be hired in 2005
- Maintenance person – to be hired in 2005
- Cleaning person – to be hired in 2005
The Britts/Njerdginsyn family has outside income of $4,500 per month and will not be taking a salary for the first year of the business.
| Personnel Plan | |||
| Year 1 | Year 2 | Year 3 | |
| Manager | $0 | $45,000 | $48,000 |
| Assistant Manager | $0 | $39,000 | $42,000 |
| Cook | $1,200 | $39,000 | $42,000 |
| Maintenance Staff | $0 | $52,000 | $55,000 |
| Cleaning Staff | $1,200 | $76,000 | $79,000 |
| Total People | 5 | 10 | 10 |
| Total Payroll | $2,400 | $251,000 | $266,000 |
7.2 Management Information Systems
Tory Britts will be maintaining financial and accounting controls in its motel, restaurant and RV Park through the use of a sophisticated point-of-sale Royal cash register system and personal computer network using a computerized reservation system that is accessible for booking rooms on the Internet. The Royal and the personal computer network provides the Roadhouse management with daily and weekly information regarding sales, cash receipts, inventory, food and beverage costs, and other controllable operating expenses. We use Quickbooks for tracking and doing all our financial reports that are required to operate a business.
7.3 Key Management
Tory Britts is President and principal owner of Golden Cholla Enterprises LLC which owns and operates Lowland Heights Roadhouse. I am currently leasing the business starting on July 6, 2004 until financing is completed, we have shown a profit. There is no historical data from the previous owners to compare it to. They will not release their tax returns during their ownership of the business, however different vendors and customer’s have stated that we are selling four to five times the amount of alcohol that they did. Our restaurant has been increasing in sales every week from word of mouth and advertising/promotions.
Prior to buying the Lowland Heights Roadhouse, I owned and operated an Internet business (ZooperDooper Deals). I purchased truck loads of clearance or discontinued items and sold them on Ebay. ZooperDooper Deals was started in August of 2000, operated until June 2004, and was a very successful business. I have not continued with the business since we moved to Weststate.
Prior to that in 1997-2004 I was on contract with Family Care Providers in Otherstate.
Position: Behavior Management Specialist and Therapeutic Provider
Duties:
- Management of highest level of difficulty in juvenile clients
- Scheduling and heading up weekly case management meetings between clients and team members
- Determining and soliciting all special needs of clients involving specialists/psychiatric care/medications/treatment programs/school contacts
- Determining and implementing therapeutic interventions
- Attending court sessions and therapist meetings
- Maintaining daily and weekly records on clients medications/progress/appointments /school records/strength of bonds to family members/reactions to medications and therapies etc.
- Also cared for medically fragile infants on occasion: close monitoring and management of medication, specialist appointments, breathing machines, breathing treatments etc.
1990-1997 Ten-Galloon Saloon
Position: Shift Manager
Duties:
- Management of bartenders, cocktail waitresses, kitchen help and janitorial service
- Other duties included inventory, sales projections, promotions
- Hiring, mentoring employees
- Menu design, supply/vendor ordering, vendor contacts
- Locating and auditioning bands/entertainment, employee scheduling
- Ability to fill in for all positions when needed
- Liaison to the coin company and slot machine repair company, handled major payout/jackpots and accompanying IRS paperwork
- Involved in payroll
- Multitude of other duties needed in running a large bar, 25 slot machines, a bar kitchen, entertainment, advertising and employees.
Training:
- Certified in alcohol awareness
- Attended and passed food handling and safety course in Lost Wages
- Documented 80 hours per year in therapeutic management for the past 7 years
- Certified in infant child and adult CPR and First Aid
- Completed 2 online self directed small business courses to aid in my knowledge and abilities.
College:
- Attended 1-1/2 years at State College
- One year at Pleasantville Community College prenursing, chemistry, economics, accounting, business, anatomy & physiology.
All this past experience provides me with experience in leadership for management, developing operational and financial reports, implementing action plans to achieve those goals, and providing overall strategic direction to operate and manage and implement business goals for overall strategic direction for the business.
I plan on incorporating my past experiences into the operation of the Lowland Heights Roadhouse, becoming a very successful business in the Greenhorn Valley.
Financial Plan
The Lowland Heights Roadhouse expects business to grow steadily until we are at an average of over 60% capacity for the year 2004 with a conservative capacity rate of 50% expected at times. The year 2005 we expect business to grow steadily until we are at an average of over 90% capacity. We will be growing slowly with profits growing at a rate of about 10%. Expenses will be well managed, allowing Lowland Heights Roadhouse to make a profit even if the capacity rate drops as low as 50%.
8.1 Break-even Analysis
We estimate average monthly fixed costs shown below. Peak and off-season will have significant impact on the monthly earnings. For the first year, on-season revenues will offset off-season losses. As Lowland Heights Roadhouse builds its market position among the local patrons, we anticipate that off-season revenues will be enough to break even during that season. Further, a rate increase may be considered in Fiscal Year 2005.

| Break-even Analysis | |
| Monthly Revenue Break-even | $4,103 |
| Assumptions: | |
| Average Percent Variable Cost | 7% |
| Estimated Monthly Fixed Cost | $3,797 |
8.2 Projected Profit and Loss
Below is the Lowland Heights Roadhouse projected income statement for the next three years. As mentioned above, earnings are subject to seasonal fluctuations. The new owners will, however, strengthen the Lowland Heights Roadhouse’s market position among the local communities who will patronize the establishment during the low season, and thus offset the negative impact of the season.


| Pro Forma Profit and Loss | |||
| Year 1 | Year 2 | Year 3 | |
| Sales | $151,394 | $915,000 | $1,022,000 |
| Direct Cost of Sales | $11,271 | $34,850 | $44,150 |
| Other Production Expenses | $0 | $0 | $0 |
| Total Cost of Sales | $11,271 | $34,850 | $44,150 |
| Gross Margin | $140,123 | $880,150 | $977,850 |
| Gross Margin % | 92.56% | 96.19% | 95.68% |
| Expenses | |||
| Payroll | $2,400 | $251,000 | $266,000 |
| Sales and Marketing and Other Expenses | $1,160 | $80,000 | $100,000 |
| Depreciation | $14,280 | $14,280 | $14,280 |
| Leased Equipment | $0 | $0 | $0 |
| Utilities | $3,725 | $26,000 | $26,000 |
| Insurance | $2,700 | $24,000 | $24,000 |
| Lease | $7,300 | $0 | $0 |
| Mortgage Payment | $14,000 | $62,100 | $65,700 |
| Other | $0 | $0 | $0 |
| Total Operating Expenses | $45,565 | $457,380 | $495,980 |
| Profit Before Interest and Taxes | $94,558 | $422,770 | $481,870 |
| EBITDA | $108,838 | $437,050 | $496,150 |
| Interest Expense | $22,850 | $20,500 | $17,500 |
| Taxes Incurred | $21,512 | $120,681 | $139,311 |
| Net Profit | $50,195 | $281,589 | $325,059 |
| Net Profit/Sales | 33.16% | 30.77% | 31.81% |
8.3 Projected Cash Flow
The Cash Flow projections are outlined below. Again, these projections are based on our basic assumptions with revenue generation factors carrying the most significant weight regarding the outcome. We are anticipating that we will not need to invest any additional capital into the business with a healthy cash flow in place.

| Pro Forma Cash Flow | |||
| Year 1 | Year 2 | Year 3 | |
| Cash Received | |||
| Cash from Operations | |||
| Cash Sales | $151,394 | $915,000 | $1,022,000 |
| Subtotal Cash from Operations | $151,394 | $915,000 | $1,022,000 |
| Additional Cash Received | |||
| Sales Tax, VAT, HST/GST Received | $0 | $0 | $0 |
| New Current Borrowing | $0 | $0 | $0 |
| New Other Liabilities (interest-free) | $0 | $0 | $0 |
| New Long-term Liabilities | $0 | $0 | $0 |
| Sales of Other Current Assets | $0 | $0 | $0 |
| Sales of Long-term Assets | $0 | $0 | $0 |
| New Investment Received | $0 | $0 | $0 |
| Subtotal Cash Received | $151,394 | $915,000 | $1,022,000 |
| Expenditures | Year 1 | Year 2 | Year 3 |
| Expenditures from Operations | |||
| Cash Spending | $2,400 | $251,000 | $266,000 |
| Bill Payments | $78,949 | $347,991 | $413,786 |
| Subtotal Spent on Operations | $81,349 | $598,991 | $679,786 |
| Additional Cash Spent | |||
| Sales Tax, VAT, HST/GST Paid Out | $0 | $0 | $0 |
| Principal Repayment of Current Borrowing | $0 | $0 | $0 |
| Other Liabilities Principal Repayment | $0 | $0 | $0 |
| Long-term Liabilities Principal Repayment | $12,000 | $30,000 | $30,000 |
| Purchase Other Current Assets | $0 | $18,000 | $21,000 |
| Purchase Long-term Assets | $0 | $20,000 | $60,000 |
| Dividends | $0 | $0 | $0 |
| Subtotal Cash Spent | $93,349 | $666,991 | $790,786 |
| Net Cash Flow | $58,044 | $248,009 | $231,214 |
| Cash Balance | $281,627 | $529,636 | $760,850 |
8.4 Projected Balance Sheet
The following is a projected Balance Sheet showing sufficient growth and a very acceptable financial position.
| Pro Forma Balance Sheet | |||
| Year 1 | Year 2 | Year 3 | |
| Assets | |||
| Current Assets | |||
| Cash | $281,627 | $529,636 | $760,850 |
| Inventory | $1,199 | $3,707 | $4,697 |
| Other Current Assets | $9,827 | $27,827 | $48,827 |
| Total Current Assets | $292,653 | $561,170 | $814,373 |
| Long-term Assets | |||
| Long-term Assets | $15,206 | $35,206 | $95,206 |
| Accumulated Depreciation | $14,280 | $28,560 | $42,840 |
| Total Long-term Assets | $926 | $6,646 | $52,366 |
| Total Assets | $293,579 | $567,817 | $866,740 |
| Liabilities and Capital | Year 1 | Year 2 | Year 3 |
| Current Liabilities | |||
| Accounts Payable | $7,815 | $30,464 | $34,327 |
| Current Borrowing | $0 | $0 | $0 |
| Other Current Liabilities | $744 | $744 | $744 |
| Subtotal Current Liabilities | $8,559 | $31,207 | $35,071 |
| Long-term Liabilities | $220,000 | $190,000 | $160,000 |
| Total Liabilities | $228,559 | $221,207 | $195,071 |
| Paid-in Capital | $78,000 | $78,000 | $78,000 |
| Retained Earnings | ($63,175) | ($12,980) | $268,609 |
| Earnings | $50,195 | $281,589 | $325,059 |
| Total Capital | $65,020 | $346,609 | $671,668 |
| Total Liabilities and Capital | $293,579 | $567,817 | $866,740 |
| Net Worth | $65,020 | $346,609 | $671,668 |
8.5 Business Ratios
Business ratios for the years of this plan are shown below. Industry profile ratios based on the Standard Industrial Classification (SIC) code 7011, Hotels and Motels, are shown for comparison.
| Ratio Analysis | ||||
| Year 1 | Year 2 | Year 3 | Industry Profile | |
| Sales Growth | 0.00% | 504.38% | 11.69% | 0.21% |
| Percent of Total Assets | ||||
| Inventory | 0.41% | 0.65% | 0.54% | 1.31% |
| Other Current Assets | 3.35% | 4.90% | 5.63% | 28.59% |
| Total Current Assets | 99.68% | 98.83% | 93.96% | 33.99% |
| Long-term Assets | 0.32% | 1.17% | 6.04% | 66.01% |
| Total Assets | 100.00% | 100.00% | 100.00% | 100.00% |
| Current Liabilities | 2.92% | 5.50% | 4.05% | 10.26% |
| Long-term Liabilities | 74.94% | 33.46% | 18.46% | 25.87% |
| Total Liabilities | 77.85% | 38.96% | 22.51% | 36.13% |
| Net Worth | 22.15% | 61.04% | 77.49% | 63.87% |
| Percent of Sales | ||||
| Sales | 100.00% | 100.00% | 100.00% | 100.00% |
| Gross Margin | 92.56% | 96.19% | 95.68% | 100.00% |
| Selling, General & Administrative Expenses | 83.02% | 65.42% | 63.87% | 70.85% |
| Advertising Expenses | 39.63% | 8.74% | 9.78% | 1.66% |
| Profit Before Interest and Taxes | 62.46% | 46.20% | 47.15% | 1.26% |
| Main Ratios | ||||
| Current | 34.19 | 17.98 | 23.22 | 1.68 |
| Quick | 34.05 | 17.86 | 23.09 | 1.29 |
| Total Debt to Total Assets | 77.85% | 38.96% | 22.51% | 50.04% |
| Pre-tax Return on Net Worth | 110.28% | 116.06% | 69.14% | 0.88% |
| Pre-tax Return on Assets | 24.43% | 70.85% | 53.58% | 1.76% |
| Additional Ratios | Year 1 | Year 2 | Year 3 | |
| Net Profit Margin | 33.16% | 30.77% | 31.81% | n.a |
| Return on Equity | 77.20% | 81.24% | 48.40% | n.a |
| Activity Ratios | ||||
| Inventory Turnover | 7.85 | 14.21 | 10.51 | n.a |
| Accounts Payable Turnover | 10.97 | 12.17 | 12.17 | n.a |
| Payment Days | 27 | 19 | 28 | n.a |
| Total Asset Turnover | 0.52 | 1.61 | 1.18 | n.a |
| Debt Ratios | ||||
| Debt to Net Worth | 3.52 | 0.64 | 0.29 | n.a |
| Current Liab. to Liab. | 0.04 | 0.14 | 0.18 | n.a |
| Liquidity Ratios | ||||
| Net Working Capital | $284,094 | $529,963 | $779,302 | n.a |
| Interest Coverage | 4.14 | 20.62 | 27.54 | n.a |
| Additional Ratios | ||||
| Assets to Sales | 1.94 | 0.62 | 0.85 | n.a |
| Current Debt/Total Assets | 3% | 5% | 4% | n.a |
| Acid Test | 34.05 | 17.86 | 23.09 | n.a |
| Sales/Net Worth | 2.33 | 2.64 | 1.52 | n.a |
| Dividend Payout | 0.00 | 0.00 | 0.00 | n.a |
Appendix
| Sales Forecast | |||||||||||||
| Month 1 | Month 2 | Month 3 | Month 4 | Month 5 | Month 6 | Month 7 | Month 8 | Month 9 | Month 10 | Month 11 | Month 12 | ||
| Sales | |||||||||||||
| Rooms | 0% | $2,042 | $3,354 | $4,682 | $16,500 | $8,250 | $3,245 | $2,565 | $2,650 | $2,650 | $3,850 | $4,200 | $4,850 |
| Food | 0% | $278 | $838 | $1,540 | $5,350 | $4,950 | $2,850 | $2,850 | $2,850 | $3,150 | $3,250 | $3,250 | $5,400 |
| RV Park | 0% | $163 | $142 | $492 | $3,250 | $2,250 | $1,675 | $850 | $500 | $300 | $175 | $100 | $250 |
| Bar | 0% | $3,501 | $2,849 | $2,808 | $6,250 | $5,245 | $3,450 | $3,400 | $3,400 | $3,400 | $3,400 | $3,400 | $4,750 |
| Total Sales | $5,984 | $7,183 | $9,522 | $31,350 | $20,695 | $11,220 | $9,665 | $9,400 | $9,500 | $10,675 | $10,950 | $15,250 | |
| Direct Cost of Sales | Month 1 | Month 2 | Month 3 | Month 4 | Month 5 | Month 6 | Month 7 | Month 8 | Month 9 | Month 10 | Month 11 | Month 12 | |
| Rooms | $25 | $25 | $25 | $25 | $25 | $25 | $25 | $25 | $25 | $25 | $25 | $25 | |
| Food | $75 | $65 | $125 | $1,050 | $900 | $625 | $625 | $625 | $675 | $675 | $675 | $750 | |
| RV Park | $15 | $15 | $15 | $15 | $15 | $15 | $15 | $15 | $15 | $15 | $15 | $15 | |
| Bar | $1,250 | $150 | $175 | $476 | $375 | $200 | $200 | $200 | $200 | $200 | $200 | $300 | |
| Subtotal Direct Cost of Sales | $1,365 | $255 | $340 | $1,566 | $1,315 | $865 | $865 | $865 | $915 | $915 | $915 | $1,090 | |
| Personnel Plan | |||||||||||||
| Month 1 | Month 2 | Month 3 | Month 4 | Month 5 | Month 6 | Month 7 | Month 8 | Month 9 | Month 10 | Month 11 | Month 12 | ||
| Manager | 0% | $0 | $0 | $0 | $0 | $0 | $0 | $0 | $0 | $0 | $0 | $0 | $0 |
| Assistant Manager | 0% | $0 | $0 | $0 | $0 | $0 | $0 | $0 | $0 | $0 | $0 | $0 | $0 |
| Cook | 0% | $0 | $0 | $0 | $0 | $0 | $0 | $0 | $0 | $300 | $300 | $300 | $300 |
| Maintenance Staff | 0% | $0 | $0 | $0 | $0 | $0 | $0 | $0 | $0 | $0 | $0 | $0 | $0 |
| Cleaning Staff | 0% | $0 | $0 | $0 | $0 | $0 | $0 | $0 | $0 | $300 | $300 | $300 | $300 |
| Total People | 2 | 2 | 2 | 2 | 2 | 2 | 2 | 2 | 5 | 5 | 50 | 5 | |
| Total Payroll | $0 | $0 | $0 | $0 | $0 | $0 | $0 | $0 | $600 | $600 | $600 | $600 | |
| Pro Forma Profit and Loss | |||||||||||||
| Month 1 | Month 2 | Month 3 | Month 4 | Month 5 | Month 6 | Month 7 | Month 8 | Month 9 | Month 10 | Month 11 | Month 12 | ||
| Sales | $5,984 | $7,183 | $9,522 | $31,350 | $20,695 | $11,220 | $9,665 | $9,400 | $9,500 | $10,675 | $10,950 | $15,250 | |
| Direct Cost of Sales | $1,365 | $255 | $340 | $1,566 | $1,315 | $865 | $865 | $865 | $915 | $915 | $915 | $1,090 | |
| Other Production Expenses | $0 | $0 | $0 | $0 | $0 | $0 | $0 | $0 | $0 | $0 | $0 | $0 | |
| Total Cost of Sales | $1,365 | $255 | $340 | $1,566 | $1,315 | $865 | $865 | $865 | $915 | $915 | $915 | $1,090 | |
| Gross Margin | $4,619 | $6,928 | $9,182 | $29,784 | $19,380 | $10,355 | $8,800 | $8,535 | $8,585 | $9,760 | $10,035 | $14,160 | |
| Gross Margin % | 77.19% | 96.45% | 96.43% | 95.00% | 93.65% | 92.29% | 91.05% | 90.80% | 90.37% | 91.43% | 91.64% | 92.85% | |
| Expenses | |||||||||||||
| Payroll | $0 | $0 | $0 | $0 | $0 | $0 | $0 | $0 | $600 | $600 | $600 | $600 | |
| Sales and Marketing and Other Expenses | $0 | $0 | $0 | $210 | $85 | $100 | $100 | $100 | $125 | $145 | $145 | $150 | |
| Depreciation | $1,190 | $1,190 | $1,190 | $1,190 | $1,190 | $1,190 | $1,190 | $1,190 | $1,190 | $1,190 | $1,190 | $1,190 | |
| Leased Equipment | $0 | $0 | $0 | $0 | $0 | $0 | $0 | $0 | $0 | $0 | $0 | $0 | |
| Utilities | $187 | $168 | $410 | $260 | $250 | $350 | $350 | $350 | $350 | $350 | $350 | $350 | |
| Insurance | $225 | $225 | $225 | $225 | $225 | $225 | $225 | $225 | $225 | $225 | $225 | $225 | |
| Lease | $1,300 | $1,500 | $1,500 | $1,500 | $1,500 | $0 | $0 | $0 | $0 | $0 | $0 | $0 | |
| Mortgage Payment | 15% | $0 | $0 | $0 | $0 | $0 | $2,000 | $2,000 | $2,000 | $2,000 | $2,000 | $2,000 | $2,000 |
| Other | $0 | $0 | $0 | $0 | $0 | $0 | $0 | $0 | $0 | $0 | $0 | $0 | |
| Total Operating Expenses | $2,902 | $3,083 | $3,325 | $3,385 | $3,250 | $3,865 | $3,865 | $3,865 | $4,490 | $4,510 | $4,510 | $4,515 | |
| Profit Before Interest and Taxes | $1,717 | $3,845 | $5,857 | $26,399 | $16,130 | $6,490 | $4,935 | $4,670 | $4,095 | $5,250 | $5,525 | $9,645 | |
| EBITDA | $2,907 | $5,035 | $7,047 | $27,589 | $17,320 | $7,680 | $6,125 | $5,860 | $5,285 | $6,440 | $6,715 | $10,835 | |
| Interest Expense | $1,933 | $1,933 | $1,933 | $1,933 | $1,933 | $1,933 | $1,917 | $1,900 | $1,883 | $1,867 | $1,850 | $1,833 | |
| Taxes Incurred | ($65) | $574 | $1,177 | $7,340 | $4,259 | $1,367 | $905 | $831 | $664 | $1,015 | $1,103 | $2,344 | |
| Net Profit | ($152) | $1,338 | $2,746 | $17,126 | $9,938 | $3,190 | $2,113 | $1,939 | $1,548 | $2,368 | $2,573 | $5,468 | |
| Net Profit/Sales | -2.53% | 18.63% | 28.84% | 54.63% | 48.02% | 28.43% | 21.86% | 20.63% | 16.30% | 22.19% | 23.49% | 35.86% | |
| Pro Forma Cash Flow | |||||||||||||
| Month 1 | Month 2 | Month 3 | Month 4 | Month 5 | Month 6 | Month 7 | Month 8 | Month 9 | Month 10 | Month 11 | Month 12 | ||
| Cash Received | |||||||||||||
| Cash from Operations | |||||||||||||
| Cash Sales | $5,984 | $7,183 | $9,522 | $31,350 | $20,695 | $11,220 | $9,665 | $9,400 | $9,500 | $10,675 | $10,950 | $15,250 | |
| Subtotal Cash from Operations | $5,984 | $7,183 | $9,522 | $31,350 | $20,695 | $11,220 | $9,665 | $9,400 | $9,500 | $10,675 | $10,950 | $15,250 | |
| Additional Cash Received | |||||||||||||
| Sales Tax, VAT, HST/GST Received | 0.00% | $0 | $0 | $0 | $0 | $0 | $0 | $0 | $0 | $0 | $0 | $0 | $0 |
| New Current Borrowing | $0 | $0 | $0 | $0 | $0 | $0 | $0 | $0 | $0 | $0 | $0 | $0 | |
| New Other Liabilities (interest-free) | $0 | $0 | $0 | $0 | $0 | $0 | $0 | $0 | $0 | $0 | $0 | $0 | |
| New Long-term Liabilities | $0 | $0 | $0 | $0 | $0 | $0 | $0 | $0 | $0 | $0 | $0 | $0 | |
| Sales of Other Current Assets | $0 | $0 | $0 | $0 | $0 | $0 | $0 | $0 | $0 | $0 | $0 | $0 | |
| Sales of Long-term Assets | $0 | $0 | $0 | $0 | $0 | $0 | $0 | $0 | $0 | $0 | $0 | $0 | |
| New Investment Received | $0 | $0 | $0 | $0 | $0 | $0 | $0 | $0 | $0 | $0 | $0 | $0 | |
| Subtotal Cash Received | $5,984 | $7,183 | $9,522 | $31,350 | $20,695 | $11,220 | $9,665 | $9,400 | $9,500 | $10,675 | $10,950 | $15,250 | |
| Expenditures | Month 1 | Month 2 | Month 3 | Month 4 | Month 5 | Month 6 | Month 7 | Month 8 | Month 9 | Month 10 | Month 11 | Month 12 | |
| Expenditures from Operations | |||||||||||||
| Cash Spending | $0 | $0 | $0 | $0 | $0 | $0 | $0 | $0 | $600 | $600 | $600 | $600 | |
| Bill Payments | $1,262 | $6,379 | $4,428 | $5,532 | $13,698 | $9,214 | $6,959 | $6,494 | $6,401 | $6,225 | $5,637 | $6,720 | |
| Subtotal Spent on Operations | $1,262 | $6,379 | $4,428 | $5,532 | $13,698 | $9,214 | $6,959 | $6,494 | $7,001 | $6,825 | $6,237 | $7,320 | |
| Additional Cash Spent | |||||||||||||
| Sales Tax, VAT, HST/GST Paid Out | $0 | $0 | $0 | $0 | $0 | $0 | $0 | $0 | $0 | $0 | $0 | $0 | |
| Principal Repayment of Current Borrowing | $0 | $0 | $0 | $0 | $0 | $0 | $0 | $0 | $0 | $0 | $0 | $0 | |
| Other Liabilities Principal Repayment | $0 | $0 | $0 | $0 | $0 | $0 | $0 | $0 | $0 | $0 | $0 | $0 | |
| Long-term Liabilities Principal Repayment | $0 | $0 | $0 | $0 | $0 | $0 | $2,000 | $2,000 | $2,000 | $2,000 | $2,000 | $2,000 | |
| Purchase Other Current Assets | $0 | $0 | $0 | $0 | $0 | $0 | $0 | $0 | $0 | $0 | $0 | $0 | |
| Purchase Long-term Assets | $0 | $0 | $0 | $0 | $0 | $0 | $0 | $0 | $0 | $0 | $0 | $0 | |
| Dividends | $0 | $0 | $0 | $0 | $0 | $0 | $0 | $0 | $0 | $0 | $0 | $0 | |
| Subtotal Cash Spent | $1,262 | $6,379 | $4,428 | $5,532 | $13,698 | $9,214 | $8,959 | $8,494 | $9,001 | $8,825 | $8,237 | $9,320 | |
| Net Cash Flow | $4,722 | $805 | $5,093 | $25,818 | $6,997 | $2,006 | $706 | $906 | $499 | $1,850 | $2,713 | $5,930 | |
| Cash Balance | $228,304 | $229,109 | $234,203 | $260,020 | $267,017 | $269,023 | $269,729 | $270,635 | $271,134 | $272,984 | $275,696 | $281,627 | |
| Pro Forma Balance Sheet | |||||||||||||
| Month 1 | Month 2 | Month 3 | Month 4 | Month 5 | Month 6 | Month 7 | Month 8 | Month 9 | Month 10 | Month 11 | Month 12 | ||
| Assets | Starting Balances | ||||||||||||
| Current Assets | |||||||||||||
| Cash | $223,582 | $228,304 | $229,109 | $234,203 | $260,020 | $267,017 | $269,023 | $269,729 | $270,635 | $271,134 | $272,984 | $275,696 | $281,627 |
| Inventory | $0 | $1,502 | $1,247 | $907 | $1,723 | $1,447 | $1,582 | $1,717 | $1,852 | $1,937 | $1,022 | $1,107 | $1,199 |
| Other Current Assets | $9,827 | $9,827 | $9,827 | $9,827 | $9,827 | $9,827 | $9,827 | $9,827 | $9,827 | $9,827 | $9,827 | $9,827 | $9,827 |
| Total Current Assets | $233,409 | $239,633 | $240,183 | $244,936 | $271,570 | $278,291 | $280,432 | $281,272 | $282,313 | $282,897 | $283,832 | $286,630 | $292,653 |
| Long-term Assets | |||||||||||||
| Long-term Assets | $15,206 | $15,206 | $15,206 | $15,206 | $15,206 | $15,206 | $15,206 | $15,206 | $15,206 | $15,206 | $15,206 | $15,206 | $15,206 |
| Accumulated Depreciation | $0 | $1,190 | $2,380 | $3,570 | $4,760 | $5,950 | $7,140 | $8,330 | $9,520 | $10,710 | $11,900 | $13,090 | $14,280 |
| Total Long-term Assets | $15,206 | $14,016 | $12,826 | $11,636 | $10,446 | $9,256 | $8,066 | $6,876 | $5,686 | $4,496 | $3,306 | $2,116 | $926 |
| Total Assets | $248,616 | $253,649 | $253,009 | $256,572 | $282,016 | $287,547 | $288,498 | $288,149 | $288,000 | $287,394 | $287,139 | $288,746 | $293,579 |
| Liabilities and Capital | Month 1 | Month 2 | Month 3 | Month 4 | Month 5 | Month 6 | Month 7 | Month 8 | Month 9 | Month 10 | Month 11 | Month 12 | |
| Current Liabilities | |||||||||||||
| Accounts Payable | $1,047 | $6,232 | $4,253 | $5,070 | $13,388 | $8,982 | $6,743 | $6,281 | $6,192 | $6,039 | $5,415 | $6,450 | $7,815 |
| Current Borrowing | $0 | $0 | $0 | $0 | $0 | $0 | $0 | $0 | $0 | $0 | $0 | $0 | $0 |
| Other Current Liabilities | $744 | $744 | $744 | $744 | $744 | $744 | $744 | $744 | $744 | $744 | $744 | $744 | $744 |
| Subtotal Current Liabilities | $1,791 | $6,976 | $4,997 | $5,814 | $14,132 | $9,725 | $7,487 | $7,024 | $6,936 | $6,782 | $6,159 | $7,194 | $8,559 |
| Long-term Liabilities | $232,000 | $232,000 | $232,000 | $232,000 | $232,000 | $232,000 | $232,000 | $230,000 | $228,000 | $226,000 | $224,000 | $222,000 | $220,000 |
| Total Liabilities | $233,791 | $238,976 | $236,997 | $237,814 | $246,132 | $241,725 | $239,487 | $237,024 | $234,936 | $232,782 | $230,159 | $229,194 | $228,559 |
| Paid-in Capital | $78,000 | $78,000 | $78,000 | $78,000 | $78,000 | $78,000 | $78,000 | $78,000 | $78,000 | $78,000 | $78,000 | $78,000 | $78,000 |
| Retained Earnings | ($63,175) | ($63,175) | ($63,175) | ($63,175) | ($63,175) | ($63,175) | ($63,175) | ($63,175) | ($63,175) | ($63,175) | ($63,175) | ($63,175) | ($63,175) |
| Earnings | $0 | ($152) | $1,187 | $3,933 | $21,059 | $30,997 | $34,186 | $36,299 | $38,238 | $39,786 | $42,155 | $44,727 | $50,195 |
| Total Capital | $14,825 | $14,673 | $16,012 | $18,758 | $35,884 | $45,822 | $49,011 | $51,124 | $53,063 | $54,611 | $56,980 | $59,552 | $65,020 |
| Total Liabilities and Capital | $248,616 | $253,649 | $253,009 | $256,572 | $282,016 | $287,547 | $288,498 | $288,149 | $288,000 | $287,394 | $287,139 | $288,746 | $293,579 |
| Net Worth | $14,825 | $14,673 | $16,012 | $18,758 | $35,884 | $45,822 | $49,011 | $51,124 | $53,063 | $54,611 | $56,980 | $59,552 | $65,020 |

