
University Mopeds
Executive Summary
There is a possibility for an exciting and profitable new business in Eugene, Oregon. University Mopeds will to rent mopeds to University of Oregon students, as well as anyone who would have a need for efficient, around-town transportation. There is currently no business like this, in Eugene, which caters to this market.
For slightly more than the cost of a monthly cellular phone bill, it is possible for a student to have their own mode of transportation during the school year. Mopeds have many positive advantages over cars: lower operating costs, fuel efficiency, and are less costly to maintain. It is also possible to insure these vehicles for around $30-$50 per year.
The target market for this business would be the approximately 15,000 full-time students. There are also thousands of students who are commuting daily from the Autzen Field area. Parking on campus is hard to find, and the bus offers few options. This is where the economical moped comes into play.
Many students do not have the disposable income that it takes to purchase a moped, but they are in a position to pay $50 per month to rent one. University Mopeds would purchase used mopeds for $400-$700 and lease them out. The average moped would be paid off in under one year.
In year one, University Moped would attempt to get 1% of all full-time students. This would equate to 150 mopeds rented. We expect the five year growth rate to be at least 15%.
Assuming an average purchase price of $550, and a ten month rental contract at $50 per month, it is possible for University Mopeds to be profitable in year two.
1.1 Objectives
- Rent 150 units in year one.
- University Mopeds will be fully self-sufficient and profitable by year three.
- Rent at least 199 units by year three and 263 units by year five (15% annual growth rate).
1.2 Mission
University Mopeds will service the student first. At University Mopeds, clients will be able to rent a quality means of transportation at a fair price. University Mopeds will also be a profitable business which will treat employees fairly and provide financially for its owners.
1.3 Keys to Success
- Good customer service and value.
- Affordable rental prices.
- Reaching the target market.
- Integrity in serving our customers; resulting in repeat purchases.
Company Summary
University Mopeds will rent mopeds to University of Oregon students, as well as others who would have a need. There is currently no business like this, in Eugene, which caters to this market. For slightly more than the cost of a monthly cellular phone bill, it is possible for a student to have their own mode of transportation that is fairly inexpensive. The target market for this business would be the approximately 15,000 full-time U of O students.
There are thousands of students who are commuting daily from the Autzen Field area. Parking on campus is hard to find, and the bus offers few options. This is where the economical moped comes into play. Many students do not have the disposable income that it takes to purchase a moped, but they are in a position to pay $50 per month to rent. Assuming an average purchase price of $550, and a ten month rental at $50 per month, it is possible for University Mopeds to be profitable in year two.
2.1 Start-up Summary
This company will be funded by Matthew Cavanaugh. The majority of the funding will come from private savings and local investors, plus loans backed by starting assets. The cost of the start-up, including inventory, legal expenses, and advertising, will total $100,000. We anticipate that this company will start generating immediate cash flow.

| Start-up | |
| Requirements | |
| Start-up Expenses | |
| Legal | $500 |
| Stationery etc. | $150 |
| Brochures | $0 |
| Consultants | $0 |
| Insurance | $500 |
| Rent | $1,000 |
| Research and development | $750 |
| Expensed equipment | $1,500 |
| Other | $0 |
| Total Start-up Expenses | $4,400 |
| Start-up Assets | |
| Cash Required | $33,100 |
| Start-up Inventory | $82,500 |
| Other Current Assets | $50,000 |
| Long-term Assets | $300,000 |
| Total Assets | $465,600 |
| Total Requirements | $470,000 |
| Start-up Funding | |
| Start-up Expenses to Fund | $4,400 |
| Start-up Assets to Fund | $465,600 |
| Total Funding Required | $470,000 |
| Assets | |
| Non-cash Assets from Start-up | $432,500 |
| Cash Requirements from Start-up | $33,100 |
| Additional Cash Raised | $0 |
| Cash Balance on Starting Date | $33,100 |
| Total Assets | $465,600 |
| Liabilities and Capital | |
| Liabilities | |
| Current Borrowing | $40,000 |
| Long-term Liabilities | $300,000 |
| Accounts Payable (Outstanding Bills) | $0 |
| Other Current Liabilities (interest-free) | $0 |
| Total Liabilities | $340,000 |
| Capital | |
| Planned Investment | |
| Investor 1 | $100,000 |
| Investor 2 | $10,000 |
| Other | $20,000 |
| Additional Investment Requirement | $0 |
| Total Planned Investment | $130,000 |
| Loss at Start-up (Start-up Expenses) | ($4,400) |
| Total Capital | $125,600 |
| Total Capital and Liabilities | $465,600 |
| Total Funding | $470,000 |
2.2 Company Ownership
The official name of this company will be University Mopeds, Incorporated. It will be an S corporation. The reason that the company will incorporate will be for tax advantages and to decrease liability.
2.3 Company Locations and Facilities
The company will be located in Eugene, Oregon. This location is ideal because of the need for inexpensive transportation by the large student population. If University Mopeds is successful, which we believe that it will be, other locations will be opened at various other university towns.
Services
The main service that this company will provide will be to rent mopeds on a monthly basis. In addition to this, the company’s secondary services will include such things as moped safety classes and accessories.
3.1 Competitive Comparison
There are currently no other competitors in this market. The only competition that University Mopeds expects will be from public transportation and automobiles. This is a separate segment and does not offer the freedom and price flexibility that University Mopeds offers.
3.2 Sales Literature
The only sales literature that University Mopeds will distribute will be via newspaper publications. We have no plans for a direct mailing plan, although one is possible in the future.
3.3 Future Services
It is possible for University Mopeds to expand into the electric vehicle market in the future if it becomes a feasible transportation alternative. We believe that this will be positive for us because we already will have an established customer base who is interested in low cost or environment friendly transportation alternatives.
Market Analysis Summary
We see this market as mainly made up of university students. Since a majority live close to the campus (within five miles) and have a limited budget, this will be a good option for them. We also anticipate getting a small amount of customers that are outside of the university community. These customers would be ones who typically have a shorter commute or want a change of pace.
4.1 Market Segmentation
The following chart and table show the market analysis figures for University Mopeds.

| Market Analysis | |||||||
| Year 1 | Year 2 | Year 3 | Year 4 | Year 5 | |||
| Potential Customers | Growth | CAGR | |||||
| University of Oregon Students | 10% | 135 | 149 | 164 | 180 | 198 | 10.05% |
| University Professors and Faculty | 10% | 10 | 11 | 12 | 13 | 14 | 8.78% |
| Lane County Residents | 2% | 10 | 10 | 10 | 10 | 10 | 0.00% |
| Total | 9.40% | 155 | 170 | 186 | 203 | 222 | 9.40% |
4.2 Market Growth
We anticipate that this market will grow in two ways. First, it will grow will be as gas prices continue to increase. This will make the cost of driving an automobile even more expensive and University Mopeds a more attractive option. Second, it will grow with the University. As the number of students increases, so will the target market and the number of students who are interested in our product.
Strategy and Implementation Summary
The following sections will outline the Strategy and Implementation plan for University Mopeds.
5.1 Marketing Strategy
The main marketing strategy that we will pursue will be to make potential customers aware of us via campus publications. We will advertise in such things as the Daily Emerald, Register-Guard, UO Student phonebook and the Greek directory.

5.1.1 Distribution Strategy
The method of distribution for this business would be to rent mopeds directly out of the shop. As far as getting the mopeds to Eugene, the main method would be to use a freight shipper such as UPS.
5.1.2 Marketing Programs
In order for University Mopeds to reach both the three and five year goals, one of the things that must happen is to get the idea of a moped as an acceptable means of transportation accepted. People must see others on mopeds around campus as well as the presence of advertising.
5.1.3 Pricing Strategy
We will price our products at a level that is affordable for the student and that provides financial substinence for the company and its owners. The mopeds will be priced at a rate of $50.00 per month. A discount will be offered to those who sign up for a school year lease (10 months). The accessories will be offered above cost, but at a reasonable level.
5.1.4 Promotion Strategy
This business will be successful only if the target market knows about University Mopeds and how affordable a moped rental can be. University Mopeds will advertise in the Daily Emerald. Another good source of advertising, which is also relatively inexpensive, would be in the Greek Directory. We would also try, at some point, some promotions such as free moped rental contests and free safety courses.
5.2 Sales Strategy
Since the main part of the business will come from customers ready to rent, there will not have to be much direct selling. We will use knowledgeable sales people to assist any customers who have doubts regarding renting a moped. The sales staff will know the benefits of the moped and explain this to the potential customer. Some customers will worry about the safety and whether or not they can ride a moped with no experience. We will service this customer with safety and instructional classes.
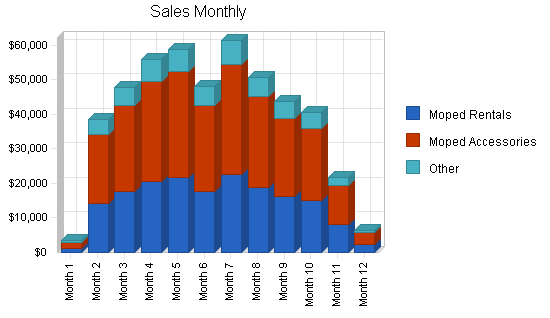
5.2.1 Sales Forecast
We predict that there will be variation in monthly sales forecasts, but we expect to reach 450 units in the first school year of operation. The variation will be due to lower sales when school is out of session.
| Sales Forecast | |||
| Year 1 | Year 2 | Year 3 | |
| Unit Sales | |||
| Moped Rentals | 3,533 | 4,500 | 5,000 |
| Moped Accessories | 7,066 | 9,000 | 10,000 |
| Other | 10,599 | 13,500 | 15,000 |
| Total Unit Sales | 21,198 | 27,000 | 30,000 |
| Unit Prices | Year 1 | Year 2 | Year 3 |
| Moped Rentals | $50.00 | $50.00 | $50.00 |
| Moped Accessories | $35.00 | $35.00 | $35.00 |
| Other | $5.00 | $5.00 | $5.00 |
| Sales | |||
| Moped Rentals | $176,650 | $225,000 | $250,000 |
| Moped Accessories | $247,310 | $315,000 | $350,000 |
| Other | $52,995 | $67,500 | $75,000 |
| Total Sales | $476,955 | $607,500 | $675,000 |
| Direct Unit Costs | Year 1 | Year 2 | Year 3 |
| Moped Rentals | $5.00 | $10.00 | $11.00 |
| Moped Accessories | $11.00 | $25.00 | $25.00 |
| Other | $2.00 | $2.00 | $2.00 |
| Direct Cost of Sales | |||
| Moped Rentals | $17,665 | $45,000 | $55,000 |
| Moped Accessories | $77,726 | $225,000 | $250,000 |
| Other | $21,198 | $27,000 | $30,000 |
| Subtotal Direct Cost of Sales | $116,589 | $297,000 | $335,000 |
5.3 Milestones
In order for University Mopeds to be successful, we must have attainable goals for the business. When looking to the future and for growing the business, we can look at these goals and milestones as an indicator of where the company has been, is going, and the path that it is taking. They can guide the future of the business. These are detailed in the Milestones section.
| Milestones | |||||
| Milestone | Start Date | End Date | Budget | Manager | Department |
| Open Shop For Business | 7/1/2001 | 7/1/2000 | $1,500 | M. Cavanaugh | Management |
| Rent first moped | 8/1/2001 | 8/1/2001 | $50 | Owner | Management |
| Average 150 units per month | 6/15/2002 | 6/15/2002 | $0 | Sales Staff | Sales |
| Be debt free | 7/1/2004 | 7/1/2004 | $87,500 | M. Cavanaugh | Management |
| Totals | $89,050 | ||||
Management Summary
As this is a small business, there will be no real management structure except for the owner. He will run the business on a daily basis and oversee all facets of the operation. Assisting him will be various employees who will work the shop. An on-duty mechanic will also be on duty some 20 hours per week.
6.1 Personnel Plan
Our personnel assumptions are based on a shop employee working 40 hours per week at $7.00 per hour. The mechanic will work approximately 20 hours per week at $15.00 per hour. As the number of moped rentals increases, the mechanics weekly hours will increase. The owner will also fill in and oversee the business. The owner salaries with not be drawn until the business is profitable and all investments have been paid back in full.
| Personnel Plan | |||
| Year 1 | Year 2 | Year 3 | |
| Shop Help | $24,000 | $26,400 | $29,040 |
| Mechanics | $18,000 | $19,800 | $21,780 |
| Management | $30,000 | $33,000 | $36,300 |
| Other | $3,000 | $3,300 | $3,630 |
| Total People | 4 | 4 | 5 |
| Total Payroll | $75,000 | $82,500 | $90,750 |
Financial Plan
All of the monies necessary for the start-up of this business will come from the owners. It will be entirely self-financed. The owners will not draw a salary, but will receive payments for their investments as University Mopeds generates cash flow.
7.1 Important Assumptions
The following table outlines the general assumptions for University Mopeds.
| General Assumptions | |||
| Year 1 | Year 2 | Year 3 | |
| Plan Month | 1 | 2 | 3 |
| Current Interest Rate | 10.00% | 10.00% | 10.00% |
| Long-term Interest Rate | 8.50% | 8.50% | 8.50% |
| Tax Rate | 30.00% | 30.00% | 30.00% |
| Other | 0 | 0 | 0 |
7.2 Key Financial Indicators
The following chart gives the benchmarks planned for University Mopeds.

7.3 Break-even Analysis
The following chart and table outline the Break-even Analysis.

| Break-even Analysis | |
| Monthly Units Break-even | 1,053 |
| Monthly Revenue Break-even | $23,686 |
| Assumptions: | |
| Average Per-Unit Revenue | $22.50 |
| Average Per-Unit Variable Cost | $5.50 |
| Estimated Monthly Fixed Cost | $17,896 |
7.4 Projected Profit and Loss
The following table shows the projected Profit and Loss.
| Pro Forma Profit and Loss | |||
| Year 1 | Year 2 | Year 3 | |
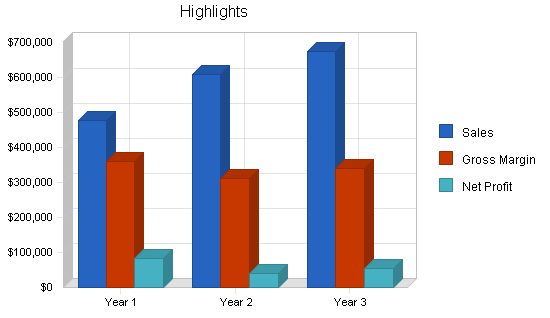
| Sales | $476,955 | $607,500 | $675,000 |
| Direct Cost of Sales | $116,589 | $297,000 | $335,000 |
| Other | $0 | $0 | $0 |
| Total Cost of Sales | $116,589 | $297,000 | $335,000 |
| Gross Margin | $360,366 | $310,500 | $340,000 |
| Gross Margin % | 75.56% | 51.11% | 50.37% |
| Expenses | |||
| Payroll | $75,000 | $82,500 | $90,750 |
| Sales and Marketing and Other Expenses | $900 | $1,100 | $1,300 |
| Depreciation | $100,000 | $100,000 | $100,000 |
| Leased Equipment | $600 | $600 | $600 |
| Utilities | $600 | $650 | $700 |
| Insurance | $2,400 | $2,800 | $3,200 |
| Rent | $24,000 | $28,000 | $30,000 |
| Payroll Taxes | $11,250 | $12,375 | $13,613 |
| Other | $0 | $0 | $0 |
| Total Operating Expenses | $214,750 | $228,025 | $240,163 |
| Profit Before Interest and Taxes | $145,616 | $82,475 | $99,838 |
| EBITDA | $245,616 | $182,475 | $199,838 |
| Interest Expense | $28,596 | $24,876 | $21,011 |
| Taxes Incurred | $35,106 | $17,280 | $23,648 |
| Net Profit | $81,914 | $40,319 | $55,178 |
| Net Profit/Sales | 17.17% | 6.64% | 8.17% |
7.5 Projected Cash Flow
The following chart and table are the projected Cash Flow.

| Pro Forma Cash Flow | |||
| Year 1 | Year 2 | Year 3 | |
| Cash Received | |||
| Cash from Operations | |||
| Cash Sales | $476,955 | $607,500 | $675,000 |
| Subtotal Cash from Operations | $476,955 | $607,500 | $675,000 |
| Additional Cash Received | |||
| Sales Tax, VAT, HST/GST Received | $0 | $0 | $0 |
| New Current Borrowing | $0 | $0 | $0 |
| New Other Liabilities (interest-free) | $0 | $0 | $0 |
| New Long-term Liabilities | $0 | $0 | $0 |
| Sales of Other Current Assets | $0 | $0 | $0 |
| Sales of Long-term Assets | $0 | $0 | $0 |
| New Investment Received | $0 | $0 | $0 |
| Subtotal Cash Received | $476,955 | $607,500 | $675,000 |
| Expenditures | Year 1 | Year 2 | Year 3 |
| Expenditures from Operations | |||
| Cash Spending | $75,000 | $82,500 | $90,750 |
| Bill Payments | $142,534 | $360,154 | $427,552 |
| Subtotal Spent on Operations | $217,534 | $442,654 | $518,302 |
| Additional Cash Spent | |||
| Sales Tax, VAT, HST/GST Paid Out | $0 | $0 | $0 |
| Principal Repayment of Current Borrowing | $0 | $40,000 | $0 |
| Other Liabilities Principal Repayment | $0 | $0 | $0 |
| Long-term Liabilities Principal Repayment | $19,898 | $21,941 | $21,941 |
| Purchase Other Current Assets | $0 | $0 | $0 |
| Purchase Long-term Assets | $0 | $100,000 | $100,000 |
| Dividends | $0 | $0 | $0 |
| Subtotal Cash Spent | $237,432 | $604,596 | $640,243 |
| Net Cash Flow | $239,523 | $2,904 | $34,757 |
| Cash Balance | $272,623 | $275,527 | $310,285 |
7.6 Projected Balance Sheet
The Balance Sheet table follows.
| Pro Forma Balance Sheet | |||
| Year 1 | Year 2 | Year 3 | |
| Assets | |||
| Current Assets | |||
| Cash | $272,623 | $275,527 | $310,285 |
| Inventory | $4,993 | $12,719 | $14,347 |
| Other Current Assets | $50,000 | $50,000 | $50,000 |
| Total Current Assets | $327,616 | $338,247 | $374,631 |
| Long-term Assets | |||
| Long-term Assets | $300,000 | $400,000 | $500,000 |
| Accumulated Depreciation | $100,000 | $200,000 | $300,000 |
| Total Long-term Assets | $200,000 | $200,000 | $200,000 |
| Total Assets | $527,616 | $538,247 | $574,631 |
| Liabilities and Capital | Year 1 | Year 2 | Year 3 |
| Current Liabilities | |||
| Accounts Payable | $0 | $32,253 | $35,400 |
| Current Borrowing | $40,000 | $0 | $0 |
| Other Current Liabilities | $0 | $0 | $0 |
| Subtotal Current Liabilities | $40,000 | $32,253 | $35,400 |
| Long-term Liabilities | $280,102 | $258,161 | $236,219 |
| Total Liabilities | $320,102 | $290,413 | $271,619 |
| Paid-in Capital | $130,000 | $130,000 | $130,000 |
| Retained Earnings | ($4,400) | $77,514 | $117,833 |
| Earnings | $81,914 | $40,319 | $55,178 |
| Total Capital | $207,514 | $247,833 | $303,012 |
| Total Liabilities and Capital | $527,616 | $538,247 | $574,631 |
| Net Worth | $207,514 | $247,833 | $303,012 |
7.7 Business Ratios
The standard ratios shown are for SIC code 7359, other nonclassified rental businesses.
| Ratio Analysis | ||||
| Year 1 | Year 2 | Year 3 | Industry Profile | |
| Sales Growth | 0.00% | 27.37% | 11.11% | 7.90% |
| Percent of Total Assets | ||||
| Inventory | 0.95% | 2.36% | 2.50% | 3.40% |
| Other Current Assets | 9.48% | 9.29% | 8.70% | 45.10% |
| Total Current Assets | 62.09% | 62.84% | 65.20% | 74.30% |
| Long-term Assets | 37.91% | 37.16% | 34.80% | 25.70% |
| Total Assets | 100.00% | 100.00% | 100.00% | 100.00% |
| Current Liabilities | 7.58% | 5.99% | 6.16% | 42.00% |
| Long-term Liabilities | 53.09% | 47.96% | 41.11% | 15.70% |
| Total Liabilities | 60.67% | 53.96% | 47.27% | 57.70% |
| Net Worth | 39.33% | 46.04% | 52.73% | 42.30% |
| Percent of Sales | ||||
| Sales | 100.00% | 100.00% | 100.00% | 100.00% |
| Gross Margin | 75.56% | 51.11% | 50.37% | 0.00% |
| Selling, General & Administrative Expenses | 57.15% | 44.00% | 41.61% | 82.90% |
| Advertising Expenses | 0.19% | 0.18% | 0.19% | 1.00% |
| Profit Before Interest and Taxes | 30.53% | 13.58% | 14.79% | 2.60% |
| Main Ratios | ||||
| Current | 8.19 | 10.49 | 10.58 | 1.68 |
| Quick | 8.07 | 10.09 | 10.18 | 1.33 |
| Total Debt to Total Assets | 60.67% | 53.96% | 47.27% | 57.70% |
| Pre-tax Return on Net Worth | 56.39% | 23.24% | 26.01% | 4.80% |
| Pre-tax Return on Assets | 22.18% | 10.70% | 13.72% | 11.40% |
| Additional Ratios | Year 1 | Year 2 | Year 3 | |
| Net Profit Margin | 17.17% | 6.64% | 8.17% | n.a |
| Return on Equity | 39.47% | 16.27% | 18.21% | n.a |
| Activity Ratios | ||||
| Inventory Turnover | 3.69 | 33.54 | 24.75 | n.a |
| Accounts Payable Turnover | 0.00 | 12.17 | 12.17 | n.a |
| Payment Days | 32 | 15 | 29 | n.a |
| Total Asset Turnover | 0.90 | 1.13 | 1.17 | n.a |
| Debt Ratios | ||||
| Debt to Net Worth | 1.54 | 1.17 | 0.90 | n.a |
| Current Liab. to Liab. | 0.12 | 0.11 | 0.13 | n.a |
| Liquidity Ratios | ||||
| Net Working Capital | $287,616 | $305,994 | $339,231 | n.a |
| Interest Coverage | 5.09 | 3.32 | 4.75 | n.a |
| Additional Ratios | ||||
| Assets to Sales | 1.11 | 0.89 | 0.85 | n.a |
| Current Debt/Total Assets | 8% | 6% | 6% | n.a |
| Acid Test | 8.07 | 10.09 | 10.18 | n.a |
| Sales/Net Worth | 2.30 | 2.45 | 2.23 | n.a |
| Dividend Payout | 0.00 | 0.00 | 0.00 | n.a |
Appendix
| Sales Forecast | |||||||||||||
| Month 1 | Month 2 | Month 3 | Month 4 | Month 5 | Month 6 | Month 7 | Month 8 | Month 9 | Month 10 | Month 11 | Month 12 | ||
| Unit Sales | |||||||||||||
| Moped Rentals | 0% | 25 | 285 | 354 | 414 | 436 | 356 | 454 | 376 | 324 | 300 | 161 | 48 |
| Moped Accessories | 0% | 50 | 570 | 708 | 828 | 872 | 712 | 908 | 752 | 648 | 600 | 322 | 96 |
| Other | 0% | 75 | 855 | 1,062 | 1,242 | 1,308 | 1,068 | 1,362 | 1,128 | 972 | 900 | 483 | 144 |
| Total Unit Sales | 150 | 1,710 | 2,124 | 2,484 | 2,616 | 2,136 | 2,724 | 2,256 | 1,944 | 1,800 | 966 | 288 | |
| Unit Prices | Month 1 | Month 2 | Month 3 | Month 4 | Month 5 | Month 6 | Month 7 | Month 8 | Month 9 | Month 10 | Month 11 | Month 12 | |
| Moped Rentals | $50.00 | $50.00 | $50.00 | $50.00 | $50.00 | $50.00 | $50.00 | $50.00 | $50.00 | $50.00 | $50.00 | $50.00 | |
| Moped Accessories | $35.00 | $35.00 | $35.00 | $35.00 | $35.00 | $35.00 | $35.00 | $35.00 | $35.00 | $35.00 | $35.00 | $35.00 | |
| Other | $5.00 | $5.00 | $5.00 | $5.00 | $5.00 | $5.00 | $5.00 | $5.00 | $5.00 | $5.00 | $5.00 | $5.00 | |
| Sales | |||||||||||||
| Moped Rentals | $1,250 | $14,250 | $17,700 | $20,700 | $21,800 | $17,800 | $22,700 | $18,800 | $16,200 | $15,000 | $8,050 | $2,400 | |
| Moped Accessories | $1,750 | $19,950 | $24,780 | $28,980 | $30,520 | $24,920 | $31,780 | $26,320 | $22,680 | $21,000 | $11,270 | $3,360 | |
| Other | $375 | $4,275 | $5,310 | $6,210 | $6,540 | $5,340 | $6,810 | $5,640 | $4,860 | $4,500 | $2,415 | $720 | |
| Total Sales | $3,375 | $38,475 | $47,790 | $55,890 | $58,860 | $48,060 | $61,290 | $50,760 | $43,740 | $40,500 | $21,735 | $6,480 | |
| Direct Unit Costs | Month 1 | Month 2 | Month 3 | Month 4 | Month 5 | Month 6 | Month 7 | Month 8 | Month 9 | Month 10 | Month 11 | Month 12 | |
| Moped Rentals | 0.00% | $5.00 | $5.00 | $5.00 | $5.00 | $5.00 | $5.00 | $5.00 | $5.00 | $5.00 | $5.00 | $5.00 | $5.00 |
| Moped Accessories | 0.00% | $11.00 | $11.00 | $11.00 | $11.00 | $11.00 | $11.00 | $11.00 | $11.00 | $11.00 | $11.00 | $11.00 | $11.00 |
| Other | 0.00% | $2.00 | $2.00 | $2.00 | $2.00 | $2.00 | $2.00 | $2.00 | $2.00 | $2.00 | $2.00 | $2.00 | $2.00 |
| Direct Cost of Sales | |||||||||||||
| Moped Rentals | $125 | $1,425 | $1,770 | $2,070 | $2,180 | $1,780 | $2,270 | $1,880 | $1,620 | $1,500 | $805 | $240 | |
| Moped Accessories | $550 | $6,270 | $7,788 | $9,108 | $9,592 | $7,832 | $9,988 | $8,272 | $7,128 | $6,600 | $3,542 | $1,056 | |
| Other | $150 | $1,710 | $2,124 | $2,484 | $2,616 | $2,136 | $2,724 | $2,256 | $1,944 | $1,800 | $966 | $288 | |
| Subtotal Direct Cost of Sales | $825 | $9,405 | $11,682 | $13,662 | $14,388 | $11,748 | $14,982 | $12,408 | $10,692 | $9,900 | $5,313 | $1,584 | |
| Personnel Plan | |||||||||||||
| Month 1 | Month 2 | Month 3 | Month 4 | Month 5 | Month 6 | Month 7 | Month 8 | Month 9 | Month 10 | Month 11 | Month 12 | ||
| Shop Help | 0% | $2,000 | $2,000 | $2,000 | $2,000 | $2,000 | $2,000 | $2,000 | $2,000 | $2,000 | $2,000 | $2,000 | $2,000 |
| Mechanics | 0% | $1,500 | $1,500 | $1,500 | $1,500 | $1,500 | $1,500 | $1,500 | $1,500 | $1,500 | $1,500 | $1,500 | $1,500 |
| Management | 0% | $2,500 | $2,500 | $2,500 | $2,500 | $2,500 | $2,500 | $2,500 | $2,500 | $2,500 | $2,500 | $2,500 | $2,500 |
| Other | 0% | $250 | $250 | $250 | $250 | $250 | $250 | $250 | $250 | $250 | $250 | $250 | $250 |
| Total People | 4 | 4 | 4 | 4 | 4 | 4 | 4 | 4 | 4 | 4 | 4 | 4 | |
| Total Payroll | $6,250 | $6,250 | $6,250 | $6,250 | $6,250 | $6,250 | $6,250 | $6,250 | $6,250 | $6,250 | $6,250 | $6,250 | |
| General Assumptions | |||||||||||||
| Month 1 | Month 2 | Month 3 | Month 4 | Month 5 | Month 6 | Month 7 | Month 8 | Month 9 | Month 10 | Month 11 | Month 12 | ||
| Plan Month | 1 | 2 | 3 | 4 | 5 | 6 | 7 | 8 | 9 | 10 | 11 | 12 | |
| Current Interest Rate | 10.00% | 10.00% | 10.00% | 10.00% | 10.00% | 10.00% | 10.00% | 10.00% | 10.00% | 10.00% | 10.00% | 10.00% | |
| Long-term Interest Rate | 8.50% | 8.50% | 8.50% | 8.50% | 8.50% | 8.50% | 8.50% | 8.50% | 8.50% | 8.50% | 8.50% | 8.50% | |
| Tax Rate | 30.00% | 30.00% | 30.00% | 30.00% | 30.00% | 30.00% | 30.00% | 30.00% | 30.00% | 30.00% | 30.00% | 30.00% | |
| Other | 0 | 0 | 0 | 0 | 0 | 0 | 0 | 0 | 0 | 0 | 0 | 0 | |
| Pro Forma Profit and Loss | |||||||||||||
| Month 1 | Month 2 | Month 3 | Month 4 | Month 5 | Month 6 | Month 7 | Month 8 | Month 9 | Month 10 | Month 11 | Month 12 | ||
| Sales | $3,375 | $38,475 | $47,790 | $55,890 | $58,860 | $48,060 | $61,290 | $50,760 | $43,740 | $40,500 | $21,735 | $6,480 | |
| Direct Cost of Sales | $825 | $9,405 | $11,682 | $13,662 | $14,388 | $11,748 | $14,982 | $12,408 | $10,692 | $9,900 | $5,313 | $1,584 | |
| Other | $0 | $0 | $0 | $0 | $0 | $0 | $0 | $0 | $0 | $0 | $0 | $0 | |
| Total Cost of Sales | $825 | $9,405 | $11,682 | $13,662 | $14,388 | $11,748 | $14,982 | $12,408 | $10,692 | $9,900 | $5,313 | $1,584 | |
| Gross Margin | $2,550 | $29,070 | $36,108 | $42,228 | $44,472 | $36,312 | $46,308 | $38,352 | $33,048 | $30,600 | $16,422 | $4,896 | |
| Gross Margin % | 75.56% | 75.56% | 75.56% | 75.56% | 75.56% | 75.56% | 75.56% | 75.56% | 75.56% | 75.56% | 75.56% | 75.56% | |
| Expenses | |||||||||||||
| Payroll | $6,250 | $6,250 | $6,250 | $6,250 | $6,250 | $6,250 | $6,250 | $6,250 | $6,250 | $6,250 | $6,250 | $6,250 | |
| Sales and Marketing and Other Expenses | $500 | $200 | $200 | $0 | $0 | $0 | $0 | $0 | $0 | $0 | $0 | $0 | |
| Depreciation | $0 | $0 | $0 | $0 | $0 | $0 | $0 | $0 | $0 | $0 | $0 | $100,000 | |
| Leased Equipment | $50 | $50 | $50 | $50 | $50 | $50 | $50 | $50 | $50 | $50 | $50 | $50 | |
| Utilities | $50 | $50 | $50 | $50 | $50 | $50 | $50 | $50 | $50 | $50 | $50 | $50 | |
| Insurance | $200 | $200 | $200 | $200 | $200 | $200 | $200 | $200 | $200 | $200 | $200 | $200 | |
| Rent | $2,000 | $2,000 | $2,000 | $2,000 | $2,000 | $2,000 | $2,000 | $2,000 | $2,000 | $2,000 | $2,000 | $2,000 | |
| Payroll Taxes | 15% | $938 | $938 | $938 | $938 | $938 | $938 | $938 | $938 | $938 | $938 | $938 | $938 |
| Other | $0 | $0 | $0 | $0 | $0 | $0 | $0 | $0 | $0 | $0 | $0 | $0 | |
| Total Operating Expenses | $9,988 | $9,688 | $9,688 | $9,488 | $9,488 | $9,488 | $9,488 | $9,488 | $9,488 | $9,488 | $9,488 | $109,488 | |
| Profit Before Interest and Taxes | ($7,438) | $19,383 | $26,421 | $32,741 | $34,985 | $26,825 | $36,821 | $28,865 | $23,561 | $21,113 | $6,935 | ($104,592) | |
| EBITDA | ($7,438) | $19,383 | $26,421 | $32,741 | $34,985 | $26,825 | $36,821 | $28,865 | $23,561 | $21,113 | $6,935 | ($4,592) | |
| Interest Expense | $2,447 | $2,436 | $2,424 | $2,413 | $2,401 | $2,389 | $2,378 | $2,366 | $2,354 | $2,342 | $2,330 | $2,317 | |
| Taxes Incurred | ($2,965) | $5,084 | $7,199 | $9,098 | $9,775 | $7,331 | $10,333 | $7,950 | $6,362 | $5,631 | $1,381 | ($32,073) | |
| Net Profit | ($6,919) | $11,863 | $16,797 | $21,229 | $22,808 | $17,105 | $24,110 | $18,549 | $14,845 | $13,140 | $3,223 | ($74,836) | |
| Net Profit/Sales | -205.01% | 30.83% | 35.15% | 37.98% | 38.75% | 35.59% | 39.34% | 36.54% | 33.94% | 32.44% | 14.83% | -1154.88% | |
| Pro Forma Cash Flow | |||||||||||||
| Month 1 | Month 2 | Month 3 | Month 4 | Month 5 | Month 6 | Month 7 | Month 8 | Month 9 | Month 10 | Month 11 | Month 12 | ||
| Cash Received | |||||||||||||
| Cash from Operations | |||||||||||||
| Cash Sales | $3,375 | $38,475 | $47,790 | $55,890 | $58,860 | $48,060 | $61,290 | $50,760 | $43,740 | $40,500 | $21,735 | $6,480 | |
| Subtotal Cash from Operations | $3,375 | $38,475 | $47,790 | $55,890 | $58,860 | $48,060 | $61,290 | $50,760 | $43,740 | $40,500 | $21,735 | $6,480 | |
| Additional Cash Received | |||||||||||||
| Sales Tax, VAT, HST/GST Received | 0.00% | $0 | $0 | $0 | $0 | $0 | $0 | $0 | $0 | $0 | $0 | $0 | $0 |
| New Current Borrowing | $0 | $0 | $0 | $0 | $0 | $0 | $0 | $0 | $0 | $0 | $0 | $0 | |
| New Other Liabilities (interest-free) | $0 | $0 | $0 | $0 | $0 | $0 | $0 | $0 | $0 | $0 | $0 | $0 | |
| New Long-term Liabilities | $0 | $0 | $0 | $0 | $0 | $0 | $0 | $0 | $0 | $0 | $0 | $0 | |
| Sales of Other Current Assets | $0 | $0 | $0 | $0 | $0 | $0 | $0 | $0 | $0 | $0 | $0 | $0 | |
| Sales of Long-term Assets | $0 | $0 | $0 | $0 | $0 | $0 | $0 | $0 | $0 | $0 | $0 | $0 | |
| New Investment Received | $0 | $0 | $0 | $0 | $0 | $0 | $0 | $0 | $0 | $0 | $0 | $0 | |
| Subtotal Cash Received | $3,375 | $38,475 | $47,790 | $55,890 | $58,860 | $48,060 | $61,290 | $50,760 | $43,740 | $40,500 | $21,735 | $6,480 | |
| Expenditures | Month 1 | Month 2 | Month 3 | Month 4 | Month 5 | Month 6 | Month 7 | Month 8 | Month 9 | Month 10 | Month 11 | Month 12 | |
| Expenditures from Operations | |||||||||||||
| Cash Spending | $6,250 | $6,250 | $6,250 | $6,250 | $6,250 | $6,250 | $6,250 | $6,250 | $6,250 | $6,250 | $6,250 | $6,250 | |
| Bill Payments | $107 | $3,477 | $11,027 | $13,117 | $14,771 | $15,332 | $13,413 | $26,504 | $23,050 | $20,740 | $19,830 | ($18,834) | |
| Subtotal Spent on Operations | $6,357 | $9,727 | $17,277 | $19,367 | $21,021 | $21,582 | $19,663 | $32,754 | $29,300 | $26,990 | $26,080 | ($12,584) | |
| Additional Cash Spent | |||||||||||||
| Sales Tax, VAT, HST/GST Paid Out | $0 | $0 | $0 | $0 | $0 | $0 | $0 | $0 | $0 | $0 | $0 | $0 | |
| Principal Repayment of Current Borrowing | $0 | $0 | $0 | $0 | $0 | $0 | $0 | $0 | $0 | $0 | $0 | $0 | |
| Other Liabilities Principal Repayment | $0 | $0 | $0 | $0 | $0 | $0 | $0 | $0 | $0 | $0 | $0 | $0 | |
| Long-term Liabilities Principal Repayment | $1,595 | $1,606 | $1,617 | $1,629 | $1,640 | $1,652 | $1,664 | $1,675 | $1,687 | $1,699 | $1,711 | $1,723 | |
| Purchase Other Current Assets | $0 | $0 | $0 | $0 | $0 | $0 | $0 | $0 | $0 | $0 | $0 | $0 | |
| Purchase Long-term Assets | $0 | $0 | $0 | $0 | $0 | $0 | $0 | $0 | $0 | $0 | $0 | $0 | |
| Dividends | $0 | $0 | $0 | $0 | $0 | $0 | $0 | $0 | $0 | $0 | $0 | $0 | |
| Subtotal Cash Spent | $7,952 | $11,333 | $18,895 | $20,996 | $22,661 | $23,234 | $21,326 | $34,429 | $30,988 | $28,690 | $27,791 | ($10,861) | |
| Net Cash Flow | ($4,577) | $27,142 | $28,895 | $34,894 | $36,199 | $24,826 | $39,964 | $16,331 | $12,752 | $11,810 | ($6,056) | $17,341 | |
| Cash Balance | $28,523 | $55,665 | $84,561 | $119,455 | $155,654 | $180,481 | $220,444 | $236,775 | $249,527 | $261,338 | $255,282 | $272,623 | |
| Pro Forma Balance Sheet | |||||||||||||
| Month 1 | Month 2 | Month 3 | Month 4 | Month 5 | Month 6 | Month 7 | Month 8 | Month 9 | Month 10 | Month 11 | Month 12 | ||
| Assets | Starting Balances | ||||||||||||
| Current Assets | |||||||||||||
| Cash | $33,100 | $28,523 | $55,665 | $84,561 | $119,455 | $155,654 | $180,481 | $220,444 | $236,775 | $249,527 | $261,338 | $255,282 | $272,623 |
| Inventory | $82,500 | $81,675 | $72,270 | $60,588 | $46,926 | $32,538 | $20,790 | $16,480 | $13,649 | $11,761 | $10,890 | $6,577 | $4,993 |
| Other Current Assets | $50,000 | $50,000 | $50,000 | $50,000 | $50,000 | $50,000 | $50,000 | $50,000 | $50,000 | $50,000 | $50,000 | $50,000 | $50,000 |
| Total Current Assets | $165,600 | $160,198 | $177,935 | $195,149 | $216,381 | $238,192 | $251,271 | $286,924 | $300,424 | $311,289 | $322,228 | $311,859 | $327,616 |
| Long-term Assets | |||||||||||||
| Long-term Assets | $300,000 | $300,000 | $300,000 | $300,000 | $300,000 | $300,000 | $300,000 | $300,000 | $300,000 | $300,000 | $300,000 | $300,000 | $300,000 |
| Accumulated Depreciation | $0 | $0 | $0 | $0 | $0 | $0 | $0 | $0 | $0 | $0 | $0 | $0 | $100,000 |
| Total Long-term Assets | $300,000 | $300,000 | $300,000 | $300,000 | $300,000 | $300,000 | $300,000 | $300,000 | $300,000 | $300,000 | $300,000 | $300,000 | $200,000 |
| Total Assets | $465,600 | $460,198 | $477,935 | $495,149 | $516,381 | $538,192 | $551,271 | $586,924 | $600,424 | $611,289 | $622,228 | $611,859 | $527,616 |
| Liabilities and Capital | Month 1 | Month 2 | Month 3 | Month 4 | Month 5 | Month 6 | Month 7 | Month 8 | Month 9 | Month 10 | Month 11 | Month 12 | |
| Current Liabilities | |||||||||||||
| Accounts Payable | $0 | $3,112 | $10,592 | $12,625 | $14,257 | $14,900 | $12,525 | $25,733 | $22,358 | $20,066 | $19,565 | $7,684 | $0 |
| Current Borrowing | $40,000 | $40,000 | $40,000 | $40,000 | $40,000 | $40,000 | $40,000 | $40,000 | $40,000 | $40,000 | $40,000 | $40,000 | $40,000 |
| Other Current Liabilities | $0 | $0 | $0 | $0 | $0 | $0 | $0 | $0 | $0 | $0 | $0 | $0 | $0 |
| Subtotal Current Liabilities | $40,000 | $43,112 | $50,592 | $52,625 | $54,257 | $54,900 | $52,525 | $65,733 | $62,358 | $60,066 | $59,565 | $47,684 | $40,000 |
| Long-term Liabilities | $300,000 | $298,405 | $296,800 | $295,182 | $293,554 | $291,913 | $290,262 | $288,598 | $286,923 | $285,235 | $283,536 | $281,825 | $280,102 |
| Total Liabilities | $340,000 | $341,517 | $347,392 | $347,808 | $347,811 | $346,813 | $342,787 | $354,331 | $349,281 | $345,301 | $343,101 | $329,509 | $320,102 |
| Paid-in Capital | $130,000 | $130,000 | $130,000 | $130,000 | $130,000 | $130,000 | $130,000 | $130,000 | $130,000 | $130,000 | $130,000 | $130,000 | $130,000 |
| Retained Earnings | ($4,400) | ($4,400) | ($4,400) | ($4,400) | ($4,400) | ($4,400) | ($4,400) | ($4,400) | ($4,400) | ($4,400) | ($4,400) | ($4,400) | ($4,400) |
| Earnings | $0 | ($6,919) | $4,944 | $21,741 | $42,970 | $65,779 | $82,884 | $106,994 | $125,543 | $140,387 | $153,527 | $156,750 | $81,914 |
| Total Capital | $125,600 | $118,681 | $130,544 | $147,341 | $168,570 | $191,379 | $208,484 | $232,594 | $251,143 | $265,987 | $279,127 | $282,350 | $207,514 |
| Total Liabilities and Capital | $465,600 | $460,198 | $477,935 | $495,149 | $516,381 | $538,192 | $551,271 | $586,924 | $600,424 | $611,289 | $622,228 | $611,859 | $527,616 |
| Net Worth | $125,600 | $118,681 | $130,544 | $147,341 | $168,570 | $191,379 | $208,484 | $232,594 | $251,143 | $265,987 | $279,127 | $282,350 | $207,514 |


