
Water Factory
Executive Summary
The Water Factory is a network marketing firm that sells Water Genie home water filtration systems. The Water Factory has chosen the network marketing business model as a way of creating a recurring revenue structure in a home business. Aitch Tuoo, the founder and owner, has done a significant amount of research and has determined the filtered water market is a large, quickly growing market. People are willing to pay up to five times the cost per gallon for water than they are for gasoline.
By using the network marketing business model, Aitch Tuoo uses personal contacts as his target market. This is advantageous because a bond has already been established with these prospects, making it easier for Aitch to turn prospects into leads. Additionally, network marketing creates recurring revenue streams through commissions that Aitch earns for salespeople he recruits. Aitch also receives revenue for each salesperson his sales people recruit. This revenue stream then turns his job into a business, a way to earn money even if he is not working.
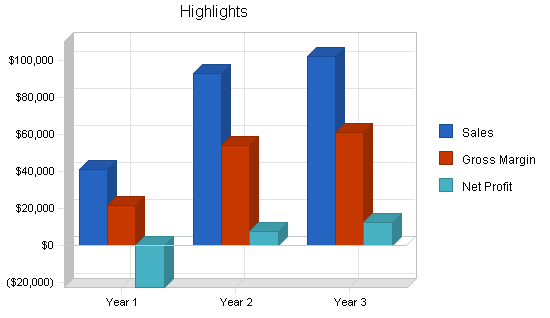
The Water Factory will reach profitability by month 12 and will have modest, but steady, profits by year three.
Objectives
The objectives for the first three years of operation are outlined below:
- To create a service-based company whose primary goal is to exceed customers’ expectations.
- The utilization of The Water Factory products by at least 10% of the local population.
- To increase the number of sellers by 20% each year.
- To develop a sustainable home-based business, surviving off of its own cash flow.
Mission
The Water Factory’s mission is to provide customers with the finest quality water filtration units. We exist to attract and maintain customers. When we adhere to this maxim, everything else will fall in to place. Our services will exceed the expectations of our customers.
Company Summary
The Water Factory, located in Albany, Oregon, is a network marketing business that sells water filtration units to end consumers. We exclusively sell Water Genie Brand filters for home use via the network marketing system, also known as multi-level marketing. The company will use personal contact recruiting to develop a sales force that will help sell more products.
The business will be based out of the owners home. It is forecasted that we will reach profitability by month 12, and we will earn modest profits by year three.
Company Ownership
The Water Factory is a sole proprietorship, founded and owned by Aitch Tuoo.
Start-up Summary
The Water Factory’s start-up costs include the following items:
- Office furniture, including a desk, chair, and filing cabinets
- Computer system, including printer, CD-RW, Internet connections, Microsoft Office
- Stationery
- Brochures
- Legal fees
- Phone line, pager, cell phone

| Start-up | |
| Requirements | |
| Start-up Expenses | |
| Legal | $200 |
| Stationery etc. | $200 |
| Brochures | $200 |
| Other | $0 |
| Total Start-up Expenses | $600 |
| Start-up Assets | |
| Cash Required | $15,100 |
| Other Current Assets | $0 |
| Long-term Assets | $2,300 |
| Total Assets | $17,400 |
| Total Requirements | $18,000 |
| Start-up Funding | |
| Start-up Expenses to Fund | $600 |
| Start-up Assets to Fund | $17,400 |
| Total Funding Required | $18,000 |
| Assets | |
| Non-cash Assets from Start-up | $2,300 |
| Cash Requirements from Start-up | $15,100 |
| Additional Cash Raised | $0 |
| Cash Balance on Starting Date | $15,100 |
| Total Assets | $17,400 |
| Liabilities and Capital | |
| Liabilities | |
| Current Borrowing | $0 |
| Long-term Liabilities | $0 |
| Accounts Payable (Outstanding Bills) | $0 |
| Other Current Liabilities (interest-free) | $0 |
| Total Liabilities | $0 |
| Capital | |
| Planned Investment | |
| Investor 1 | $18,000 |
| Investor 2 | $0 |
| Other | $0 |
| Additional Investment Requirement | $0 |
| Total Planned Investment | $18,000 |
| Loss at Start-up (Start-up Expenses) | ($600) |
| Total Capital | $17,400 |
| Total Capital and Liabilities | $17,400 |
| Total Funding | $18,000 |
Products
The Water Factory exclusively sells Water Genie brand home water filtration systems. Home water filters are used to improve the taste quality of the water as well as to remove harmful impurities in the water. Three different models will be sold:
- The Carafe- This model looks like a large water pitcher. When you fill up the pitcher the water passes through a filter, cleansing the water. When you pour the pitcher only the filtered water comes out. The price per gallon of water is $.26.
- The Faucet Mount- This model looks like a large bulb that mounts on the end of the water faucet. When you desire filtered water, you rotate the filter toward you and filtered water comes out of a small hole. When you want unfiltered water to pass through, you rotate the filter away from you and unfiltered water comes out of a large hole. Unfiltered water would be used to wash hands or dishes and pots. The price per gallon of filtered water is $.12.
- The Counter Mount- This model is a 12-inch tall cylinder that resides on the counter, up to 14 inches away from the sink. There is a button near where the water exits the faucet that you push to allow filtered water to pass through. When you no longer need filtered water you push the button again and unfiltered water comes out. The price per gallon of filtered is $.06.
Market Analysis Summary
The Water Factory will be targeting personal contacts as the prospective customers. This is an ideal market segment because a positive relationship already exists with the personal contacts, making Aitch Tuoo’s job of selling the products significantly easier.
Market Segmentation
As a network marketing business, the company has an unusual market segment that it is targeting. With network marketing, sales and recruitment are done through personal contacts. Once these people are users, salespeople try to convert them from users to salespeople for the products. This is also called multi-level marketing. A company sells a product to a consumer (typically personal contacts) via direct selling methods, and recruits new people to help sell. The salesperson is then being compensated for the sales made as well as the sales of the people recruited.
Because of this unusual business arrangement, the market will be segmented into personal contacts. Personal contacts typically take the form of the following groups (not an exhaustive list): past classmates, current and past neighbors, landlords, tenants, repair people, grocers, club members, sport partners, children’s teachers, children’s playmate parents, spouse contacts, and fellow congregation members.
This market segment that will be targeted will be called “personal contacts,” and makes up the majority of the market.

| Market Analysis | |||||||
| Year 1 | Year 2 | Year 3 | Year 4 | Year 5 | |||
| Potential Customers | Growth | CAGR | |||||
| Personal Contacts | 9% | 560 | 610 | 665 | 725 | 790 | 8.98% |
| Other | 0% | 0 | 0 | 0 | 0 | 0 | 0.00% |
| Total | 8.98% | 560 | 610 | 665 | 725 | 790 | 8.98% |
Target Market Segment Strategy
The Water Factory is focusing on this portion of the market because to some degree a trust relationship has already been developed between the personal contacts. Due to the nature of this business, where you sell directly to the consumer, it helps considerably to have already established a relationship. With a relationship already established, it is far easier to then sell the product because the prospective customers skepticism has been lowered. This then creates an opportunity when The Water Factory can explain the cost advantages of home water filters relative to bottled water.
Additionally, this market is targeted because once the prosect is a customer, it is then easier to convert them into a sales agent for The Water Factory. The advantage to the company of having sales representatives is an extra income stream of sales commissions. The advantage to the customers becoming sales representatives is a lower cost for their own product and a revenue stream from the sales of filters to their clients. If their clients then become sales agents, the customers then get a second level of revenue. Lastly, for every new recruit that Aitch’s recruits bring in, Aitch gets a commission. So Aitch would get a commission for his sales, a commission for the sales of his recruits, and if they recruit someone, Aitch will get a commission off of them as well.

Industry Analysis
Network marketing, also known as multi-level marketing, is a growing industry. The large names in the industry are Amway, Shaklee, and Herblife. Other well-known companies that participate in the space are AT&T, Proctor & Gamble, and Coca Cola.
Several years, ago network marketing received a bad reputation because of it’s association with pyramid schemes. Make no mistake however, network marketing is far different from pyramid schemes. Pyramid schemes were also multi-level businesses, however they did not have a viable product or service. They just had a many levels of people paying money to become a part of the pyramid with the promise that people would be paying them to become a lower part of the pyramid.
In network marketing, personal care products and household products dominate. However, there are also other services and products that are sold, including travel arrangements, insurance services, pet care supplies, phone service, etc.
Competition and Buying Patterns
There are several different sources of competition:
- Other network marketing companies selling water filters. There are four to seven other network marketing firms that also sell water filtration units. Prices can be competitive.
- Water filters sold through traditional retailers. There are approximately ten different manufactures of home filtration units. These units can be competitively priced, however, there is not the option to become a sales agent and get lower purchase prices for yourself as well as a future revenue stream.
- Office style water dispenser (typically leased). There are several companies that will lease these large, stand-alone water coolers. The equipment for this solution is more expensive, in part because you are leasing a refrigeration unit to cool the water, and the cost per gallon is also more expensive.
- Bottled water. There are hundreds of companies that sell bottled water with the price ranging from $1-$5 a gallon, which is significantly more expensive.
- Soft drinks. While this is not a direct substitute for water, people consume soft drinks when they are thirsty. Besides the many negative health issues surrounding soft drink consumption, it is as pricey as bottled water.
Over the last five years the market for filtered water, typically in the form of bottled water, has exploded. It is ironic how people complain about the price of gas when they will pay up to five times the price for a gallon of water. Regardless, demand for filtered water has steadily grown, and home water filtration units offer huge price advantages relative to bottled water alternatives.
Strategy and Implementation Summary
The Water Factory will be aggressively courting personal contacts. Once contacts have been turned into customers, Aitch Tuoo will then attempt to turn them into sales agents for him. The advantage for them is that they get products at wholesale and receive recurring revenue for sales people they recruit. The Water Factory benefits as it gets the recurring revenue for all sales that are made by Aitch’s customers or the sales agents of his customers. It is a win-win situation and can be easily presented as such.
Competitive Edge
The Water Factory’s competitive advantage over regular outlets of water filtration systems is the ability to generate revenue streams for sellers of the products. This is the virtue of the network marketing system. With network marketing, if buyers becomes sellers, they can receive their products at wholesale pricing and receive a commission for products that they sell. Additionally, if they recruit people to help them sell, they get a commission for every sale that their recruits make. At the same time, Aitch gets a commission of his recruits as well as his recruit’s recruits. This is a relatively easy way to create a recurring revenue stream and creates a competitive advantage that will help gain market share.
Sales Strategy
The Water Factory’s sales strategy will be based on leveraging personal contacts. Typically, an informal meeting will be set up with the prospective customer. A brochure will be introduced with product information about the water filters. Then, quantitative information will be introduced explaining really how much people are spending on bottled water and how much money could be saved by using a water filter. Additionally, Aitch Tuoo will explain how all problems, concerns, delivery, and billing will be handled by him. The ideal situation will be that Aitch Tuoo will be able to sign the customer up right then.
During that initial meeting if the prospect is especially excited about the idea, or at a later date, Aitch Tuoo will introduce the option of becoming a member of The Water Factory. If the customer understands/believes the cost effectiveness of the Water Genie product, they will appreciate the option of getting the product at cost and making a commission on sales that they make, as well as commissions from sales that their recruits make.
Sales Forecast
The first month will be spent setting up the home office. There will be no sales activity. Additionally, Aitch Tuoo will be ordering products to use as samples.
The second month will be the first month of sales. During this month Aitch Tuoo will have signed people up and revenue will be trickling in. It will not be until month five when revenue begins to get strong. Month six will be the first month when the recurring revenue will come in from Aitch Tuoo’s recruited sales people.


| Sales Forecast | |||
| Year 1 | Year 2 | Year 3 | |
| Sales | |||
| Personal contacts | $39,091 | $77,854 | $82,547 |
| Recurring revenue stream | $2,189 | $15,447 | $19,874 |
| Total Sales | $41,280 | $93,301 | $102,421 |
| Direct Cost of Sales | Year 1 | Year 2 | Year 3 |
| Personal contacts | $19,546 | $38,927 | $41,274 |
| Recurring revenue stream | $0 | $0 | $0 |
| Subtotal Direct Cost of Sales | $19,546 | $38,927 | $41,274 |
Milestones
The Water Factory will have several milestones early on:
- Business plan completion. This will be done as a road map for the organization. While we do not need a business plan to raise capital, it will be an indispensable tool for the ongoing performance and improvement of the company.
- Office set up.
- First recurring revenue to come in.
- Profitability solely from recurring revenue.
| Milestones | |||||
| Milestone | Start Date | End Date | Budget | Manager | Department |
| Business plan completion | 1/1/2001 | 2/1/2001 | $0 | ABC | Marketing |
| Office set up | 1/1/2001 | 2/1/2001 | $0 | ABC | Department |
| First recurring revenue to come in. | 1/1/2001 | 5/1/2001 | $0 | ABC | Department |
| Profitability solely from recurring revenue | 1/1/2001 | 9/1/2001 | $0 | ABC | Department |
| Totals | $0 | ||||
Management Summary
Aitch Tuoo, the founder and owner, pursued his undergraduate business degree from the University of Washington. While at UW, Aitch worked for Circuit City as a sales representative because he thought the skill of sales was an important one to have.
Throughout his undergraduate studies, Aitch was unsure of what type of business he wanted to pursue. He decided on business as a major as he thought it would be a universal degree. During his third year he took an entrepreneur class. This class pointed out the distinction between having a job and having a business. The difference is that with a job you earn money when you work, compared to when you own a business, you make money while the business is operating, regardless if you are actually working or not. This point really sunk home for him. Aitch was interested in having a business as opposed to having a job. He wanted to make money regardless if he was working, this ideology truly appealed to him. Upon graduating, Aitch did a significant amount of research to determine what was the most promising market was. He was surprised to learn that the market for filtered water was huge and growing each year. He also came across the network marketing business model and decided to melt the two things together to create a business for himself.
Personnel Plan
As a home based business, Aitch will be the only person working and will receive a monthly salary.
| Personnel Plan | |||
| Year 1 | Year 2 | Year 3 | |
| Aitch Tuoo | $36,000 | $36,000 | $36,000 |
| Other | $0 | $0 | $0 |
| Total People | 0 | 0 | 0 |
| Total Payroll | $36,000 | $36,000 | $36,000 |
Financial Plan
The following sections will outline the important financial details.
Important Assumptions
The following table details the important financial assumptions.
| General Assumptions | |||
| Year 1 | Year 2 | Year 3 | |
| Plan Month | 1 | 2 | 3 |
| Current Interest Rate | 10.00% | 10.00% | 10.00% |
| Long-term Interest Rate | 10.00% | 10.00% | 10.00% |
| Tax Rate | 25.42% | 25.00% | 25.42% |
| Other | 0 | 0 | 0 |
Break-even Analysis
The Break-even Analysis indicates what is needed in monthly revenue to break even.

| Break-even Analysis | |
| Monthly Revenue Break-even | $7,025 |
| Assumptions: | |
| Average Percent Variable Cost | 47% |
| Estimated Monthly Fixed Cost | $3,699 |
Projected Profit and Loss
The following table indicates projected profit and loss.


| Pro Forma Profit and Loss | |||
| Year 1 | Year 2 | Year 3 | |
| Sales | $41,280 | $93,301 | $102,421 |
| Direct Cost of Sales | $19,546 | $38,927 | $41,274 |
| Other | $0 | $0 | $0 |
| Total Cost of Sales | $19,546 | $38,927 | $41,274 |
| Gross Margin | $21,735 | $54,374 | $61,148 |
| Gross Margin % | 52.65% | 58.28% | 59.70% |
| Expenses | |||
| Payroll | $36,000 | $36,000 | $36,000 |
| Sales and Marketing and Other Expenses | $600 | $600 | $600 |
| Depreciation | $768 | $768 | $764 |
| Leased Equipment | $0 | $0 | $0 |
| Utilities | $900 | $900 | $900 |
| Insurance | $720 | $720 | $720 |
| Rent | $0 | $0 | $0 |
| Payroll Taxes | $5,400 | $5,400 | $5,400 |
| Other | $0 | $0 | $0 |
| Total Operating Expenses | $44,388 | $44,388 | $44,384 |
| Profit Before Interest and Taxes | ($22,654) | $9,986 | $16,764 |
| EBITDA | ($21,886) | $10,754 | $17,528 |
| Interest Expense | $0 | $0 | $0 |
| Taxes Incurred | $0 | $2,497 | $4,261 |
| Net Profit | ($22,654) | $7,490 | $12,503 |
| Net Profit/Sales | -54.88% | 8.03% | 12.21% |
Projected Cash Flow
The following chart and table will indicate projected cash flow.

| Pro Forma Cash Flow | |||
| Year 1 | Year 2 | Year 3 | |
| Cash Received | |||
| Cash from Operations | |||
| Cash Sales | $41,280 | $93,301 | $102,421 |
| Subtotal Cash from Operations | $41,280 | $93,301 | $102,421 |
| Additional Cash Received | |||
| Sales Tax, VAT, HST/GST Received | $0 | $0 | $0 |
| New Current Borrowing | $0 | $0 | $0 |
| New Other Liabilities (interest-free) | $5,000 | $0 | $0 |
| New Long-term Liabilities | $0 | $0 | $0 |
| Sales of Other Current Assets | $0 | $0 | $0 |
| Sales of Long-term Assets | $0 | $0 | $0 |
| New Investment Received | $0 | $0 | $0 |
| Subtotal Cash Received | $46,280 | $93,301 | $102,421 |
| Expenditures | Year 1 | Year 2 | Year 3 |
| Expenditures from Operations | |||
| Cash Spending | $36,000 | $36,000 | $36,000 |
| Bill Payments | $23,711 | $48,467 | $52,816 |
| Subtotal Spent on Operations | $59,711 | $84,467 | $88,816 |
| Additional Cash Spent | |||
| Sales Tax, VAT, HST/GST Paid Out | $0 | $0 | $0 |
| Principal Repayment of Current Borrowing | $0 | $0 | $0 |
| Other Liabilities Principal Repayment | $0 | $2,500 | $2,500 |
| Long-term Liabilities Principal Repayment | $0 | $0 | $0 |
| Purchase Other Current Assets | $0 | $0 | $0 |
| Purchase Long-term Assets | $0 | $0 | $0 |
| Dividends | $0 | $0 | $0 |
| Subtotal Cash Spent | $59,711 | $86,967 | $91,316 |
| Net Cash Flow | ($13,431) | $6,334 | $11,105 |
| Cash Balance | $1,669 | $8,003 | $19,108 |
Projected Balance Sheet
The following table will indicate the projected balance sheet.
| Pro Forma Balance Sheet | |||
| Year 1 | Year 2 | Year 3 | |
| Assets | |||
| Current Assets | |||
| Cash | $1,669 | $8,003 | $19,108 |
| Other Current Assets | $0 | $0 | $0 |
| Total Current Assets | $1,669 | $8,003 | $19,108 |
| Long-term Assets | |||
| Long-term Assets | $2,300 | $2,300 | $2,300 |
| Accumulated Depreciation | $768 | $1,536 | $2,300 |
| Total Long-term Assets | $1,532 | $764 | $0 |
| Total Assets | $3,201 | $8,767 | $19,108 |
| Liabilities and Capital | Year 1 | Year 2 | Year 3 |
| Current Liabilities | |||
| Accounts Payable | $3,455 | $4,031 | $4,369 |
| Current Borrowing | $0 | $0 | $0 |
| Other Current Liabilities | $5,000 | $2,500 | $0 |
| Subtotal Current Liabilities | $8,455 | $6,531 | $4,369 |
| Long-term Liabilities | $0 | $0 | $0 |
| Total Liabilities | $8,455 | $6,531 | $4,369 |
| Paid-in Capital | $18,000 | $18,000 | $18,000 |
| Retained Earnings | ($600) | ($23,254) | ($15,764) |
| Earnings | ($22,654) | $7,490 | $12,503 |
| Total Capital | ($5,254) | $2,236 | $14,739 |
| Total Liabilities and Capital | $3,201 | $8,767 | $19,108 |
| Net Worth | ($5,253) | $2,236 | $14,739 |
Business Ratios
The following table contains ratios from the home water purification equipment industry, as determined by the Standard Industry Classification (SIC) Index code 3589, Service Industry Machinery, Not Elsewhere Classified.
| Ratio Analysis | ||||
| Year 1 | Year 2 | Year 3 | Industry Profile | |
| Sales Growth | n.a. | 126.02% | 9.77% | 8.10% |
| Percent of Total Assets | ||||
| Other Current Assets | 0.00% | 0.00% | 0.00% | 25.80% |
| Total Current Assets | 52.15% | 91.29% | 100.00% | 72.50% |
| Long-term Assets | 47.85% | 8.71% | 0.00% | 27.50% |
| Total Assets | 100.00% | 100.00% | 100.00% | 100.00% |
| Current Liabilities | 264.10% | 74.50% | 22.86% | 35.50% |
| Long-term Liabilities | 0.00% | 0.00% | 0.00% | 21.30% |
| Total Liabilities | 264.10% | 74.50% | 22.86% | 56.80% |
| Net Worth | -164.10% | 25.50% | 77.14% | 43.20% |
| Percent of Sales | ||||
| Sales | 100.00% | 100.00% | 100.00% | 100.00% |
| Gross Margin | 52.65% | 58.28% | 59.70% | 32.10% |
| Selling, General & Administrative Expenses | 94.45% | 45.91% | 43.48% | 17.80% |
| Advertising Expenses | 0.00% | 0.00% | 0.00% | 0.90% |
| Profit Before Interest and Taxes | -54.88% | 10.70% | 16.37% | 3.40% |
| Main Ratios | ||||
| Current | 0.20 | 1.23 | 4.37 | 2.12 |
| Quick | 0.20 | 1.23 | 4.37 | 1.20 |
| Total Debt to Total Assets | 264.10% | 74.50% | 22.86% | 56.80% |
| Pre-tax Return on Net Worth | 431.21% | 446.60% | 113.74% | 4.50% |
| Pre-tax Return on Assets | -707.62% | 113.90% | 87.73% | 10.40% |
| Additional Ratios | Year 1 | Year 2 | Year 3 | |
| Net Profit Margin | -54.88% | 8.03% | 12.21% | n.a |
| Return on Equity | 0.00% | 334.95% | 84.83% | n.a |
| Activity Ratios | ||||
| Accounts Payable Turnover | 7.86 | 12.17 | 12.17 | n.a |
| Payment Days | 27 | 28 | 29 | n.a |
| Total Asset Turnover | 12.89 | 10.64 | 5.36 | n.a |
| Debt Ratios | ||||
| Debt to Net Worth | 0.00 | 2.92 | 0.30 | n.a |
| Current Liab. to Liab. | 1.00 | 1.00 | 1.00 | n.a |
| Liquidity Ratios | ||||
| Net Working Capital | ($6,785) | $1,472 | $14,739 | n.a |
| Interest Coverage | 0.00 | 0.00 | 0.00 | n.a |
| Additional Ratios | ||||
| Assets to Sales | 0.08 | 0.09 | 0.19 | n.a |
| Current Debt/Total Assets | 264% | 74% | 23% | n.a |
| Acid Test | 0.20 | 1.23 | 4.37 | n.a |
| Sales/Net Worth | 0.00 | 41.73 | 6.95 | n.a |
| Dividend Payout | 0.00 | 0.00 | 0.00 | n.a |
Appendix
| Sales Forecast | |||||||||||||
| Month 1 | Month 2 | Month 3 | Month 4 | Month 5 | Month 6 | Month 7 | Month 8 | Month 9 | Month 10 | Month 11 | Month 12 | ||
| Sales | |||||||||||||
| Personal contacts | 0% | $0 | $784 | $1,025 | $1,354 | $3,204 | $3,654 | $3,841 | $4,215 | $4,687 | $5,124 | $5,325 | $5,878 |
| Recurring revenue stream | 0% | $0 | $0 | $0 | $0 | $0 | $125 | $135 | $187 | $265 | $365 | $458 | $654 |
| Total Sales | $0 | $784 | $1,025 | $1,354 | $3,204 | $3,779 | $3,976 | $4,402 | $4,952 | $5,489 | $5,783 | $6,532 | |
| Direct Cost of Sales | Month 1 | Month 2 | Month 3 | Month 4 | Month 5 | Month 6 | Month 7 | Month 8 | Month 9 | Month 10 | Month 11 | Month 12 | |
| Personal contacts | $0 | $392 | $513 | $677 | $1,602 | $1,827 | $1,921 | $2,108 | $2,344 | $2,562 | $2,663 | $2,939 | |
| Recurring revenue stream | $0 | $0 | $0 | $0 | $0 | $0 | $0 | $0 | $0 | $0 | $0 | $0 | |
| Subtotal Direct Cost of Sales | $0 | $392 | $513 | $677 | $1,602 | $1,827 | $1,921 | $2,108 | $2,344 | $2,562 | $2,663 | $2,939 | |
| Personnel Plan | |||||||||||||
| Month 1 | Month 2 | Month 3 | Month 4 | Month 5 | Month 6 | Month 7 | Month 8 | Month 9 | Month 10 | Month 11 | Month 12 | ||
| Aitch Tuoo | 0% | $3,000 | $3,000 | $3,000 | $3,000 | $3,000 | $3,000 | $3,000 | $3,000 | $3,000 | $3,000 | $3,000 | $3,000 |
| Other | 0% | $0 | $0 | $0 | $0 | $0 | $0 | $0 | $0 | $0 | $0 | $0 | $0 |
| Total People | 0 | 0 | 0 | 0 | 0 | 0 | 0 | 0 | 0 | 0 | 0 | 0 | |
| Total Payroll | $3,000 | $3,000 | $3,000 | $3,000 | $3,000 | $3,000 | $3,000 | $3,000 | $3,000 | $3,000 | $3,000 | $3,000 | |
| General Assumptions | |||||||||||||
| Month 1 | Month 2 | Month 3 | Month 4 | Month 5 | Month 6 | Month 7 | Month 8 | Month 9 | Month 10 | Month 11 | Month 12 | ||
| Plan Month | 1 | 2 | 3 | 4 | 5 | 6 | 7 | 8 | 9 | 10 | 11 | 12 | |
| Current Interest Rate | 10.00% | 10.00% | 10.00% | 10.00% | 10.00% | 10.00% | 10.00% | 10.00% | 10.00% | 10.00% | 10.00% | 10.00% | |
| Long-term Interest Rate | 10.00% | 10.00% | 10.00% | 10.00% | 10.00% | 10.00% | 10.00% | 10.00% | 10.00% | 10.00% | 10.00% | 10.00% | |
| Tax Rate | 30.00% | 25.00% | 25.00% | 25.00% | 25.00% | 25.00% | 25.00% | 25.00% | 25.00% | 25.00% | 25.00% | 25.00% | |
| Other | 0 | 0 | 0 | 0 | 0 | 0 | 0 | 0 | 0 | 0 | 0 | 0 | |
| Pro Forma Profit and Loss | |||||||||||||
| Month 1 | Month 2 | Month 3 | Month 4 | Month 5 | Month 6 | Month 7 | Month 8 | Month 9 | Month 10 | Month 11 | Month 12 | ||
| Sales | $0 | $784 | $1,025 | $1,354 | $3,204 | $3,779 | $3,976 | $4,402 | $4,952 | $5,489 | $5,783 | $6,532 | |
| Direct Cost of Sales | $0 | $392 | $513 | $677 | $1,602 | $1,827 | $1,921 | $2,108 | $2,344 | $2,562 | $2,663 | $2,939 | |
| Other | $0 | $0 | $0 | $0 | $0 | $0 | $0 | $0 | $0 | $0 | $0 | $0 | |
| Total Cost of Sales | $0 | $392 | $513 | $677 | $1,602 | $1,827 | $1,921 | $2,108 | $2,344 | $2,562 | $2,663 | $2,939 | |
| Gross Margin | $0 | $392 | $513 | $677 | $1,602 | $1,952 | $2,056 | $2,295 | $2,609 | $2,927 | $3,121 | $3,593 | |
| Gross Margin % | 0.00% | 50.00% | 50.00% | 50.00% | 50.00% | 51.65% | 51.70% | 52.12% | 52.68% | 53.32% | 53.96% | 55.01% | |
| Expenses | |||||||||||||
| Payroll | $3,000 | $3,000 | $3,000 | $3,000 | $3,000 | $3,000 | $3,000 | $3,000 | $3,000 | $3,000 | $3,000 | $3,000 | |
| Sales and Marketing and Other Expenses | $50 | $50 | $50 | $50 | $50 | $50 | $50 | $50 | $50 | $50 | $50 | $50 | |
| Depreciation | $64 | $64 | $64 | $64 | $64 | $64 | $64 | $64 | $64 | $64 | $64 | $64 | |
| Leased Equipment | $0 | $0 | $0 | $0 | $0 | $0 | $0 | $0 | $0 | $0 | $0 | $0 | |
| Utilities | $75 | $75 | $75 | $75 | $75 | $75 | $75 | $75 | $75 | $75 | $75 | $75 | |
| Insurance | $60 | $60 | $60 | $60 | $60 | $60 | $60 | $60 | $60 | $60 | $60 | $60 | |
| Rent | $0 | $0 | $0 | $0 | $0 | $0 | $0 | $0 | $0 | $0 | $0 | $0 | |
| Payroll Taxes | 15% | $450 | $450 | $450 | $450 | $450 | $450 | $450 | $450 | $450 | $450 | $450 | $450 |
| Other | $0 | $0 | $0 | $0 | $0 | $0 | $0 | $0 | $0 | $0 | $0 | $0 | |
| Total Operating Expenses | $3,699 | $3,699 | $3,699 | $3,699 | $3,699 | $3,699 | $3,699 | $3,699 | $3,699 | $3,699 | $3,699 | $3,699 | |
| Profit Before Interest and Taxes | ($3,699) | ($3,307) | ($3,187) | ($3,022) | ($2,097) | ($1,747) | ($1,644) | ($1,405) | ($1,091) | ($772) | ($579) | ($106) | |
| EBITDA | ($3,635) | ($3,243) | ($3,123) | ($2,958) | ($2,033) | ($1,683) | ($1,580) | ($1,341) | ($1,027) | ($708) | ($515) | ($42) | |
| Interest Expense | $0 | $0 | $0 | $0 | $0 | $0 | $0 | $0 | $0 | $0 | $0 | $0 | |
| Taxes Incurred | $0 | $0 | $0 | $0 | $0 | $0 | $0 | $0 | $0 | $0 | $0 | $0 | |
| Net Profit | ($3,699) | ($3,307) | ($3,187) | ($3,022) | ($2,097) | ($1,747) | ($1,644) | ($1,405) | ($1,091) | ($772) | ($579) | ($106) | |
| Net Profit/Sales | 0.00% | -421.81% | -310.88% | -223.19% | -65.45% | -46.23% | -41.34% | -31.91% | -22.02% | -14.06% | -10.00% | -1.62% | |
| Pro Forma Cash Flow | |||||||||||||
| Month 1 | Month 2 | Month 3 | Month 4 | Month 5 | Month 6 | Month 7 | Month 8 | Month 9 | Month 10 | Month 11 | Month 12 | ||
| Cash Received | |||||||||||||
| Cash from Operations | |||||||||||||
| Cash Sales | $0 | $784 | $1,025 | $1,354 | $3,204 | $3,779 | $3,976 | $4,402 | $4,952 | $5,489 | $5,783 | $6,532 | |
| Subtotal Cash from Operations | $0 | $784 | $1,025 | $1,354 | $3,204 | $3,779 | $3,976 | $4,402 | $4,952 | $5,489 | $5,783 | $6,532 | |
| Additional Cash Received | |||||||||||||
| Sales Tax, VAT, HST/GST Received | 0.00% | $0 | $0 | $0 | $0 | $0 | $0 | $0 | $0 | $0 | $0 | $0 | $0 |
| New Current Borrowing | $0 | $0 | $0 | $0 | $0 | $0 | $0 | $0 | $0 | $0 | $0 | $0 | |
| New Other Liabilities (interest-free) | $0 | $0 | $0 | $0 | $0 | $0 | $5,000 | $0 | $0 | $0 | $0 | $0 | |
| New Long-term Liabilities | $0 | $0 | $0 | $0 | $0 | $0 | $0 | $0 | $0 | $0 | $0 | $0 | |
| Sales of Other Current Assets | $0 | $0 | $0 | $0 | $0 | $0 | $0 | $0 | $0 | $0 | $0 | $0 | |
| Sales of Long-term Assets | $0 | $0 | $0 | $0 | $0 | $0 | $0 | $0 | $0 | $0 | $0 | $0 | |
| New Investment Received | $0 | $0 | $0 | $0 | $0 | $0 | $0 | $0 | $0 | $0 | $0 | $0 | |
| Subtotal Cash Received | $0 | $784 | $1,025 | $1,354 | $3,204 | $3,779 | $8,976 | $4,402 | $4,952 | $5,489 | $5,783 | $6,532 | |
| Expenditures | Month 1 | Month 2 | Month 3 | Month 4 | Month 5 | Month 6 | Month 7 | Month 8 | Month 9 | Month 10 | Month 11 | Month 12 | |
| Expenditures from Operations | |||||||||||||
| Cash Spending | $3,000 | $3,000 | $3,000 | $3,000 | $3,000 | $3,000 | $3,000 | $3,000 | $3,000 | $3,000 | $3,000 | $3,000 | |
| Bill Payments | $21 | $648 | $1,031 | $1,153 | $1,343 | $2,245 | $2,465 | $2,562 | $2,750 | $2,986 | $3,200 | $3,307 | |
| Subtotal Spent on Operations | $3,021 | $3,648 | $4,031 | $4,153 | $4,343 | $5,245 | $5,465 | $5,562 | $5,750 | $5,986 | $6,200 | $6,307 | |
| Additional Cash Spent | |||||||||||||
| Sales Tax, VAT, HST/GST Paid Out | $0 | $0 | $0 | $0 | $0 | $0 | $0 | $0 | $0 | $0 | $0 | $0 | |
| Principal Repayment of Current Borrowing | $0 | $0 | $0 | $0 | $0 | $0 | $0 | $0 | $0 | $0 | $0 | $0 | |
| Other Liabilities Principal Repayment | $0 | $0 | $0 | $0 | $0 | $0 | $0 | $0 | $0 | $0 | $0 | $0 | |
| Long-term Liabilities Principal Repayment | $0 | $0 | $0 | $0 | $0 | $0 | $0 | $0 | $0 | $0 | $0 | $0 | |
| Purchase Other Current Assets | $0 | $0 | $0 | $0 | $0 | $0 | $0 | $0 | $0 | $0 | $0 | $0 | |
| Purchase Long-term Assets | $0 | $0 | $0 | $0 | $0 | $0 | $0 | $0 | $0 | $0 | $0 | $0 | |
| Dividends | $0 | $0 | $0 | $0 | $0 | $0 | $0 | $0 | $0 | $0 | $0 | $0 | |
| Subtotal Cash Spent | $3,021 | $3,648 | $4,031 | $4,153 | $4,343 | $5,245 | $5,465 | $5,562 | $5,750 | $5,986 | $6,200 | $6,307 | |
| Net Cash Flow | ($3,021) | ($2,864) | ($3,006) | ($2,799) | ($1,139) | ($1,466) | $3,511 | ($1,160) | ($798) | ($497) | ($417) | $225 | |
| Cash Balance | $12,079 | $9,215 | $6,209 | $3,410 | $2,271 | $805 | $4,316 | $3,157 | $2,358 | $1,861 | $1,444 | $1,669 | |
| Pro Forma Balance Sheet | |||||||||||||
| Month 1 | Month 2 | Month 3 | Month 4 | Month 5 | Month 6 | Month 7 | Month 8 | Month 9 | Month 10 | Month 11 | Month 12 | ||
| Assets | Starting Balances | ||||||||||||
| Current Assets | |||||||||||||
| Cash | $15,100 | $12,079 | $9,215 | $6,209 | $3,410 | $2,271 | $805 | $4,316 | $3,157 | $2,358 | $1,861 | $1,444 | $1,669 |
| Other Current Assets | $0 | $0 | $0 | $0 | $0 | $0 | $0 | $0 | $0 | $0 | $0 | $0 | $0 |
| Total Current Assets | $15,100 | $12,079 | $9,215 | $6,209 | $3,410 | $2,271 | $805 | $4,316 | $3,157 | $2,358 | $1,861 | $1,444 | $1,669 |
| Long-term Assets | |||||||||||||
| Long-term Assets | $2,300 | $2,300 | $2,300 | $2,300 | $2,300 | $2,300 | $2,300 | $2,300 | $2,300 | $2,300 | $2,300 | $2,300 | $2,300 |
| Accumulated Depreciation | $0 | $64 | $128 | $192 | $256 | $320 | $384 | $448 | $512 | $576 | $640 | $704 | $768 |
| Total Long-term Assets | $2,300 | $2,236 | $2,172 | $2,108 | $2,044 | $1,980 | $1,916 | $1,852 | $1,788 | $1,724 | $1,660 | $1,596 | $1,532 |
| Total Assets | $17,400 | $14,315 | $11,387 | $8,317 | $5,454 | $4,251 | $2,721 | $6,168 | $4,945 | $4,082 | $3,521 | $3,040 | $3,201 |
| Liabilities and Capital | Month 1 | Month 2 | Month 3 | Month 4 | Month 5 | Month 6 | Month 7 | Month 8 | Month 9 | Month 10 | Month 11 | Month 12 | |
| Current Liabilities | |||||||||||||
| Accounts Payable | $0 | $614 | $993 | $1,109 | $1,268 | $2,162 | $2,380 | $2,470 | $2,651 | $2,879 | $3,090 | $3,188 | $3,455 |
| Current Borrowing | $0 | $0 | $0 | $0 | $0 | $0 | $0 | $0 | $0 | $0 | $0 | $0 | $0 |
| Other Current Liabilities | $0 | $0 | $0 | $0 | $0 | $0 | $0 | $5,000 | $5,000 | $5,000 | $5,000 | $5,000 | $5,000 |
| Subtotal Current Liabilities | $0 | $614 | $993 | $1,109 | $1,268 | $2,162 | $2,380 | $7,470 | $7,651 | $7,879 | $8,090 | $8,188 | $8,455 |
| Long-term Liabilities | $0 | $0 | $0 | $0 | $0 | $0 | $0 | $0 | $0 | $0 | $0 | $0 | $0 |
| Total Liabilities | $0 | $614 | $993 | $1,109 | $1,268 | $2,162 | $2,380 | $7,470 | $7,651 | $7,879 | $8,090 | $8,188 | $8,455 |
| Paid-in Capital | $18,000 | $18,000 | $18,000 | $18,000 | $18,000 | $18,000 | $18,000 | $18,000 | $18,000 | $18,000 | $18,000 | $18,000 | $18,000 |
| Retained Earnings | ($600) | ($600) | ($600) | ($600) | ($600) | ($600) | ($600) | ($600) | ($600) | ($600) | ($600) | ($600) | ($600) |
| Earnings | $0 | ($3,699) | ($7,006) | ($10,193) | ($13,215) | ($15,312) | ($17,059) | ($18,702) | ($20,107) | ($21,197) | ($21,969) | ($22,548) | ($22,654) |
| Total Capital | $17,400 | $13,701 | $10,394 | $7,208 | $4,186 | $2,089 | $342 | ($1,302) | ($2,707) | ($3,797) | ($4,569) | ($5,148) | ($5,254) |
| Total Liabilities and Capital | $17,400 | $14,315 | $11,387 | $8,317 | $5,454 | $4,251 | $2,721 | $6,168 | $4,945 | $4,082 | $3,521 | $3,040 | $3,201 |
| Net Worth | $17,400 | $13,701 | $10,394 | $7,208 | $4,186 | $2,089 | $342 | ($1,302) | ($2,706) | ($3,797) | ($4,569) | ($5,147) | ($5,253) |

