
Earthly Clean
Executive Summary
Earthly Clean is a start-up organization using the multi-level marketing (MLM) business model to sell environmentally friendly cleaning products. Earthly Clean has been founded by Devon McGregor. The company has been registered as an Illinois LLC.
The Products
Earthly Clean sells a complete line of non-toxic, environmentally friendly cleaning supplies for all possible household uses. Earthly Clean is finalizing a contactual agreement with a major cleaning supply manufacturer for the production of a complete line of private label products. Product prices will be quite competitive since Earthly Clean is buying direct from the manufacturer. Another feature of this relationship which is of significant value to Earthly Clean is the willingness of the manufacturer to allow Earthly Clean to place orders as small as $150. This will assist Earthly Clean in their goal of efficient inventory management. Products that will be part of the initial product line include: all purpose soap, bathroom cleaner, basin/tub and tile cleaner, detergent, window cleaner, bleach, laundry liquid and a variety of different air fresheners. Earthly Clean is able to offer competitively priced products that are of the highest quality.
The Market
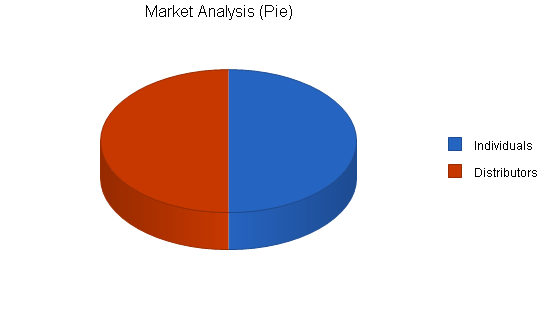
Earthly Clean will sell products to two customer segments. The first segment are individual consumers who are purchasing the products for personal (household) use. These individuals are environmentally conscious consumers who are looking for non-toxic cleaners for their home. demographics for this group are younger, politically liberal people who are interested in making an individual contribution to the betterment of our environment.
The second target segment is a select group from within the first segment of individual customers. Some of these individuals will be recruited to become distributors of Earthly Clean products. A distributor is a person who sells the Earthly Clean products on their own to their own set of customers. This segment is taken from the actual consumers that purchase and use products. This creates a sales force that passionately believes in the products that they sell. The distributors that make up this segment receive a sales commission if they are able to recruit new distributors who then make sales. This is how the MLM business model works. Earthly Clean sells to consumers, some of those consumers then become distributors earning revenue for Earthly Clean as well as themselves. If these new distributors attract more people to sell, they then make money on their specific sales as well as money on everything that their recruited sales people sell.
An Efficient Distribution Model
This is an efficient and effective distribution model where the products are purchased private label direct from the manufacturer ensuring the highest quality and low prices. They are then sold direct to the consumer. The traditional bureaucratic distribution model with huge corporate profits is eliminated. MLM businesses are often confused with pyramid schemes which are illegal in the U.S.
Pyramid schemes are business forms that offer compensation specifically for the recruitment of new sellers. People are promised economic rewards for the more people they recruit, independent of what these people sell. Herein lies the crucial distinction that regulatory authorities analyze when determining if a business is a pyramid scheme: the way compensation is rewarded. If it is based on recruitment it is presumed illegal. Earthly Clean only compensates distributors for sales, an effective and efficient sales and distribution system.
Earthly Clean is an exciting new business that channels individuals’ passion for making a positive contribution to the environment and the ability to make money while sharing this passion with friends and colleagues. By carefully using the efficient multi-level marketing business model, Earthly Clean will quickly generate sustainable revenue. Sales forecasts indicate that sales for years two and three respectively will be $90,000 and $125,000. Net profit for the same years will reach 4.19% and 8.66%.

1.1 Mission
Earthly Clean’s mission is the development of a environmentally friendly distribution company that uses grassroots and network marketing techniques to sell the product and make a meaningful contribution to the environment. Earthly Clean exists to support its members and to support the environment.
1.2 Objectives
- To create a profitable company that sells environmentally friendly cleaning products.
- Design an organization that compensates individuals for sales made by other people that they recruit.
- Design a more efficient marketing machine that does away with the inefficient traditional distribution systems.
1.3 Keys to Success
- Distribute only quality, environmentally friendly products.
- Recruit new people to assist in the sales of the products.
- Build the company on a solid basis of integrity.
Company Summary
Earthly Clean has been formed as an Illinois registered LLC. The company has been founded by Devon McGregor. The company exists to distribute environmentally friendly cleaning supplies through an efficient, networking distribution system.
2.1 Start-up Summary
Earthly Clean has incurred the following expenses for the start-up phases of the organization:
- Storage space: This will be used for the storage of product inventory. While Earthly Clean could get away with a smaller space such as a closet in Devon’s home, he is able to achieve costs breaks by purchasing larger quantities and will take these discounts and place the inventory in storage.
- Service provider fees: Earthly Clean has incurred both accountant and attorney fees in the set up of the business. The accountant will set up the PeachTree accounting system and the attorney will develop and register the business formation as well as draft some sale agreements for distributors.
- Computer system: The computer system will be used for correspondence, accounting purposes as well as to develop marketing and sales information. The system will include a laptop computer, printer, fax/scanner, and a broadband Internet connection. Earthly Clean will use Microsoft Office and PeachTree Accounting as their preferred software.
- Assorted types of paper and stationery: Personalized with a logo, return addresses, etc. for catalogs, and brochures.
- Assorted office furniture and accessories: The office will be located in Devon’s house.

| Start-up Funding | |
| Start-up Expenses to Fund | $9,140 |
| Start-up Assets to Fund | $40,860 |
| Total Funding Required | $50,000 |
| Assets | |
| Non-cash Assets from Start-up | $5,000 |
| Cash Requirements from Start-up | $35,860 |
| Additional Cash Raised | $0 |
| Cash Balance on Starting Date | $35,860 |
| Total Assets | $40,860 |
| Liabilities and Capital | |
| Liabilities | |
| Current Borrowing | $0 |
| Long-term Liabilities | $20,000 |
| Accounts Payable (Outstanding Bills) | $0 |
| Other Current Liabilities (interest-free) | $0 |
| Total Liabilities | $20,000 |
| Capital | |
| Planned Investment | |
| Family & Friends | $20,000 |
| D. McGregor | $10,000 |
| Additional Investment Requirement | $0 |
| Total Planned Investment | $30,000 |
| Loss at Start-up (Start-up Expenses) | ($9,140) |
| Total Capital | $20,860 |
| Total Capital and Liabilities | $40,860 |
| Total Funding | $50,000 |
| Start-up | |
| Requirements | |
| Start-up Expenses | |
| Professional service providers | $4,000 |
| Paper products | $250 |
| Website development | $2,000 |
| Storage rental | $165 |
| Expensed Equipment – Computer system | $2,500 |
| Insurance | $75 |
| Rent | $150 |
| Total Start-up Expenses | $9,140 |
| Start-up Assets | |
| Cash Required | $35,860 |
| Other Current Assets | $0 |
| Long-term Assets | $5,000 |
| Total Assets | $40,860 |
| Total Requirements | $50,000 |
2.2 Company Ownership
Earthly Clean is solely owned by Devon McGregor. In addition to his own investment Devon has received an investment from friends and family as well as a long-term bank loan.
Products
Earthly Clean sells a wide range of private label environmentally friendly cleaning products. All products are designed to be effective at cleaning, yet easy and non-toxic on the environment. Earthly Clean has contracted with a large national producer of environmentally friendly products to manufacture these products with the Earthly Clean private label. This vendor was chosen because of their quality products as well as their flexibility in offering low minimum orders ($150). The following are the initial products that Earthly Clean will offer. As the company grows they will consider adding new items to the product list as demanded by the market:
Brought to you by
Create a professional business plan
Using AI and step-by-step instructions
Create Your PlanSecure funding
Validate ideas
Build a strategy
- All purpose soap: A concentrated formula for washing walls, floors, cabinets, and all other washable surfaces. Orange oil and sodium citrate based.
- Bathroom cleaner: Quickly and easily removes dirt and grime, cleaning and deodorizing the entire house. An all vegetable-based cleaning agent.
- Basin, tub & tile cleaner: Effective at removing soap scum from all surfaces. Citric acid, glycolic acid and orange oil.
- Dishwashing detergent: Easy on hands, tough on cleaning. A mild coconut oil based detergent.
- Window cleaner: A streak free cleaner. Citrus based, either orange of lemon.
- Oxygen bleach cleaner: A wonderful cleaner that works on sinks and bathtubs. Made from sodium percarbonate, calcium carbonate, soda ash, and sodium sulfate.
- Laundry liquid: Concentrated, biodegradable, natural cleaner for laundry. This is a vegetable-based surfactant detergent.
- Air fresheners: Natural, healthful, eco-mists containing essential oils, emulsifiers, and water. Available scents include, wild cherry, vanilla and hazelnut, citrus, lavender, and natural fruit.
Environmental cleaning products were chosen for a several reasons:
- It allows the participating individuals to make a positive contribution to the protection of the environment.
- The environmentally friendly cleaning industry is in its infancy in terms of growth. It is on the verge of market wide acceptance as more and more people are participating in activities that take into account environmental impacts.
- The MLM and environmental cleaning products is a perfect combination as it combines emotional, and economic factors in a selling opportunity to friends and other network contacts. The seller has an emotional reason for selling the products. They also have an economic incentive because if they find additional people to help sell the product then they get additional commissions on product the new people sell.
Because Earthly Clean buys private label goods direct from the manufacturer, even after paying out the sales commissions, their products are competitively priced. This is achieved through the private label procurement as well as the more efficient, grassroots system of distribution.
3.1 Business Model
Earthly Clean will use a multi-level marketing approach (MLM) to the sale of these products. An MLM approach is a grassroots networking based approach where products are sold direct from an individual (distributor) to the end consumer. The distributor receives the products from Earthly Clean who buys direct from the manufacturer. When a distributor is able to recruit a new person to sell these products (new distributor) then the “recruiter” receives a sales commission for all of the sales made by person #2. If person #2 is able to recruit another distributor (person #3) then both the original distributor and distributor #2 receive commissions from sales generated by person #3.
The MLM system in essence leverages peoples relationships and networking skills. It creates the ability to be your own boss, making sales pitches to friends and associates on your time schedule. It creates a common man, grassroots implementation of a real world distribution channel.
This arrangement differs significantly from pyramid schemes which are illegal in the United States. A pyramid scheme is a system where individuals sell products and get commissions from the recruitment of new people to also sell the products. The more people they recruit, the more money they make. Pyramid schemes are illegal and are broken up when they are found to exist. The regulatory analysis that is applied to determine if the business is a MLM or a pyramid scheme is as follows:
- Is the compensation merely for introduction of additional participants into the program;
- Or is the compensation related to the sale of goods.
If regulators believe the business is more like #1 it will be found illegal, against public policy, and shut down.
As it stands, Earthly Clean is clearly a MLM venture as participants get compensated for the products others sell, not for the specific recruitment of individuals.
Market Analysis Summary
Earthly Clean has identified two distinct type of customers. The first customer type is the end user of the cleaning products. These are people with an environmental consciousness in need of appropriate cleaning supplies.
The second customer group is comprised of a select number of people from the first group with an interest in becoming distributors of the cleaning products. The following sections will provide more detailed information regarding these two groups.
4.1 Market Segmentation
Earthly Clean has identified two groups of customers who are the most attractive marketing prospects.
- Consumers of environmentally friendly cleaning products.
- Members of the consumer group who are interested in being product distributors.
Individual consumers
These are people who are looking for products that will reduce their individual impact on the environment. Cleaning products are an excellent product category to concentrate on since they can be particularly abrasive to the environment. Some demographic information for this group is as follows:
- Ages 23-48
- Median household income of $41,000
- 22% of the people commute by bicycle or use mass transportation
- 97% of the people are active recyclers
- The majority routinely consider what consequences their choices or actions will have on the environment.
- 41% are vegetarian
- 93% are registered Democrats
Distributors
A distributor is an individual consumer who is interested in also selling the products. In the world of MLM, the sellers are called distributors because they are essentially doing the activities that a distributor would do in a more traditional distribution channel. These individuals have a passion for the product and the time to sell the product to their friends.
- 89% of the people will take on the role of distributor in addition to their already existing part or full time employment.
- They see the chance of selling Earthly Clean as an opportunity to do something that they are passionate about (positive environmental actions) as well as a means of making supplemental income.
- 87% of the distributors will have the goal of signing up more distributors and establish an additional source of revenue.
| Market Analysis | |||||||
| Year 1 | Year 2 | Year 3 | Year 4 | Year 5 | |||
| Potential Customers | Growth | CAGR | |||||
| Individuals | 6% | 2,455 | 2,602 | 2,758 | 2,923 | 3,098 | 5.99% |
| Distributors | 5% | 2,455 | 2,578 | 2,707 | 2,842 | 2,984 | 5.00% |
| Total | 5.50% | 4,910 | 5,180 | 5,465 | 5,765 | 6,082 | 5.50% |
4.2 Target Market Segment Strategy
The two enumerated customer segments are particularly attractive because they represent people who are most likely to be consumers of environmentally friendly cleaning supplies. The individual consumers have a sensitive perspective toward the environment and are looking for a way that they can have a positive impact on the environment. Recognizing that so many traditional cleaning agents are toxic for the environment, it then becomes relatively easy for the individuals to make a positive contribution. This attitude follows the slogan “think globally, act locally.” Buying these products allows them to do their part.
The distributors are individual consumers who have an even stronger conviction and belief in the products as well as the time to sell the products and find potential people to recruit into the distribution effort. To be a distributor does not require a huge sacrifice of time, the majority of distributors will have full-time jobs in addition to marketing Earthly Clean. This makes the job of distributor all that more attractive, the person is able to balance their already existing job with another source of revenue and personal satisfaction.
4.3 Industry Analysis
Earthly Clean arguably participates in two industries, the product industry of environmentally friendly cleaning supplies and the business model industry of MLM. The environmentally friendly cleaning supply industry is small but just now beginning to develop momentum. These supplies are typically sold in health food type stores. These stores generally sell a smaller variety than what Earthly Clean sells, they have just the basics. Some larger retailers such as Safeway and Alberston’s are beginning to carry one or two products, typically an all purpose cleaner and a washing machine liquid. As the market demands more outlets for these products it is likely that more retailers will begin to sell environmentally friendly cleaning products.
Brought to you by
Create a professional business plan
Using AI and step-by-step instructions
Create Your PlanSecure funding
Validate ideas
Build a strategy
Earthly Clean also participates within the multi-level marketing industry. However Earthly Clean does not, per se, compete within this industry. Currently, market research has yet to find an MLM company that sells environmentally friendly cleaning products. The largest and most well known MLM company is Amway which sells a wide range of products. Amway is different from Earthly Clean in the sense that the majority of products that they sell are branded rather than private label products. While that is beneficial for Amway in that they are able to use the manufacturer’s marketing efforts to assist in sales, Amway is often not that cost competitive.
4.3.1 Competition and Buying Patterns
Earthly Clean faces competition from several sources:
- Local and national health food stores: These stores typically have a small selection of cleaning products. National competitors include:
- Whole Foods
- Wild Oats
- Large supermarkets: These competitors have a very limited selection
- Mail order/Internet sales: These are remote retail companies that sell a range of products. More often than not these companies sell national brands as opposed to private label goods. Competitors include:
- mothernature.com
- thegoodearth.com
Strategy and Implementation Summary
Earthly Clean will leverage their multi-pronged competitive edge of a quality product, competitive pricing, and a grassroots, non-corporate business model. These three advantages will resonate with the target market.
Earthly Clean will have a marketing strategy that will focus on the green or environmentally friendly aspect of their products, the fact that profits go to support a green, grassroots organization instead of a large corporation, and lastly, the opportunity for the consumer to take a more active role with the company with the possibility for an additional source of income.
Earthly Clean’s sales strategy will focus on the high quality products offered and the ability to offer 100% customer satisfaction, ensuring a happy customer constituency.
5.1 Competitive Edge
Earthly Clean’s has identified a multi faceted competitive edge that will assist them in their fast market penetration.
- Quality products: All of the products sold by Earthly Clean are manufactured by a leading company, made for Earthly Clean to their specifications. This allows Earthly Clean to offer a very competitive product that meets the needs of the market.
- Competitive pricing: Earthly Clean is able to offer great pricing because they are purchasing the products directly from the manufacturer. While Earthly Clean pays out sale commissions to the various layers of distributors, this grassroots distribution model is still more efficient than the traditional distribution channel, keeping prices competitive.
- Grassroots, non-corporate business model: Instead of profits going to a large corporation, the profits are dispersed among the user distributors that assist Earthly Clean. This arrangement is quite rare, and attractive for the targeted customer segment.
5.2 Marketing Strategy
The marketing strategy is based on the need to generate visibility for Earthly Clean as a company that offers the following advantages:
- A wide selection of green products.
- Profits that go to environmentally friendly people, not a large corporation.
- The opportunity for users to become distributors, realizing an additional source of revenue.
The marketing strategy is one based on grassroots networking. This strategy is most effective when the person selling the products is passionate about what they are selling. This is specifically why environmentally friendly cleaning products were chosen, it is easy for people who care about the environment to be passionate about the products.
Networking is the key to increased visibility and distribution. Networking will take place in a number of venues including: the traditional work environment, social organizations (such as the Lions Club), religious organizations, and other gatherings/situations that bring people together. The distributor sets up a meeting with the prospective person (someone they generally already know and have some sort of relationship with), shows them the product catalog and provides them with samples. Once the consumer has had a chance to use the products and been impressed by them, another meeting can be scheduled to determine if the person is interested in making a purchase, and/or is interested in an additional source of income selling these environmentally friendly products.
5.3 Sales Strategy
Earthly Clean’s sales strategy will emphasize their high quality products and 100% customer satisfaction. By combining these two benefits, consumers are able to try the available products risk free. This provides them with the opportunity to test them out and determine if they are as good as they claim to be. Once the consumer has recognized the outstanding quality that Earthly Clean offers, the option of becoming a distributor becomes all the more attractive. If the consumer truly believes in the product, then it becomes that much easier to convince them that there is an excellent opportunity available that allows them to sell a product that they believe in, obtain an additional source of revenue, and make a positive impact on the environment. All of this will be done on a grassroots, one-to-one level.
5.3.1 Sales Forecast
Earthly Clean will be tracking both the sales to the individual consumers and the revenue received through commissions from sales from the various distributors. The forecast indicates that initially the bulk of revenue will be from sales to the individual customers. As time progresses and more distributors are secured, the amount of revenue from the distributors will increase. Earthly Clean has adopted a reasonably conservative sales forecast. Please review the following table and charts for a graphical representation of sales.


| Sales Forecast | |||
| Year 1 | Year 2 | Year 3 | |
| Sales | |||
| Individuals | $15,205 | $29,650 | $54,852 |
| Distributors | $4,706 | $9,176 | $16,975 |
| Total Sales | $19,911 | $38,826 | $71,827 |
| Direct Cost of Sales | Year 1 | Year 2 | Year 3 |
| Individuals | $4,562 | $8,895 | $16,456 |
| Distributors | $1,412 | $2,753 | $5,093 |
| Subtotal Direct Cost of Sales | $5,973 | $11,648 | $21,548 |
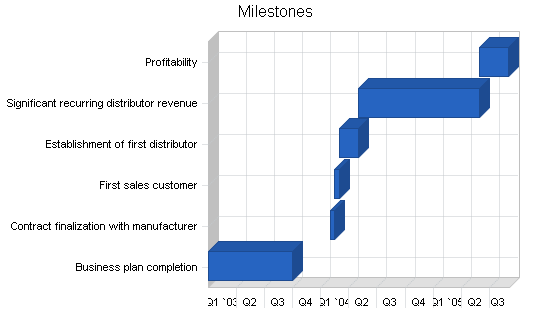
5.4 Milestones
Earthly Cleaning has identified several milestones which will be used as goals for the organization. Milestones were chosen to be as quantifiable as possible to aid in achievement. The following table details the specific milestones and provides a time frame for the accomplishment of each one.
| Milestones | |||||
| Milestone | Start Date | End Date | Budget | Manager | Department |
| Business plan completion | 1/1/2003 | 10/1/2003 | $0 | Devon | Business Development |
| Contract finalization with manufacturer | 2/1/2004 | 2/15/2004 | $0 | Devon | Business Development |
| First sales customer | 2/15/2004 | 3/1/2004 | $0 | Devon | Sales |
| Establishment of first distributor | 3/1/2004 | 5/1/2004 | $0 | Devon | Sales |
| Significant recurring distributor revenue | 5/1/2004 | 5/30/2005 | $0 | Devon | Accounting |
| Profitability | 5/30/2005 | 9/1/2005 | $0 | Devon | Sales |
| Totals | $0 | ||||
Web Plan Summary
A website site will be created to offer viewers an extensive product catalog as well as information regarding the company and the availability of distributor options. The site will contain extensive information, however it will encourage viewers to contact Earthly Clean for more information as Devon recognizes that he can be far more effective in sales if he as an opportunity to chat with the interested party. The website will be periodically updated with new information.
6.1 Website Marketing Strategy
The website will be marketed in two ways:
- Submission of the site to various search engines to ensure that people looking for the site using a search engine such as Yahoo! will easily find www.earthlyclean.com.
- All printed material such as brochures, advertising, catalogs, price sheets, packaging, and all product labels will have the URL prominently displayed. This will be especially useful because it allows customers who may have only one product the opportunity to view the entire product selection through the convenience of the Internet.
6.2 Development Requirements
The website will be developed and periodically updated by a University of Chicago Computer Science student.
Brought to you by
Create a professional business plan
Using AI and step-by-step instructions
Create Your PlanSecure funding
Validate ideas
Build a strategy
Management Summary
Earthly Clean has been founded and will be run by Devon McGregor.
He has an undergraduate degree in business from Loyola University, and one year of post graduate course work in biology and pharmaceuticals.
Work experience includes eight years with Eli Lilly as a pharmaceutical sales representative, earning many sales leader awards.
Seeking a position in sales that offered the satisfaction of interpersonal interaction, a positive impact on society, and a minimal amount of travel, Devon began researching the multi-level marketing business model. After rejecting participation in other existing MLM businesses, he decided to establish his own organization and chose environmentally safe cleaning supplies as his product line.
7.1 Personnel Plan
Devon McGregor will be the only employee of Earthly Clean. Other individuals involved will be distributors and compensated in the form of sales commissions. The payment of the sales commission is recognized as a cost of sales under the sales forecast.
| Personnel Plan | |||
| Year 1 | Year 2 | Year 3 | |
| Devon | $20,000 | $24,000 | $24,000 |
| Other | $0 | $0 | $0 |
| Total People | 1 | 1 | 1 |
| Total Payroll | $20,000 | $24,000 | $24,000 |
Financial Plan
The following section will outline important financial information.
8.1 Important Assumptions
The following table details important Financial Assumptions.
| General Assumptions | |||
| Year 1 | Year 2 | Year 3 | |
| Plan Month | 1 | 2 | 3 |
| Current Interest Rate | 10.00% | 10.00% | 10.00% |
| Long-term Interest Rate | 10.00% | 10.00% | 10.00% |
| Tax Rate | 30.00% | 30.00% | 30.00% |
| Other | 0 | 0 | 0 |
8.2 Break-even Analysis
The Break-even Analysis indicates that approximately $3,500 is needed in monthly revenue to reach the break-even point.

| Break-even Analysis | |
| Monthly Revenue Break-even | $3,542 |
| Assumptions: | |
| Average Percent Variable Cost | 30% |
| Estimated Monthly Fixed Cost | $2,480 |
8.3 Projected Profit and Loss
The following table and charts illustrate the Projected Profit and Loss.


| Pro Forma Profit and Loss | |||
| Year 1 | Year 2 | Year 3 | |
| Sales | $19,911 | $38,826 | $71,827 |
| Direct Cost of Sales | $5,973 | $11,648 | $21,548 |
| Other Costs of Goods | $0 | $0 | $0 |
| Total Cost of Sales | $5,973 | $11,648 | $21,548 |
| Gross Margin | $13,937 | $27,178 | $50,279 |
| Gross Margin % | 70.00% | 70.00% | 70.00% |
| Expenses | |||
| Payroll | $20,000 | $24,000 | $24,000 |
| Sales and Marketing and Other Expenses | $2,400 | $0 | $0 |
| Depreciation | $996 | $996 | $996 |
| Rent | $1,800 | $1,800 | $1,800 |
| Utilities | $660 | $660 | $660 |
| Insurance | $900 | $900 | $900 |
| Payroll Taxes | $3,000 | $3,600 | $3,600 |
| Total Operating Expenses | $29,756 | $31,956 | $31,956 |
| Profit Before Interest and Taxes | ($15,819) | ($4,778) | $18,323 |
| EBITDA | ($14,823) | ($3,782) | $19,319 |
| Interest Expense | $1,903 | $1,730 | $1,550 |
| Taxes Incurred | $0 | $0 | $5,032 |
| Net Profit | ($17,721) | ($6,508) | $11,741 |
| Net Profit/Sales | -89.00% | -16.76% | 16.35% |
8.4 Projected Cash Flow
The following table and chart presents the Projected Cash Flow.

| Pro Forma Cash Flow | |||
| Year 1 | Year 2 | Year 3 | |
| Cash Received | |||
| Cash from Operations | |||
| Cash Sales | $4,978 | $9,706 | $17,957 |
| Cash from Receivables | $9,199 | $23,672 | $44,367 |
| Subtotal Cash from Operations | $14,177 | $33,379 | $62,324 |
| Additional Cash Received | |||
| Sales Tax, VAT, HST/GST Received | $0 | $0 | $0 |
| New Current Borrowing | $0 | $0 | $0 |
| New Other Liabilities (interest-free) | $0 | $0 | $0 |
| New Long-term Liabilities | $0 | $0 | $0 |
| Sales of Other Current Assets | $0 | $0 | $0 |
| Sales of Long-term Assets | $0 | $0 | $0 |
| New Investment Received | $0 | $0 | $0 |
| Subtotal Cash Received | $14,177 | $33,379 | $62,324 |
| Expenditures | Year 1 | Year 2 | Year 3 |
| Expenditures from Operations | |||
| Cash Spending | $20,000 | $24,000 | $24,000 |
| Bill Payments | $14,499 | $20,803 | $33,878 |
| Subtotal Spent on Operations | $34,499 | $44,803 | $57,878 |
| Additional Cash Spent | |||
| Sales Tax, VAT, HST/GST Paid Out | $0 | $0 | $0 |
| Principal Repayment of Current Borrowing | $0 | $0 | $0 |
| Other Liabilities Principal Repayment | $0 | $0 | $0 |
| Long-term Liabilities Principal Repayment | $1,800 | $1,800 | $1,800 |
| Purchase Other Current Assets | $0 | $0 | $0 |
| Purchase Long-term Assets | $0 | $0 | $0 |
| Dividends | $0 | $0 | $0 |
| Subtotal Cash Spent | $36,299 | $46,603 | $59,678 |
| Net Cash Flow | ($22,122) | ($13,225) | $2,646 |
| Cash Balance | $13,738 | $514 | $3,160 |
8.5 Projected Balance Sheet
The following table shows the Projected Balance Sheet.
| Pro Forma Balance Sheet | |||
| Year 1 | Year 2 | Year 3 | |
| Assets | |||
| Current Assets | |||
| Cash | $13,738 | $514 | $3,160 |
| Accounts Receivable | $5,734 | $11,181 | $20,685 |
| Other Current Assets | $0 | $0 | $0 |
| Total Current Assets | $19,472 | $11,694 | $23,844 |
| Long-term Assets | |||
| Long-term Assets | $5,000 | $5,000 | $5,000 |
| Accumulated Depreciation | $996 | $1,992 | $2,988 |
| Total Long-term Assets | $4,004 | $3,008 | $2,012 |
| Total Assets | $23,476 | $14,702 | $25,856 |
| Liabilities and Capital | Year 1 | Year 2 | Year 3 |
| Current Liabilities | |||
| Accounts Payable | $2,137 | $1,672 | $2,884 |
| Current Borrowing | $0 | $0 | $0 |
| Other Current Liabilities | $0 | $0 | $0 |
| Subtotal Current Liabilities | $2,137 | $1,672 | $2,884 |
| Long-term Liabilities | $18,200 | $16,400 | $14,600 |
| Total Liabilities | $20,337 | $18,072 | $17,484 |
| Paid-in Capital | $30,000 | $30,000 | $30,000 |
| Retained Earnings | ($9,140) | ($26,861) | ($33,369) |
| Earnings | ($17,721) | ($6,508) | $11,741 |
| Total Capital | $3,139 | ($3,369) | $8,372 |
| Total Liabilities and Capital | $23,476 | $14,702 | $25,856 |
| Net Worth | $3,139 | ($3,369) | $8,372 |
8.6 Business Ratios
The following table details specific Business Ratios for Earthly Clean. While Earthly Clean sells cleaning products, the organizational structure of multi-level merchandising falls within the Standard Industrial Classification code system under Nonstore Retailers – Direct Selling Establishments. We most closely match SIC industry class: Party-plan merchandising – 5963.9907
| Ratio Analysis | ||||
| Year 1 | Year 2 | Year 3 | Industry Profile | |
| Sales Growth | 0.00% | 95.00% | 85.00% | 2.88% |
| Percent of Total Assets | ||||
| Accounts Receivable | 24.42% | 76.05% | 80.00% | 18.38% |
| Other Current Assets | 0.00% | 0.00% | 0.00% | 22.11% |
| Total Current Assets | 82.94% | 79.54% | 92.22% | 78.80% |
| Long-term Assets | 17.06% | 20.46% | 7.78% | 21.20% |
| Total Assets | 100.00% | 100.00% | 100.00% | 100.00% |
| Current Liabilities | 9.10% | 11.37% | 11.15% | 34.69% |
| Long-term Liabilities | 77.53% | 111.55% | 56.47% | 13.42% |
| Total Liabilities | 86.63% | 122.92% | 67.62% | 48.11% |
| Net Worth | 13.37% | -22.92% | 32.38% | 51.89% |
| Percent of Sales | ||||
| Sales | 100.00% | 100.00% | 100.00% | 100.00% |
| Gross Margin | 70.00% | 70.00% | 70.00% | 38.83% |
| Selling, General & Administrative Expenses | 158.62% | 38.79% | 30.20% | 25.49% |
| Advertising Expenses | 0.00% | 0.00% | 0.00% | 1.97% |
| Profit Before Interest and Taxes | -79.45% | -12.31% | 25.51% | 2.02% |
| Main Ratios | ||||
| Current | 9.11 | 7.00 | 8.27 | 2.01 |
| Quick | 9.11 | 7.00 | 8.27 | 0.79 |
| Total Debt to Total Assets | 86.63% | 122.92% | 67.62% | 55.49% |
| Pre-tax Return on Net Worth | -564.56% | 193.17% | 200.35% | 3.89% |
| Pre-tax Return on Assets | -75.49% | -44.26% | 64.87% | 8.75% |
| Additional Ratios | Year 1 | Year 2 | Year 3 | |
| Net Profit Margin | -89.00% | -16.76% | 16.35% | n.a |
| Return on Equity | -564.56% | 0.00% | 140.24% | n.a |
| Activity Ratios | ||||
| Accounts Receivable Turnover | 2.60 | 2.60 | 2.60 | n.a |
| Collection Days | 54 | 106 | 108 | n.a |
| Accounts Payable Turnover | 7.78 | 12.17 | 12.17 | n.a |
| Payment Days | 27 | 34 | 24 | n.a |
| Total Asset Turnover | 0.85 | 2.64 | 2.78 | n.a |
| Debt Ratios | ||||
| Debt to Net Worth | 6.48 | 0.00 | 2.09 | n.a |
| Current Liab. to Liab. | 0.11 | 0.09 | 0.16 | n.a |
| Liquidity Ratios | ||||
| Net Working Capital | $17,335 | $10,023 | $20,960 | n.a |
| Interest Coverage | -8.31 | -2.76 | 11.82 | n.a |
| Additional Ratios | ||||
| Assets to Sales | 1.18 | 0.38 | 0.36 | n.a |
| Current Debt/Total Assets | 9% | 11% | 11% | n.a |
| Acid Test | 6.43 | 0.31 | 1.10 | n.a |
| Sales/Net Worth | 6.34 | 0.00 | 8.58 | n.a |
| Dividend Payout | 0.00 | 0.00 | 0.00 | n.a |
Appendix
| Sales Forecast | |||||||||||||
| Month 1 | Month 2 | Month 3 | Month 4 | Month 5 | Month 6 | Month 7 | Month 8 | Month 9 | Month 10 | Month 11 | Month 12 | ||
| Sales | |||||||||||||
| Individuals | 0% | $0 | $0 | $0 | $500 | $625 | $850 | $1,200 | $1,650 | $2,100 | $2,400 | $2,650 | $3,230 |
| Distributors | 0% | $0 | $0 | $0 | $0 | $200 | $272 | $384 | $528 | $672 | $768 | $848 | $1,034 |
| Total Sales | $0 | $0 | $0 | $500 | $825 | $1,122 | $1,584 | $2,178 | $2,772 | $3,168 | $3,498 | $4,264 | |
| Direct Cost of Sales | Month 1 | Month 2 | Month 3 | Month 4 | Month 5 | Month 6 | Month 7 | Month 8 | Month 9 | Month 10 | Month 11 | Month 12 | |
| Individuals | $0 | $0 | $0 | $150 | $188 | $255 | $360 | $495 | $630 | $720 | $795 | $969 | |
| Distributors | $0 | $0 | $0 | $0 | $60 | $82 | $115 | $158 | $202 | $230 | $254 | $310 | |
| Subtotal Direct Cost of Sales | $0 | $0 | $0 | $150 | $248 | $337 | $475 | $653 | $832 | $950 | $1,049 | $1,279 | |
| Personnel Plan | |||||||||||||
| Month 1 | Month 2 | Month 3 | Month 4 | Month 5 | Month 6 | Month 7 | Month 8 | Month 9 | Month 10 | Month 11 | Month 12 | ||
| Devon | 0% | $0 | $0 | $2,000 | $2,000 | $2,000 | $2,000 | $2,000 | $2,000 | $2,000 | $2,000 | $2,000 | $2,000 |
| Other | 0% | $0 | $0 | $0 | $0 | $0 | $0 | $0 | $0 | $0 | $0 | $0 | $0 |
| Total People | 0 | 0 | 1 | 1 | 1 | 1 | 1 | 1 | 1 | 1 | 1 | 1 | |
| Total Payroll | $0 | $0 | $2,000 | $2,000 | $2,000 | $2,000 | $2,000 | $2,000 | $2,000 | $2,000 | $2,000 | $2,000 | |
| General Assumptions | |||||||||||||
| Month 1 | Month 2 | Month 3 | Month 4 | Month 5 | Month 6 | Month 7 | Month 8 | Month 9 | Month 10 | Month 11 | Month 12 | ||
| Plan Month | 1 | 2 | 3 | 4 | 5 | 6 | 7 | 8 | 9 | 10 | 11 | 12 | |
| Current Interest Rate | 10.00% | 10.00% | 10.00% | 10.00% | 10.00% | 10.00% | 10.00% | 10.00% | 10.00% | 10.00% | 10.00% | 10.00% | |
| Long-term Interest Rate | 10.00% | 10.00% | 10.00% | 10.00% | 10.00% | 10.00% | 10.00% | 10.00% | 10.00% | 10.00% | 10.00% | 10.00% | |
| Tax Rate | 30.00% | 30.00% | 30.00% | 30.00% | 30.00% | 30.00% | 30.00% | 30.00% | 30.00% | 30.00% | 30.00% | 30.00% | |
| Other | 0 | 0 | 0 | 0 | 0 | 0 | 0 | 0 | 0 | 0 | 0 | 0 | |
| Pro Forma Profit and Loss | |||||||||||||
| Month 1 | Month 2 | Month 3 | Month 4 | Month 5 | Month 6 | Month 7 | Month 8 | Month 9 | Month 10 | Month 11 | Month 12 | ||
| Sales | $0 | $0 | $0 | $500 | $825 | $1,122 | $1,584 | $2,178 | $2,772 | $3,168 | $3,498 | $4,264 | |
| Direct Cost of Sales | $0 | $0 | $0 | $150 | $248 | $337 | $475 | $653 | $832 | $950 | $1,049 | $1,279 | |
| Other Costs of Goods | $0 | $0 | $0 | $0 | $0 | $0 | $0 | $0 | $0 | $0 | $0 | $0 | |
| Total Cost of Sales | $0 | $0 | $0 | $150 | $248 | $337 | $475 | $653 | $832 | $950 | $1,049 | $1,279 | |
| Gross Margin | $0 | $0 | $0 | $350 | $578 | $785 | $1,109 | $1,525 | $1,940 | $2,218 | $2,449 | $2,985 | |
| Gross Margin % | 0.00% | 0.00% | 0.00% | 70.00% | 70.00% | 70.00% | 70.00% | 70.00% | 70.00% | 70.00% | 70.00% | 70.00% | |
| Expenses | |||||||||||||
| Payroll | $0 | $0 | $2,000 | $2,000 | $2,000 | $2,000 | $2,000 | $2,000 | $2,000 | $2,000 | $2,000 | $2,000 | |
| Sales and Marketing and Other Expenses | $200 | $200 | $200 | $200 | $200 | $200 | $200 | $200 | $200 | $200 | $200 | $200 | |
| Depreciation | $83 | $83 | $83 | $83 | $83 | $83 | $83 | $83 | $83 | $83 | $83 | $83 | |
| Rent | $150 | $150 | $150 | $150 | $150 | $150 | $150 | $150 | $150 | $150 | $150 | $150 | |
| Utilities | $55 | $55 | $55 | $55 | $55 | $55 | $55 | $55 | $55 | $55 | $55 | $55 | |
| Insurance | 15% | $75 | $75 | $75 | $75 | $75 | $75 | $75 | $75 | $75 | $75 | $75 | $75 |
| Payroll Taxes | 15% | $0 | $0 | $300 | $300 | $300 | $300 | $300 | $300 | $300 | $300 | $300 | $300 |
| Total Operating Expenses | $563 | $563 | $2,863 | $2,863 | $2,863 | $2,863 | $2,863 | $2,863 | $2,863 | $2,863 | $2,863 | $2,863 | |
| Profit Before Interest and Taxes | ($563) | ($563) | ($2,863) | ($2,513) | ($2,286) | ($2,078) | ($1,754) | ($1,338) | ($923) | ($645) | ($414) | $122 | |
| EBITDA | ($480) | ($480) | ($2,780) | ($2,430) | ($2,203) | ($1,995) | ($1,671) | ($1,255) | ($840) | ($562) | ($331) | $205 | |
| Interest Expense | $165 | $164 | $163 | $162 | $160 | $159 | $158 | $157 | $155 | $154 | $153 | $152 | |
| Taxes Incurred | $0 | $0 | $0 | $0 | $0 | $0 | $0 | $0 | $0 | $0 | $0 | $0 | |
| Net Profit | ($728) | ($727) | ($3,026) | ($2,675) | ($2,446) | ($2,237) | ($1,912) | ($1,495) | ($1,078) | ($800) | ($567) | ($30) | |
| Net Profit/Sales | 0.00% | 0.00% | 0.00% | -534.93% | -296.47% | -199.36% | -120.71% | -68.64% | -38.89% | -25.24% | -16.22% | -0.71% | |
| Pro Forma Cash Flow | |||||||||||||
| Month 1 | Month 2 | Month 3 | Month 4 | Month 5 | Month 6 | Month 7 | Month 8 | Month 9 | Month 10 | Month 11 | Month 12 | ||
| Cash Received | |||||||||||||
| Cash from Operations | |||||||||||||
| Cash Sales | $0 | $0 | $0 | $125 | $206 | $281 | $396 | $545 | $693 | $792 | $875 | $1,066 | |
| Cash from Receivables | $0 | $0 | $0 | $0 | $13 | $383 | $626 | $853 | $1,203 | $1,648 | $2,089 | $2,384 | |
| Subtotal Cash from Operations | $0 | $0 | $0 | $125 | $219 | $664 | $1,022 | $1,398 | $1,896 | $2,440 | $2,963 | $3,450 | |
| Additional Cash Received | |||||||||||||
| Sales Tax, VAT, HST/GST Received | 0.00% | $0 | $0 | $0 | $0 | $0 | $0 | $0 | $0 | $0 | $0 | $0 | $0 |
| New Current Borrowing | $0 | $0 | $0 | $0 | $0 | $0 | $0 | $0 | $0 | $0 | $0 | $0 | |
| New Other Liabilities (interest-free) | $0 | $0 | $0 | $0 | $0 | $0 | $0 | $0 | $0 | $0 | $0 | $0 | |
| New Long-term Liabilities | $0 | $0 | $0 | $0 | $0 | $0 | $0 | $0 | $0 | $0 | $0 | $0 | |
| Sales of Other Current Assets | $0 | $0 | $0 | $0 | $0 | $0 | $0 | $0 | $0 | $0 | $0 | $0 | |
| Sales of Long-term Assets | $0 | $0 | $0 | $0 | $0 | $0 | $0 | $0 | $0 | $0 | $0 | $0 | |
| New Investment Received | $0 | $0 | $0 | $0 | $0 | $0 | $0 | $0 | $0 | $0 | $0 | $0 | |
| Subtotal Cash Received | $0 | $0 | $0 | $125 | $219 | $664 | $1,022 | $1,398 | $1,896 | $2,440 | $2,963 | $3,450 | |
| Expenditures | Month 1 | Month 2 | Month 3 | Month 4 | Month 5 | Month 6 | Month 7 | Month 8 | Month 9 | Month 10 | Month 11 | Month 12 | |
| Expenditures from Operations | |||||||||||||
| Cash Spending | $0 | $0 | $2,000 | $2,000 | $2,000 | $2,000 | $2,000 | $2,000 | $2,000 | $2,000 | $2,000 | $2,000 | |
| Bill Payments | $22 | $645 | $654 | $948 | $1,095 | $1,191 | $1,280 | $1,419 | $1,596 | $1,771 | $1,888 | $1,990 | |
| Subtotal Spent on Operations | $22 | $645 | $2,654 | $2,948 | $3,095 | $3,191 | $3,280 | $3,419 | $3,596 | $3,771 | $3,888 | $3,990 | |
| Additional Cash Spent | |||||||||||||
| Sales Tax, VAT, HST/GST Paid Out | $0 | $0 | $0 | $0 | $0 | $0 | $0 | $0 | $0 | $0 | $0 | $0 | |
| Principal Repayment of Current Borrowing | $0 | $0 | $0 | $0 | $0 | $0 | $0 | $0 | $0 | $0 | $0 | $0 | |
| Other Liabilities Principal Repayment | $0 | $0 | $0 | $0 | $0 | $0 | $0 | $0 | $0 | $0 | $0 | $0 | |
| Long-term Liabilities Principal Repayment | $150 | $150 | $150 | $150 | $150 | $150 | $150 | $150 | $150 | $150 | $150 | $150 | |
| Purchase Other Current Assets | $0 | $0 | $0 | $0 | $0 | $0 | $0 | $0 | $0 | $0 | $0 | $0 | |
| Purchase Long-term Assets | $0 | $0 | $0 | $0 | $0 | $0 | $0 | $0 | $0 | $0 | $0 | $0 | |
| Dividends | $0 | $0 | $0 | $0 | $0 | $0 | $0 | $0 | $0 | $0 | $0 | $0 | |
| Subtotal Cash Spent | $172 | $795 | $2,804 | $3,098 | $3,245 | $3,341 | $3,430 | $3,569 | $3,746 | $3,921 | $4,038 | $4,140 | |
| Net Cash Flow | ($172) | ($795) | ($2,804) | ($2,973) | ($3,026) | ($2,677) | ($2,408) | ($2,171) | ($1,850) | ($1,481) | ($1,074) | ($690) | |
| Cash Balance | $35,688 | $34,893 | $32,089 | $29,116 | $26,090 | $23,413 | $21,005 | $18,833 | $16,983 | $15,502 | $14,428 | $13,738 | |
| Pro Forma Balance Sheet | |||||||||||||
| Month 1 | Month 2 | Month 3 | Month 4 | Month 5 | Month 6 | Month 7 | Month 8 | Month 9 | Month 10 | Month 11 | Month 12 | ||
| Assets | Starting Balances | ||||||||||||
| Current Assets | |||||||||||||
| Cash | $35,860 | $35,688 | $34,893 | $32,089 | $29,116 | $26,090 | $23,413 | $21,005 | $18,833 | $16,983 | $15,502 | $14,428 | $13,738 |
| Accounts Receivable | $0 | $0 | $0 | $0 | $375 | $981 | $1,440 | $2,001 | $2,782 | $3,658 | $4,386 | $4,920 | $5,734 |
| Other Current Assets | $0 | $0 | $0 | $0 | $0 | $0 | $0 | $0 | $0 | $0 | $0 | $0 | $0 |
| Total Current Assets | $35,860 | $35,688 | $34,893 | $32,089 | $29,491 | $27,071 | $24,852 | $23,006 | $21,615 | $20,641 | $19,888 | $19,348 | $19,472 |
| Long-term Assets | |||||||||||||
| Long-term Assets | $5,000 | $5,000 | $5,000 | $5,000 | $5,000 | $5,000 | $5,000 | $5,000 | $5,000 | $5,000 | $5,000 | $5,000 | $5,000 |
| Accumulated Depreciation | $0 | $83 | $166 | $249 | $332 | $415 | $498 | $581 | $664 | $747 | $830 | $913 | $996 |
| Total Long-term Assets | $5,000 | $4,917 | $4,834 | $4,751 | $4,668 | $4,585 | $4,502 | $4,419 | $4,336 | $4,253 | $4,170 | $4,087 | $4,004 |
| Total Assets | $40,860 | $40,605 | $39,727 | $36,840 | $34,159 | $31,656 | $29,354 | $27,425 | $25,951 | $24,894 | $24,058 | $23,435 | $23,476 |
| Liabilities and Capital | Month 1 | Month 2 | Month 3 | Month 4 | Month 5 | Month 6 | Month 7 | Month 8 | Month 9 | Month 10 | Month 11 | Month 12 | |
| Current Liabilities | |||||||||||||
| Accounts Payable | $0 | $624 | $623 | $911 | $1,055 | $1,148 | $1,233 | $1,366 | $1,537 | $1,708 | $1,822 | $1,916 | $2,137 |
| Current Borrowing | $0 | $0 | $0 | $0 | $0 | $0 | $0 | $0 | $0 | $0 | $0 | $0 | $0 |
| Other Current Liabilities | $0 | $0 | $0 | $0 | $0 | $0 | $0 | $0 | $0 | $0 | $0 | $0 | $0 |
| Subtotal Current Liabilities | $0 | $624 | $623 | $911 | $1,055 | $1,148 | $1,233 | $1,366 | $1,537 | $1,708 | $1,822 | $1,916 | $2,137 |
| Long-term Liabilities | $20,000 | $19,850 | $19,700 | $19,550 | $19,400 | $19,250 | $19,100 | $18,950 | $18,800 | $18,650 | $18,500 | $18,350 | $18,200 |
| Total Liabilities | $20,000 | $20,474 | $20,323 | $20,461 | $20,455 | $20,398 | $20,333 | $20,316 | $20,337 | $20,358 | $20,322 | $20,266 | $20,337 |
| Paid-in Capital | $30,000 | $30,000 | $30,000 | $30,000 | $30,000 | $30,000 | $30,000 | $30,000 | $30,000 | $30,000 | $30,000 | $30,000 | $30,000 |
| Retained Earnings | ($9,140) | ($9,140) | ($9,140) | ($9,140) | ($9,140) | ($9,140) | ($9,140) | ($9,140) | ($9,140) | ($9,140) | ($9,140) | ($9,140) | ($9,140) |
| Earnings | $0 | ($728) | ($1,456) | ($4,482) | ($7,156) | ($9,602) | ($11,839) | ($13,751) | ($15,246) | ($16,324) | ($17,124) | ($17,691) | ($17,721) |
| Total Capital | $20,860 | $20,132 | $19,404 | $16,379 | $13,704 | $11,258 | $9,021 | $7,109 | $5,614 | $4,536 | $3,736 | $3,169 | $3,139 |
| Total Liabilities and Capital | $40,860 | $40,605 | $39,727 | $36,840 | $34,159 | $31,656 | $29,354 | $27,425 | $25,951 | $24,894 | $24,058 | $23,435 | $23,476 |
| Net Worth | $20,860 | $20,132 | $19,404 | $16,379 | $13,704 | $11,258 | $9,021 | $7,109 | $5,614 | $4,536 | $3,736 | $3,169 | $3,139 |


