
Rekayasa Tambang Indonesia
Executive Summary
PT. Rekayasa Tambang Indonesia (RTI) meets the needs of clients – private and government-owned mining companies – in virtually every sphere of geological interpretation and modeling, mine design and engineering, and mining productivity improvement activities. RTI is a subsidiary company of Mining Engineering Software Development and Technical Assistance (MINER DELTA), a U.S. software manufacturer who provides engineering software for full-service mining design and geological engineering and interpretation, and offering the managerial and technical resources that are vital to solving complex geological interpretation and modeling, mine design, mining optimization, mine scheduling, and dump design and rehabilitation in Indonesia as well as Southeast Asia Region.
The Products
RTI will be offering five distinct products and services. The first is geological interpretation and modeling software systems. This product and service provides the most comprehensive geological database, innovative interpretation tools, advanced modeling techniques and resource reporting for most types of deposits ranging from simple vein, stratiform, and massive deposits, to complex and highly deformed ore bodies. Mine design and engineering software systems will also be offered in addition to mining optimization and scheduling software systems. Lastly, dump design and rehabilitation will perform analysis regarding environmental impact, designing mine waste dump, designing acid drainage, designing ground water drainage, and environmental rehabilitation.
The Market
The total market value for open pit, underground, and quarry mining software technologies has grown at an average rate of 22% over the past five years. Since there is no local engineering software producer in Indonesia, the imported software technologies account for 100% of all open pit, underground, and quarry mining engineering and geological software technologies in Indonesian mining industries. Total imports of mining software technologies totaled $75 million last year, 23.7% greater than previous year’s levels of $60.6 million, which were in turn 26.3% greater than the year before’s imports, valued at $48 million.
Competitive Advantages
The key factors for RTI to create and maintain competitive advantages includes its access to intangible capital (business networks, leadership, talent, entrepreneurs, intellectual property and brand) and advanced technology. These two advantages are interrelated. The “intangible capital” to a large degree is intellectual capital that has been captured by the organization. RTI has been very careful to design systems to capture the human capital that has been developed by the members of the organization. This is indeed a huge advantage because even as some employees are transitory and move on to new companies, their contributions and knowledge are captured by RTI and leveraged by the current employees. This intellectual capital capture then fuels the advanced technology.
RTI is an exciting company that combines advanced technology in the form of software and consulting services serving the mining industry. RTI has forecasted strong revenue numbers for year one, growing steadily through year five. Gross margins will be a high % of sales with net profits improving each year.

1.1 Mission
The mission of RTI is to establish a strong presence in Indonesia to implement all provisions of the MINER DELTA mission statement with the specific mission of becoming the leading mining and geology software and consulting services provider in Indonesia. This will be done by creating customer value through facilitating optimal and efficient operations by developing the best techniques of image analysis. Also, as the commercial arm of the MINER DELTA, RTI will establish a reputation in the mining industry for exceeding customer expectations through exemplary consultative service.
1.2 Objectives
The financial and marketing objectives of RTI are summarized here.
- Healthy sales in the first year, growing steadily through by the fifth year of plan implementation.
- Top drawer average gross margin percent of sales revenue.
- Net income consistently improving each year.
The financial objectives are converted into marketing objectives. If the company wants to earn its targets for gross margin and sales revenue, then it must set a high average profit margin on sales. To achieve these targets, the company will have to set certain goals for customer awareness such as by proactively approaching the prospective client candidates, teaming-up with other technology providers (hardware manufacturers and platform developers), partnering with reputable local and regional mining contractors, and equipment suppliers to reduce competition, improve pricing as well as reducing risks.
Thus the marketing objective might read:
- Achieve targeted sales revenue each year for the next five years.
- Expand customer awareness over the planning period.
- Reduce competition and risks while lowering price levels by teaming-up with other technology providers (hardware manufacturers and platform developers) and partnering with reputable local and regional mining contractors and equipment suppliers.
1.3 Keys to Success
The key factors for RTI to create a competitive advantage includes its access to intangible capital (business networks, leadership, talent, entrepreneurs, intellectual property and brand) and advanced technology, and its ability to customize its location.
In addition to intangible capital, RTI has a technological advantage with its advanced mining design, scheduling, and geological interpretation programs. Software performance is judged by how accurately the software calculates and produces visibility plots. Other qualitative measures, such as flexibility and ease of use, are important measures that RTI also excels in. To a sustain competitive advantage, RTI will focus on refining and improving the system with future software versions. RTI will continue to research image analysis issues.
The combination of human resources and advanced technology enables RTI to focus on its mission of becoming a customer driven company. Each system will be individually designed and installed by trained personnel. This type of personalized service is only available from RTI; and its ability to operate in a “turn key” fashion is highly valued in its target market. The close personal relationship between customers and RTI is vital to our mission: “to exceed customer expectations through exemplary consultative service.”
In order to effectively operate in this fashion, RTI’s location in Jakarta situates it close to the core of its target market. Further, RTI’s product and services distribution is aided by the locations in the major mining provinces in Indonesia (East Kalimantan, South Kalimantan, South Sumatra, Central Sulawesi). Sales demonstrations, installation and design, service, and maintenance will all be subject to a lower travel cost. As unit sales increase, the distribution cost advantages will be measurable cost competitive advantages. Being close to our customers will provide many intangible benefits: it will help consulting efforts and it will aid in our quest to be customer and market driven, rather than just a branch office, or even a representative of any software manufacturer or foreign consulting firm.
In a typical mine, the most important link in its value chain is clearly the primary activity of operations, to produce more product for a cheaper price. RTI provides value and benefit to its customers by targeting this specific activity in its customer’s value chain. The systems generated by RTI for its clients provide a quality assurance activity that monitors operations and is a guide to raising its customer’s operational performance.
Company Summary
RTI is a subsidiary company of MINER DELTA. Services provided include: geological interpretation and modeling, mine design, mining optimization, mine scheduling, and dump design and rehabilitation.
RTI develops compliance analysis and modeling (including simulation), engineering and design, and productivity improvement systems for every sphere of activity in the mining industry. These systems are designed to be user-friendly, accurate, and portable among computer platforms.

MINER DELTA’s management demands a good financial performance from RTI. As a subsidiary company of MINER DELTA, RTI sets the following objectives for the products and services lines of geological interpretation and modeling, mine design, mining optimization, mine scheduling, and dump design and rehabilitation:
- Expand customer awareness over the planning period.
- Reduce competition, reduce risks, and lower price level by teaming-up with technology providers (hardware manufacturers and platform developers), partnering with reputable local and regional mining contractors, and equipment suppliers.
2.1 Company Ownership
RTI was incorporated in Jakarta as an Indonesian “Perseroan Terbatas” (PT) corporation on August 4, 2000, under the Foreign Investment Laws of the Republic of Indonesia, with an authorized 1 million shares of common stock.
The company is owned in majority by MINER DELTA. There is one minority owner, an investor from Jakarta, Indonesia.
2.2 Start-up Summary
Total start-up expenses include legal costs, logo design, stationery, as well as start-up assets required, and cash to handle the first few months of consulting operations as sales and account receivable play through the cash flow. The details are included in the following chart and table.

| Start-up | |
| Requirements | |
| Start-up Expenses | |
| Legal | $5,500 |
| Stationery etc. | $3,000 |
| Brochures | $5,000 |
| Consultants | $48,000 |
| Insurance | $1,588 |
| Rent | $3,000 |
| Expensed equipment | $3,000 |
| Total Start-up Expenses | $69,088 |
| Start-up Assets | |
| Cash Required | $100,000 |
| Other Current Assets | $31,588 |
| Long-term Assets | $0 |
| Total Assets | $131,588 |
| Total Requirements | $200,675 |
| Start-up Funding | |
| Start-up Expenses to Fund | $69,088 |
| Start-up Assets to Fund | $131,588 |
| Total Funding Required | $200,675 |
| Assets | |
| Non-cash Assets from Start-up | $31,588 |
| Cash Requirements from Start-up | $100,000 |
| Additional Cash Raised | $0 |
| Cash Balance on Starting Date | $100,000 |
| Total Assets | $131,588 |
| Liabilities and Capital | |
| Liabilities | |
| Current Borrowing | $0 |
| Long-term Liabilities | $0 |
| Accounts Payable (Outstanding Bills) | $5,000 |
| Other Current Liabilities (interest-free) | $0 |
| Total Liabilities | $5,000 |
| Capital | |
| Planned Investment | |
| Investor 1 | $70,000 |
| Investor 2 | $100,000 |
| Other | $25,675 |
| Additional Investment Requirement | $0 |
| Total Planned Investment | $195,675 |
| Loss at Start-up (Start-up Expenses) | ($69,088) |
| Total Capital | $126,588 |
| Total Capital and Liabilities | $131,588 |
| Total Funding | $200,675 |
2.3 Company Locations and Facilities
The initial office will be established in the Kebayoran Baru area of South Jakarta, Indonesia, the heart of the Indonesian business area.
Products and Services
The company management team is capitalizing on the lucrative business opportunity of creating compliance analysis and modeling, design and engineering, and productivity improvement software systems to aid mining companies. RTI’s products and services will help companies gain competitive advantage in the marketplace since its products and services will shorten the time-to-market cycle for its clients. This, combined with the management team and business opportunity, has generated tremendous interest for RTI’s compliance systems in the Indonesian mining industry.
3.1 Competitive Comparison
Deposits and excavation images analysis is a developing technology and, as such, the industry lacks standardization.
In this digital image analysis market, no market leader exists, and only three other major players in Asia have developed and begun to market similar products and services. These companies are all in Australia: ECS International of Bowral, Runge Mining, and Mincom of Brisbane.
RTI’s sustainable competitive advantages are its patentable advanced technology and custom system design/installations, human capital, and strategic location.
3.2 Product and Service Description
- Geological interpretation and modeling software systems: This product and service provides the most comprehensive geological database, innovative interpretation tools, advanced modeling techniques and resource reporting for most types of deposits ranging from simple vein, stratiform, and massive deposits, to complex and highly deformed orebodies.
- Mine design and engineering software systems: Design and engineering software systems for open pit, underground, and quarry mining.
- Mining optimisation software systems: Installing a Productivity Improvement System, a total productivity control system to increase productivity level as well as shorten the time-to-market cycle for the clients.
- Mine scheduling software systems: Mine scheduling for open pit, underground, and quarry mining.
- Dump design and rehabilitation: Performing analysis regarding environmental impact, designing mine waste dump, designing acid drainage, designing ground water drainage, and environmental rehabilitation.
3.3 Fulfillment
The key fulfillment and delivery will be provided by the principals of the business. The real core value is professional expertise, provided by a combination of experience, relationships and connections in the market (quangxi), discipline, smart work, hard work, confidence, and education.
RTI will work with computer hardware, peripherals, accessories and add-ons manufacturers, and platform developers under project-by-project basis. RTI will not exclusively represent any of these companies in order to keep its position as partner for every supplier and technology provider rather than competitor of any of them.
3.4 Technology
MINER DELTA is a recognized leader in supplying integrated geological and mining software technologies and computerized consulting services to the mining industries. As the commercial arm of MINER DELTA in Indonesia, RTI will focus on providing its clients with rapid, non-disruptive, and accurate analysis of deposits and excavations images using the integrated software technologies developed by the parent company. The technologies employ digital image analysis to calculate deposits’ size, orientation/position, and distributions, as well as provide options of mining methods, create value through monitoring mine works-in-progress, and empower mining engineers with crucial operational data.
3.5 Services and Supports
RTI’s services and support are truly done at the client’s site. In essence, the service begins with the technical presentation and on-site demonstration of the technology. Through these initial communications with the potential buyer, RTI will assign its Vice President of Sales and Marketing to conduct an analysis on the client’s operation and begin to customize the system to fill their needs and solve their problem. Once it knows what the prospective client wants, it will then send a technical proposal to the prospective client with a draft contract. A commercial meeting schedule will be arranged with the prospective client to open negotiations with the client’s decision board, and then to close the selling cycle by having the client sign the contract.
Within one working week after contract signing, RTI will submit a document of its project design proposal to the client for approval. Upon project design approval, it will then go to the mine and install the site specific system. Along with the installation it will provide one month of on-site training of MINER DELTA to the supervisors/engineers selected by the client. Besides providing a one year warranty, RTI will also offer the client long-term technical support called “Project Perpetuation Assistance.”
In keeping with its mission to provide market driven products and services, RTI will keep in close contact with all clients and solicit ideas on improvements and necessary changes. This contact will be achieved through consulting for the mines, sending out questionnaires, and maintaining daily emails, as well as weekly telephone contacts, with each client.
3.6 Sales Literature
The business will begin with general corporate and technical brochures establishing the positioning and defining the company’s intangible capital to be transformed into clients’ benefits. These brochures will be developed as part of the start-up expenses.
Literature and mailings for the initial market forums will be very important.
Market Analysis Summary
The total market value for open pit, underground, and quarry mining software technologies has grown at an average rate of 22% over the past five years. Since there is no local engineering software producer in Indonesia, the imported software technologies account for 100% of all open pit, underground, and quarry mining engineering and geological software technologies in Indonesian mining industries. Total imports of mining software technologies totaled $75 million in 2000, 23.7% greater than 1999 levels of $60.6 million, which were in turn 26.3% greater than 1998 imports, valued at $48 million.
The demand for open pit, underground, and quarry mining software technologies is projected to grow at an average rate of 16.89% annually over the next five years. Demand will result from the expansion programs of existing mines and establishment of new mines, particularly for coal, gold, and quarry products. In the coal mine sector, the establishment of a new generation of coal mine companies is expected to be very active during the next few years. Growth in other mining sectors, such as quarry activities for clay, limestone, feldspar, kaolin, marble and other stones, ore and sand iron, will also have an effect on the demand for mining and geology software technologies.
Aside from the coal sector, there is continuous growth in civil construction activities, which requires increased production of building materials such as cement, sands, stones, and various products made from kaolin, limestone, and other quarry materials, such as tiles, bricks, etc. Export growth of these materials is also expected to fuel demand.
Future growth in the mining and geology software technologies market will depend on continued growth in the coal consumption in both global and domestic markets. Government policies will also play a role as the government has sought to support the mining industry through investment incentives and lowering tariff on technologies and equipment imports.
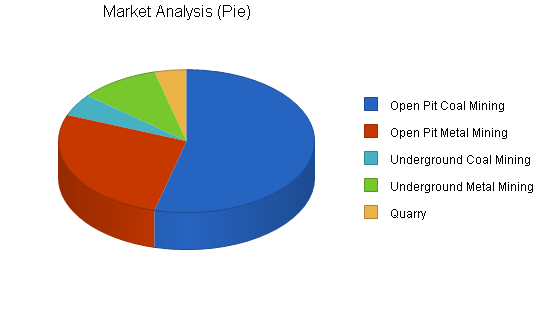
4.1 Market Segmentation
Demographics: During its first five years of operations, RTI will target large domestic coal, base metal, precious metal, and quarry mines. After five years of operations, it will expand to service smaller coal, metal mines, and quarries. This industry is comprised of local companies within every province.
Geographic: RTI will operate regionally in the Southeast Asia region, but will focus initially on the Indonesian mining market.
Technographic: In all cases, the target market is comprised of open pit coal mines, open pit metal mines, underground coal mines, underground metal mines, and quarry mines.
| Market Analysis | |||||||
| Year 1 | Year 2 | Year 3 | Year 4 | Year 5 | |||
| Potential Customers | Growth | CAGR | |||||
| Open Pit Coal Mining | 20% | 49,410,000 | 59,292,000 | 71,150,400 | 85,380,480 | 102,456,576 | 20.00% |
| Open Pit Metal Mining | 13% | 24,705,000 | 27,793,125 | 31,267,266 | 35,175,674 | 39,572,633 | 12.50% |
| Underground Coal Mining | 15% | 4,575,000 | 5,261,250 | 6,050,438 | 6,958,004 | 8,001,705 | 15.00% |
| Underground Metal Mining | 12% | 9,150,000 | 10,248,000 | 11,477,760 | 12,855,091 | 14,397,702 | 12.00% |
| Quarry | 15% | 3,660,000 | 4,209,000 | 4,840,350 | 5,566,403 | 6,401,363 | 15.00% |
| Total | 16.89% | 91,500,000 | 106,803,375 | 124,786,214 | 145,935,652 | 170,829,979 | 16.89% |
4.2 Target Market Segment Strategy
In its first five years, RTI will be focusing on large, domestic open pit coal mines, open pit metal mines, underground coal mines, underground metal mines, and quarry mines.
4.2.1 Customer Benefits
Clients do not buy features, they buy benefits. In selling and marketing its products and services, RTI will demonstrate its capability in delivering benefits (4Cs) rather than presenting the company’s marketing mix (4Ps):
- Customer needs and wants: Mining companies are typically conservative and fiscally prudent. These companies are interested in cutting costs to improve the “bottom line” since it is difficult for them to manage the “top line” given that their final product is a commodity. Mine companies prefer a vendor to operate in a turn key fashion. They do not have the additional human resources to design, procure equipment, and install a complex system, such as the one RTI offers. They would prefer that an expert come in and do it for them. However, the MINER DELTA software system is an integrated system, so customers do have the choice to procure their own equipment and do have a large say in how to design and install the system.
- Cost to the customer: RTI’s products and services costs reflect the advanced technology and comprehensive design and support. Mines operate in large volumes, not only of mined product, but also in dollars. The costs spent on the MINER DELTA software will quickly be earned back in the data generation and mining operations monitoring. The return on investment depends on the adjustments made by the mine operators once given the data. Payback period can be achieved within a few months.
- Convenience: As an integrator, RTI installs the custom system and provides the design and installation know-how, as well as the specialized software.
- Communication: In order to truly succeed, RTI will have to appeal to the heart of the market: the middle 70% of the market that will buy the product after its perceived risk is mitigated through colleague’s purchase and communication of satisfaction. Another important method to enhance MINER DELTA’s brand awareness will be technical papers by researchers involved in the development of the systems and mine engineers discussing process improvements made possible by the program. In addition, RTI will also offer the client long-term technical support, called the Productivity Improvement Perpetuation Program, and, in keeping with its mission to provide market driven products and services, RTI will keep in close contact with all clients and solicit ideas on improvements and necessary changes.
4.3 Service Business Analysis
The mining and geology software market in Indonesia is one of the fastest growing segments of the computer industry and is estimated to have totaled $91.5 million in 2001. The greatest factors bearing on a software developer’s performance is the underlying strength of the markets in which the company’s products compete and the position of a given product in its life cycle. Interestingly, underlying markets that are experiencing downsizing pressures and networking pressures are the strongest markets for software. The mining industry is experiencing pressures to further automate and increase efficiency, so RTI is in an advantageous position. The fact that the MINER DELTA program is early in its development life cycle also indicates that revenue growth is promising, since its installed base has not even been established. The industry is characterized by rapid innovation and high gross margins.
4.3.1 Main Competitors
There are three other major players in the Indonesian mining industry that have developed and begun to market similar products and services. These companies are ECS International Pty Ltd of Bowral, Australia, Runge Mining of Australia, and Mincom of Brisbane, Australia.
4.3.2 Competition and Buying Patterns
Mining companies operate in large volumes, not only of mined products, but also in dollars. A small percentage increase in mineral recovery translates to hundreds of millions of dollars in increased revenue per year. Since mined products fetch fixed commodity prices, reductions in costs translate directly to the bottom-line. Any procedure or mechanism that can generate value through increased mineral recovery or decreased operating costs is of great interest to mine operators.
RTI must compete against the idea that mining companies should buy mining and geology software, and can get trained to operate it in one or two days; that they don’t need ongoing services, support, and intensive training to integrate the software system operation with the productivity control and improvement systems.
It is vital to build perception in the market that as an integration system, the MINER DELTA system is unique and improves upon current methods because of its three distinct characteristics;
- Automatic
- Non-disruptive
- Accurate
Also, the MINER DELTA system saves money and increases mineral recovery by providing equipment operators with real-time data to monitor and adjust their work-in-progress production, as well as empowering mine engineers with a continuous operational data log with which to make operations adjustments of larger scope.
Strategy and Implementation Summary
Purchases will ultimately occur through direct sales. Mine engineers and geologists who have the most influence on the purchase decision will need to see demonstrations or will need a technical sales presentation. These individuals are usually members of a clients’ decision board who have the authority to purchase this system.
Initial contact will be made by either telephone or a combination of telephone, email, and fax. In this initial contact, the Sales Manager will make an arrangement for a technical presentation in front of the clients’ decision board. To avoid misinterpretation, all the information on the offered products and services will not be sent to prospects, but hand-delivered by the Sales Manager during his/her technical presentation. When the Sales Manager of RTI is visiting the prospect’s site, he/she will bring a demo system that is able to be set up and operated so the client can get a feel for the type of system and for the type of data the system generates.
All promotion efforts will be congruent with the mission to establish a quality reputation in the industry and truly create a quality brand image with RTI products and services. Industrial marketing is dissimilar to traditional consumer marketing. It is an interactive and time intensive process to establish a relationship and reputation. Establishing the relationship is beneficial for the obvious reason, it provides RTI with sales revenue, but, even more importantly, it provides RTI with an information conduit to the industry. A healthy relationship with the customer base will generate ideas, innovations, and other immeasurable intangibles.
Also, since long-term customer satisfaction is the most important key factor to its survival, RTI will offer the client the Productivity Improvement Perpetuation Program and keep in close contact with all clients and solicit ideas on improvements and necessary changes.
5.1 Competitive Edge
The President and Vice President Sales and Marketing of RTI have been working with the prospective clients in the Indonesian mining industry for more than 14 years, maintaining close and effective relationships with the prospective clients’ decision boards at the senior level, and are fully familiar with, and have a good knowledge about, Indonesia as well as the Asia–Pacific business environment.
MINER DELTA is a recognized leader in supplying integrated geological and mining software technologies and computerized consulting services to the mining industries.
The MINER DELTA system is unique and improves upon current methods because of its three distinct characteristics. Also, the MINER DELTA system saves money and increases mineral recovery by providing equipment operators with real-time data to monitor and adjust their work-in-progress production, as well as empowering mine engineers with a continuous operational data log with which to make operations adjustments of larger scope.
5.2 Sales Strategy
RTI’s sales strategy focuses first on building the identity of the company with the large domestic open pit coal mines, open pit metal mines, underground coal mines, underground metal mines and quarry mines who are interested in cutting costs to improve the bottom line. The President and the Vice President of Sales and Marketing of RTI have been able to find these customers using direct sales approaches.
RTI has to sell integration systems which are unique and improve upon current methods because of their three distinct characteristics, i.e. automatic, non-disruptive, and accurate. These systems save money and increase mineral recovery by providing equipment operators with real-time data to monitor and adjust their work-in-progress production as well as empowering mine engineers with a continuous operational data log with which to make operations adjustments of larger scope.
The targeted monthly sales between January and May, 2001 is the result of the intensive direct sales approaches, including technical presentations, mine operations studies, and project proposals which have been done between August and December, 2000.
5.2.1 Sales Forecast
The yearly total sales chart summarizes RTI’s ambitious sales forecast.


| Sales Forecast | |||||
| Year 1 | Year 2 | Year 3 | Year 4 | Year 5 | |
| Sales | |||||
| Geological Interpretation and Modeling | $189,000 | $220,922 | $258,236 | $301,852 | $352,835 |
| Mine Design | $604,800 | $706,951 | $826,355 | $965,926 | $1,129,071 |
| Mining Optimization | $113,400 | $132,553 | $154,941 | $181,111 | $211,701 |
| Mine Scheduling | $302,400 | $353,475 | $413,177 | $482,963 | $564,535 |
| Dump Design and Rehabilitation | $50,400 | $58,913 | $68,863 | $80,494 | $94,089 |
| Total Sales | $1,260,000 | $1,472,814 | $1,721,572 | $2,012,346 | $2,352,231 |
| Direct Cost of Sales | Year 1 | Year 2 | Year 3 | Year 4 | Year 5 |
| Geological Interpretation and Modeling | $35,154 | $41,092 | $48,032 | $56,145 | $65,628 |
| Mine Design | $112,493 | $131,493 | $153,702 | $179,662 | $210,007 |
| Mining Optimization | $210,924 | $246,549 | $288,191 | $336,866 | $393,763 |
| Mine Scheduling | $56,246 | $65,746 | $78,850 | $92,168 | $107,735 |
| Dump Design and Rehabilitation | $9,374 | $10,957 | $12,808 | $14,971 | $17,500 |
| Subtotal Direct Cost of Sales | $424,192 | $495,837 | $581,584 | $679,812 | $794,632 |
5.3 Milestones
The accompanying bar chart and table show specific milestones, with responsibilities assigned, dates, and (in most cases) budgets. RTI is focusing in this plan on a few key milestones to be accomplished.

| Milestones | |||||
| Milestone | Start Date | End Date | Budget | Manager | Department |
| Business Plan | 11/1/2000 | 12/23/2000 | $5,000 | Managing Partner | CEO, President |
| Stationery | 11/6/2000 | 11/18/2000 | $3,000 | Administrative Officer | Administration |
| Brochures | 11/1/2000 | 11/30/2000 | $5,000 | Administrative Officer | Administration |
| Office Equipment | 12/1/2000 | 12/22/2000 | $3,000 | Administrative Officer | Administration |
| Technical Presentation at …. in East Kalimantan | 1/2/2001 | 1/12/2001 | $1,700 | Sales Manager – Mining | Sales & Marketing |
| Technical Presentation at …. in East Kalimantan | 1/2/2001 | 1/12/2001 | $1,700 | Sales Manager – Geology | Sales & Marketing |
| Technical Presentation at …. in South Sumatra | 2/5/2001 | 2/17/2001 | $1,700 | Sales Manager – Mining | Sales & Marketing |
| Technical Presentation at …. in South Sumatra | 2/5/2001 | 2/17/2001 | $1,700 | Sales Manager – Geology | Sales & Marketing |
| Technical Presentation at … in Central Sumatra | 3/5/2001 | 3/17/2001 | $1,700 | Sales Manager – Mining | Sales & Marketing |
| Technical Presentation at …. in Central Sumatra | 3/5/2001 | 3/17/2001 | $1,700 | Sales Manager – Geology | Sales & Marketing |
| Technical Presentation at …. in Central Sulawesi | 4/2/2001 | 4/13/2001 | $1,700 | Sales Manager – Mining | Sales & Marketing |
| Technical Presentation at …. in Central Sulawesi | 4/2/2001 | 4/13/2001 | $1,700 | Sales Manager – Geology | Sales & Marketing |
| Technical Presentation at …. in Irian Jaya | 4/23/2001 | 5/4/2001 | $1,700 | Sales Manager – Mining | Sales & Marketing |
| Technical Presentation at …. in Irian Jaya | 4/23/2001 | 5/4/2001 | $1,700 | Sales Manager – Geology | Sales & Marketing |
| Technical Presentation at …. in West Java | 5/14/2001 | 5/25/2001 | $1,700 | Sales Manager – Mining | Sales & Marketing |
| Technical Presentation at … in West Java | 5/14/2001 | 5/25/2001 | $1,700 | Sales Manager – Geology | Sales & Marketing |
| Operations Analysis at the most Prospective Clients’ Site | 1/8/2001 | 5/25/2001 | $12,000 | VP Sales & Marketing | Department |
| Technical Proposals to the Prospective Clients | 2/5/2001 | 6/25/2001 | $2,000 | VP Sales & Marketing | Sales & Marketing |
| Participating in Indonesia Mining Exhibition | 11/1/2001 | 11/14/2001 | $6,000 | General Manager | Operations |
| Totals | $56,400 | ||||
Management Summary
RTI is operated and managed by the President and Vice President of Sales and Marketing. When projects have been secured, personnel and staff will be recruited to fill the remaining necessary positions.
6.1 Personnel Plan
As noted in the previous section, the start-up team includes only two persons, i.e. the President and VP Sales & Marketing. When projects have been secured, another vice president (i.e. VP Operations), a General/Office Manager, and five employees will be recruited.
The accompanying table summarizes RTI’s personnel plan between 2001 and 2005.
| Personnel Plan | |||||
| Year 1 | Year 2 | Year 3 | Year 4 | Year 5 | |
| CEO, President and Managing Partner | $60,000 | $66,000 | $72,600 | $79,860 | $87,846 |
| Vice President Operations | $36,000 | $39,600 | $43,560 | $47,916 | $52,708 |
| Senior Field Engineer | $12,000 | $13,200 | $14,520 | $15,972 | $17,569 |
| Senior Programmer/Researcher | $12,000 | $13,200 | $14,520 | $15,972 | $17,569 |
| Vice President of Sales & Marketing | $36,000 | $39,600 | $43,560 | $47,916 | $52,708 |
| Sales Manager – Mining Engineering | $12,000 | $13,200 | $14,520 | $15,972 | $17,569 |
| Sales Manager – Geology | $12,000 | $13,200 | $14,520 | $15,972 | $17,569 |
| General Manager | $24,000 | $26,400 | $29,040 | $31,944 | $35,138 |
| Administrative Officer | $12,000 | $13,200 | $14,520 | $15,972 | $17,569 |
| Total People | 9 | 9 | 9 | 9 | 9 |
| Total Payroll | $216,000 | $237,600 | $261,360 | $287,496 | $316,246 |
Financial Plan
The following table shows the projected revenue of RTI over the period of 2001-2005. The most important elements in the financial plan can be listed as follows:
- The company must keep a high gross margin.
- In order to take advantage of the market demand growth to increase the yearly sales as well as the profit margin, the company must increase the frequency of business visits to the prospective clients’ sites by 10%. This will result in steady increases in net profits from sales in 2001 through 2005.
7.1 Important Assumptions
The accompanying table lists the main assumptions of RTI for developing its financial projections. The most sensitive assumption is collection days. RTI would like to improve collection days to take pressure off of its working capital.
| General Assumptions | |||||
| Year 1 | Year 2 | Year 3 | Year 4 | Year 5 | |
| Plan Month | 1 | 2 | 3 | 4 | 5 |
| Current Interest Rate | 8.50% | 8.50% | 8.50% | 8.50% | 8.50% |
| Long-term Interest Rate | 9.00% | 9.00% | 9.00% | 9.00% | 9.00% |
| Tax Rate | 25.42% | 25.00% | 25.42% | 25.00% | 25.42% |
| Other | 0 | 0 | 0 | 0 | 0 |
7.2 Business Ratios
The following table contains important business ratios for the prepackaged software industry, as determined by the Standard Industry Classification (SIC) Index, 7372.
| Ratio Analysis | ||||||
| Year 1 | Year 2 | Year 3 | Year 4 | Year 5 | Industry Profile | |
| Sales Growth | 0.00% | 16.89% | 16.89% | 16.89% | 16.89% | 9.70% |
| Percent of Total Assets | ||||||
| Accounts Receivable | 20.92% | 13.57% | 10.29% | 8.41% | 7.20% | 21.50% |
| Other Current Assets | 6.40% | 3.55% | 2.30% | 1.61% | 1.18% | 45.70% |
| Total Current Assets | 100.00% | 100.00% | 100.00% | 100.00% | 100.00% | 70.20% |
| Long-term Assets | 0.00% | 0.00% | 0.00% | 0.00% | 0.00% | 29.80% |
| Total Assets | 100.00% | 100.00% | 100.00% | 100.00% | 100.00% | 100.00% |
| Current Liabilities | 11.86% | 7.86% | 5.94% | 4.80% | 4.10% | 42.40% |
| Long-term Liabilities | 0.00% | 0.00% | 0.00% | 0.00% | 0.00% | 19.20% |
| Total Liabilities | 11.86% | 7.86% | 5.94% | 4.80% | 4.10% | 61.60% |
| Net Worth | 88.14% | 92.14% | 94.06% | 95.20% | 95.90% | 38.40% |
| Percent of Sales | ||||||
| Sales | 100.00% | 100.00% | 100.00% | 100.00% | 100.00% | 100.00% |
| Gross Margin | 66.33% | 66.33% | 66.22% | 66.22% | 66.22% | 100.00% |
| Selling, General & Administrative Expenses | 41.70% | 40.22% | 38.80% | 37.49% | 36.25% | 79.40% |
| Advertising Expenses | 0.48% | 0.45% | 0.42% | 0.40% | 0.37% | 1.30% |
| Profit Before Interest and Taxes | 32.85% | 34.82% | 36.56% | 38.31% | 39.95% | 2.20% |
| Main Ratios | ||||||
| Current | 8.43 | 12.72 | 16.83 | 20.81 | 24.40 | 1.51 |
| Quick | 8.43 | 12.72 | 16.83 | 20.81 | 24.40 | 1.16 |
| Total Debt to Total Assets | 11.86% | 7.86% | 5.94% | 4.80% | 4.10% | 61.60% |
| Pre-tax Return on Net Worth | 95.13% | 62.57% | 48.83% | 41.29% | 36.59% | 3.50% |
| Pre-tax Return on Assets | 83.85% | 57.65% | 45.93% | 39.30% | 35.09% | 9.20% |
| Additional Ratios | Year 1 | Year 2 | Year 3 | Year 4 | Year 5 | |
| Net Profit Margin | 24.48% | 26.11% | 27.27% | 28.73% | 29.80% | n.a |
| Return on Equity | 70.90% | 46.92% | 36.42% | 30.96% | 27.29% | n.a |
| Activity Ratios | ||||||
| Accounts Receivable Turnover | 6.10 | 6.10 | 6.10 | 6.10 | 6.10 | n.a |
| Collection Days | 57 | 55 | 55 | 55 | 55 | n.a |
| Accounts Payable Turnover | 12.57 | 12.17 | 12.17 | 12.17 | 12.17 | n.a |
| Payment Days | 27 | 28 | 28 | 28 | 28 | n.a |
| Total Asset Turnover | 2.55 | 1.66 | 1.26 | 1.03 | 0.88 | n.a |
| Debt Ratios | ||||||
| Debt to Net Worth | 0.13 | 0.09 | 0.06 | 0.05 | 0.04 | n.a |
| Current Liab. to Liab. | 1.00 | 1.00 | 1.00 | 1.00 | 1.00 | n.a |
| Liquidity Ratios | ||||||
| Net Working Capital | $435,030 | $819,646 | $1,289,086 | $1,867,265 | $2,568,205 | n.a |
| Interest Coverage | 0.00 | 0.00 | 0.00 | 0.00 | 0.00 | n.a |
| Additional Ratios | ||||||
| Assets to Sales | 0.39 | 0.60 | 0.80 | 0.97 | 1.14 | n.a |
| Current Debt/Total Assets | 12% | 8% | 6% | 5% | 4% | n.a |
| Acid Test | 6.67 | 11.00 | 15.10 | 19.06 | 22.65 | n.a |
| Sales/Net Worth | 2.90 | 1.80 | 1.34 | 1.08 | 0.92 | n.a |
| Dividend Payout | 0.00 | 0.00 | 0.00 | 0.00 | 0.00 | n.a |
7.3 Break-even Analysis
The following table and chart summarize the Break-even Analysis, including the assumed monthly running costs and sales break-even points.

| Break-even Analysis | |
| Monthly Revenue Break-even | $53,010 |
| Assumptions: | |
| Average Percent Variable Cost | 34% |
| Estimated Monthly Fixed Cost | $35,163 |
7.4 Projected Profit and Loss
The most important and strategic component in the Projected Profit and Loss statement is the net profit, which is planned and targeted to increase. Month-by-month assumptions for profit and loss are included in the appendix.


| Pro Forma Profit and Loss | |||||
| Year 1 | Year 2 | Year 3 | Year 4 | Year 5 | |
| Sales | $1,260,000 | $1,472,814 | $1,721,572 | $2,012,346 | $2,352,231 |
| Direct Cost of Sales | $424,192 | $495,837 | $581,584 | $679,812 | $794,632 |
| Other | $0 | $0 | $0 | $0 | $0 |
| Total Cost of Sales | $424,192 | $495,837 | $581,584 | $679,812 | $794,632 |
| Gross Margin | $835,808 | $976,977 | $1,139,988 | $1,332,534 | $1,557,599 |
| Gross Margin % | 66.33% | 66.33% | 66.22% | 66.22% | 66.22% |
| Expenses | |||||
| Payroll | $216,000 | $237,600 | $261,360 | $287,496 | $316,246 |
| Sales and Marketing and Other Expenses | $122,200 | $134,420 | $147,862 | $162,648 | $178,913 |
| Depreciation | $0 | $0 | $0 | $0 | $0 |
| Leased Equipment | $0 | $0 | $0 | $0 | $0 |
| Utilities | $7,200 | $7,920 | $8,712 | $9,583 | $10,541 |
| Insurance | $2,160 | $2,376 | $2,614 | $2,875 | $3,163 |
| Rent | $42,000 | $46,200 | $50,820 | $55,902 | $61,492 |
| Payroll Taxes | $32,400 | $35,640 | $39,204 | $43,124 | $47,437 |
| Other | $0 | $0 | $0 | $0 | $0 |
| Total Operating Expenses | $421,960 | $464,156 | $510,572 | $561,629 | $617,791 |
| Profit Before Interest and Taxes | $413,848 | $512,821 | $629,417 | $770,905 | $939,807 |
| EBITDA | $413,848 | $512,821 | $629,417 | $770,905 | $939,807 |
| Interest Expense | $0 | $0 | $0 | $0 | $0 |
| Taxes Incurred | $105,406 | $128,205 | $159,977 | $192,726 | $238,868 |
| Net Profit | $308,443 | $384,616 | $469,440 | $578,179 | $700,940 |
| Net Profit/Sales | 24.48% | 26.11% | 27.27% | 28.73% | 29.80% |
7.5 Projected Cash Flow
Cash flow projections are critical to RTI’s success. The monthly cash flow is shown in the illustration, with one bar representing the cash flow per month and the other representing the monthly balance. The annual cash flow figures are included here in the following table. Detailed monthly numbers are included in the appendix.

| Pro Forma Cash Flow | |||||
| Year 1 | Year 2 | Year 3 | Year 4 | Year 5 | |
| Cash Received | |||||
| Cash from Operations | |||||
| Cash Sales | $630,000 | $736,407 | $860,786 | $1,006,173 | $1,176,116 |
| Cash from Receivables | $526,750 | $718,968 | $840,402 | $982,346 | $1,148,264 |
| Subtotal Cash from Operations | $1,156,750 | $1,455,375 | $1,701,188 | $1,988,519 | $2,324,379 |
| Additional Cash Received | |||||
| Sales Tax, VAT, HST/GST Received | $0 | $0 | $0 | $0 | $0 |
| New Current Borrowing | $0 | $0 | $0 | $0 | $0 |
| New Other Liabilities (interest-free) | $0 | $0 | $0 | $0 | $0 |
| New Long-term Liabilities | $0 | $0 | $0 | $0 | $0 |
| Sales of Other Current Assets | $0 | $0 | $0 | $0 | $0 |
| Sales of Long-term Assets | $0 | $0 | $0 | $0 | $0 |
| New Investment Received | $0 | $0 | $0 | $0 | $0 |
| Subtotal Cash Received | $1,156,750 | $1,455,375 | $1,701,188 | $1,988,519 | $2,324,379 |
| Expenditures | Year 1 | Year 2 | Year 3 | Year 4 | Year 5 |
| Expenditures from Operations | |||||
| Cash Spending | $216,000 | $237,600 | $261,360 | $287,496 | $316,246 |
| Bill Payments | $682,028 | $839,215 | $979,251 | $1,133,858 | $1,319,563 |
| Subtotal Spent on Operations | $898,028 | $1,076,815 | $1,240,611 | $1,421,354 | $1,635,809 |
| Additional Cash Spent | |||||
| Sales Tax, VAT, HST/GST Paid Out | $0 | $0 | $0 | $0 | $0 |
| Principal Repayment of Current Borrowing | $0 | $0 | $0 | $0 | $0 |
| Other Liabilities Principal Repayment | $0 | $0 | $0 | $0 | $0 |
| Long-term Liabilities Principal Repayment | $0 | $0 | $0 | $0 | $0 |
| Purchase Other Current Assets | $0 | $0 | $0 | $0 | $0 |
| Purchase Long-term Assets | $0 | $0 | $0 | $0 | $0 |
| Dividends | $0 | $0 | $0 | $0 | $0 |
| Subtotal Cash Spent | $898,028 | $1,076,815 | $1,240,611 | $1,421,354 | $1,635,809 |
| Net Cash Flow | $258,722 | $378,560 | $460,577 | $567,165 | $688,571 |
| Cash Balance | $358,722 | $737,282 | $1,197,859 | $1,765,024 | $2,453,595 |
7.6 Projected Balance Sheet
The following Balance Sheet shows healthy growth of Net Worth and a strong financial position. The monthly estimates are included in the appendix.
| Pro Forma Balance Sheet | |||||
| Year 1 | Year 2 | Year 3 | Year 4 | Year 5 | |
| Assets | |||||
| Current Assets | |||||
| Cash | $358,722 | $737,282 | $1,197,859 | $1,765,024 | $2,453,595 |
| Accounts Receivable | $103,250 | $120,689 | $141,073 | $164,901 | $192,752 |
| Other Current Assets | $31,588 | $31,588 | $31,588 | $31,588 | $31,588 |
| Total Current Assets | $493,559 | $889,558 | $1,370,519 | $1,961,512 | $2,677,934 |
| Long-term Assets | |||||
| Long-term Assets | $0 | $0 | $0 | $0 | $0 |
| Accumulated Depreciation | $0 | $0 | $0 | $0 | $0 |
| Total Long-term Assets | $0 | $0 | $0 | $0 | $0 |
| Total Assets | $493,559 | $889,558 | $1,370,519 | $1,961,512 | $2,677,934 |
| Liabilities and Capital | Year 1 | Year 2 | Year 3 | Year 4 | Year 5 |
| Current Liabilities | |||||
| Accounts Payable | $58,529 | $69,912 | $81,433 | $94,247 | $109,730 |
| Current Borrowing | $0 | $0 | $0 | $0 | $0 |
| Other Current Liabilities | $0 | $0 | $0 | $0 | $0 |
| Subtotal Current Liabilities | $58,529 | $69,912 | $81,433 | $94,247 | $109,730 |
| Long-term Liabilities | $0 | $0 | $0 | $0 | $0 |
| Total Liabilities | $58,529 | $69,912 | $81,433 | $94,247 | $109,730 |
| Paid-in Capital | $195,675 | $195,675 | $195,675 | $195,675 | $195,675 |
| Retained Earnings | ($69,088) | $239,355 | $623,971 | $1,093,411 | $1,671,590 |
| Earnings | $308,443 | $384,616 | $469,440 | $578,179 | $700,940 |
| Total Capital | $435,030 | $819,646 | $1,289,086 | $1,867,265 | $2,568,205 |
| Total Liabilities and Capital | $493,559 | $889,558 | $1,370,519 | $1,961,512 | $2,677,934 |
| Net Worth | $435,030 | $819,646 | $1,289,086 | $1,867,265 | $2,568,205 |
Appendix
| Sales Forecast | |||||||||||||
| Month 1 | Month 2 | Month 3 | Month 4 | Month 5 | Month 6 | Month 7 | Month 8 | Month 9 | Month 10 | Month 11 | Month 12 | ||
| Sales | |||||||||||||
| Geological Interpretation and Modeling | 0% | $15,750 | $15,750 | $15,750 | $15,750 | $15,750 | $15,750 | $15,750 | $15,750 | $15,750 | $15,750 | $15,750 | $15,750 |
| Mine Design | 0% | $50,400 | $50,400 | $50,400 | $50,400 | $50,400 | $50,400 | $50,400 | $50,400 | $50,400 | $50,400 | $50,400 | $50,400 |
| Mining Optimization | 0% | $9,450 | $9,450 | $9,450 | $9,450 | $9,450 | $9,450 | $9,450 | $9,450 | $9,450 | $9,450 | $9,450 | $9,450 |
| Mine Scheduling | 0% | $25,200 | $25,200 | $25,200 | $25,200 | $25,200 | $25,200 | $25,200 | $25,200 | $25,200 | $25,200 | $25,200 | $25,200 |
| Dump Design and Rehabilitation | 0% | $4,200 | $4,200 | $4,200 | $4,200 | $4,200 | $4,200 | $4,200 | $4,200 | $4,200 | $4,200 | $4,200 | $4,200 |
| Total Sales | $105,000 | $105,000 | $105,000 | $105,000 | $105,000 | $105,000 | $105,000 | $105,000 | $105,000 | $105,000 | $105,000 | $105,000 | |
| Direct Cost of Sales | Month 1 | Month 2 | Month 3 | Month 4 | Month 5 | Month 6 | Month 7 | Month 8 | Month 9 | Month 10 | Month 11 | Month 12 | |
| Geological Interpretation and Modeling | $2,930 | $2,930 | $2,930 | $2,930 | $2,930 | $2,930 | $2,930 | $2,930 | $2,930 | $2,930 | $2,930 | $2,930 | |
| Mine Design | $9,374 | $9,374 | $9,374 | $9,374 | $9,374 | $9,374 | $9,374 | $9,374 | $9,374 | $9,374 | $9,374 | $9,374 | |
| Mining Optimization | $17,577 | $17,577 | $17,577 | $17,577 | $17,577 | $17,577 | $17,577 | $17,577 | $17,577 | $17,577 | $17,577 | $17,577 | |
| Mine Scheduling | $4,687 | $4,687 | $4,687 | $4,687 | $4,687 | $4,687 | $4,687 | $4,687 | $4,687 | $4,687 | $4,687 | $4,687 | |
| Dump Design and Rehabilitation | $781 | $781 | $781 | $781 | $781 | $781 | $781 | $781 | $781 | $781 | $781 | $781 | |
| Subtotal Direct Cost of Sales | $35,349 | $35,349 | $35,349 | $35,349 | $35,349 | $35,349 | $35,349 | $35,349 | $35,349 | $35,349 | $35,349 | $35,349 | |
| Personnel Plan | |||||||||||||
| Month 1 | Month 2 | Month 3 | Month 4 | Month 5 | Month 6 | Month 7 | Month 8 | Month 9 | Month 10 | Month 11 | Month 12 | ||
| CEO, President and Managing Partner | 0% | $5,000 | $5,000 | $5,000 | $5,000 | $5,000 | $5,000 | $5,000 | $5,000 | $5,000 | $5,000 | $5,000 | $5,000 |
| Vice President Operations | 0% | $3,000 | $3,000 | $3,000 | $3,000 | $3,000 | $3,000 | $3,000 | $3,000 | $3,000 | $3,000 | $3,000 | $3,000 |
| Senior Field Engineer | 0% | $1,000 | $1,000 | $1,000 | $1,000 | $1,000 | $1,000 | $1,000 | $1,000 | $1,000 | $1,000 | $1,000 | $1,000 |
| Senior Programmer/Researcher | 0% | $1,000 | $1,000 | $1,000 | $1,000 | $1,000 | $1,000 | $1,000 | $1,000 | $1,000 | $1,000 | $1,000 | $1,000 |
| Vice President of Sales & Marketing | 0% | $3,000 | $3,000 | $3,000 | $3,000 | $3,000 | $3,000 | $3,000 | $3,000 | $3,000 | $3,000 | $3,000 | $3,000 |
| Sales Manager – Mining Engineering | 0% | $1,000 | $1,000 | $1,000 | $1,000 | $1,000 | $1,000 | $1,000 | $1,000 | $1,000 | $1,000 | $1,000 | $1,000 |
| Sales Manager – Geology | 0% | $1,000 | $1,000 | $1,000 | $1,000 | $1,000 | $1,000 | $1,000 | $1,000 | $1,000 | $1,000 | $1,000 | $1,000 |
| General Manager | 0% | $2,000 | $2,000 | $2,000 | $2,000 | $2,000 | $2,000 | $2,000 | $2,000 | $2,000 | $2,000 | $2,000 | $2,000 |
| Administrative Officer | 0% | $1,000 | $1,000 | $1,000 | $1,000 | $1,000 | $1,000 | $1,000 | $1,000 | $1,000 | $1,000 | $1,000 | $1,000 |
| Total People | 9 | 9 | 9 | 9 | 9 | 9 | 9 | 9 | 9 | 9 | 9 | 9 | |
| Total Payroll | $18,000 | $18,000 | $18,000 | $18,000 | $18,000 | $18,000 | $18,000 | $18,000 | $18,000 | $18,000 | $18,000 | $18,000 | |
| General Assumptions | |||||||||||||
| Month 1 | Month 2 | Month 3 | Month 4 | Month 5 | Month 6 | Month 7 | Month 8 | Month 9 | Month 10 | Month 11 | Month 12 | ||
| Plan Month | 1 | 2 | 3 | 4 | 5 | 6 | 7 | 8 | 9 | 10 | 11 | 12 | |
| Current Interest Rate | 8.50% | 8.50% | 8.50% | 8.50% | 8.50% | 8.50% | 8.50% | 8.50% | 8.50% | 8.50% | 8.50% | 8.50% | |
| Long-term Interest Rate | 9.00% | 9.00% | 9.00% | 9.00% | 9.00% | 9.00% | 9.00% | 9.00% | 9.00% | 9.00% | 9.00% | 9.00% | |
| Tax Rate | 30.00% | 25.00% | 25.00% | 25.00% | 25.00% | 25.00% | 25.00% | 25.00% | 25.00% | 25.00% | 25.00% | 25.00% | |
| Other | 0 | 0 | 0 | 0 | 0 | 0 | 0 | 0 | 0 | 0 | 0 | 0 | |
| Pro Forma Profit and Loss | |||||||||||||
| Month 1 | Month 2 | Month 3 | Month 4 | Month 5 | Month 6 | Month 7 | Month 8 | Month 9 | Month 10 | Month 11 | Month 12 | ||
| Sales | $105,000 | $105,000 | $105,000 | $105,000 | $105,000 | $105,000 | $105,000 | $105,000 | $105,000 | $105,000 | $105,000 | $105,000 | |
| Direct Cost of Sales | $35,349 | $35,349 | $35,349 | $35,349 | $35,349 | $35,349 | $35,349 | $35,349 | $35,349 | $35,349 | $35,349 | $35,349 | |
| Other | $0 | $0 | $0 | $0 | $0 | $0 | $0 | $0 | $0 | $0 | $0 | $0 | |
| Total Cost of Sales | $35,349 | $35,349 | $35,349 | $35,349 | $35,349 | $35,349 | $35,349 | $35,349 | $35,349 | $35,349 | $35,349 | $35,349 | |
| Gross Margin | $69,651 | $69,651 | $69,651 | $69,651 | $69,651 | $69,651 | $69,651 | $69,651 | $69,651 | $69,651 | $69,651 | $69,651 | |
| Gross Margin % | 66.33% | 66.33% | 66.33% | 66.33% | 66.33% | 66.33% | 66.33% | 66.33% | 66.33% | 66.33% | 66.33% | 66.33% | |
| Expenses | |||||||||||||
| Payroll | $18,000 | $18,000 | $18,000 | $18,000 | $18,000 | $18,000 | $18,000 | $18,000 | $18,000 | $18,000 | $18,000 | $18,000 | |
| Sales and Marketing and Other Expenses | $5,800 | $9,800 | $9,800 | $11,500 | $11,500 | $9,400 | $9,800 | $9,800 | $9,800 | $9,800 | $15,800 | $9,400 | |
| Depreciation | $0 | $0 | $0 | $0 | $0 | $0 | $0 | $0 | $0 | $0 | $0 | $0 | |
| Leased Equipment | $0 | $0 | $0 | $0 | $0 | $0 | $0 | $0 | $0 | $0 | $0 | $0 | |
| Utilities | $600 | $600 | $600 | $600 | $600 | $600 | $600 | $600 | $600 | $600 | $600 | $600 | |
| Insurance | $180 | $180 | $180 | $180 | $180 | $180 | $180 | $180 | $180 | $180 | $180 | $180 | |
| Rent | $3,500 | $3,500 | $3,500 | $3,500 | $3,500 | $3,500 | $3,500 | $3,500 | $3,500 | $3,500 | $3,500 | $3,500 | |
| Payroll Taxes | 15% | $2,700 | $2,700 | $2,700 | $2,700 | $2,700 | $2,700 | $2,700 | $2,700 | $2,700 | $2,700 | $2,700 | $2,700 |
| Other | $0 | $0 | $0 | $0 | $0 | $0 | $0 | $0 | $0 | $0 | $0 | $0 | |
| Total Operating Expenses | $30,780 | $34,780 | $34,780 | $36,480 | $36,480 | $34,380 | $34,780 | $34,780 | $34,780 | $34,780 | $40,780 | $34,380 | |
| Profit Before Interest and Taxes | $38,871 | $34,871 | $34,871 | $33,171 | $33,171 | $35,271 | $34,871 | $34,871 | $34,871 | $34,871 | $28,871 | $35,271 | |
| EBITDA | $38,871 | $34,871 | $34,871 | $33,171 | $33,171 | $35,271 | $34,871 | $34,871 | $34,871 | $34,871 | $28,871 | $35,271 | |
| Interest Expense | $0 | $0 | $0 | $0 | $0 | $0 | $0 | $0 | $0 | $0 | $0 | $0 | |
| Taxes Incurred | $11,661 | $8,718 | $8,718 | $8,293 | $8,293 | $8,818 | $8,718 | $8,718 | $8,718 | $8,718 | $7,218 | $8,818 | |
| Net Profit | $27,209 | $26,153 | $26,153 | $24,878 | $24,878 | $26,453 | $26,153 | $26,153 | $26,153 | $26,153 | $21,653 | $26,453 | |
| Net Profit/Sales | 25.91% | 24.91% | 24.91% | 23.69% | 23.69% | 25.19% | 24.91% | 24.91% | 24.91% | 24.91% | 20.62% | 25.19% | |
| Pro Forma Cash Flow | |||||||||||||
| Month 1 | Month 2 | Month 3 | Month 4 | Month 5 | Month 6 | Month 7 | Month 8 | Month 9 | Month 10 | Month 11 | Month 12 | ||
| Cash Received | |||||||||||||
| Cash from Operations | |||||||||||||
| Cash Sales | $52,500 | $52,500 | $52,500 | $52,500 | $52,500 | $52,500 | $52,500 | $52,500 | $52,500 | $52,500 | $52,500 | $52,500 | |
| Cash from Receivables | $0 | $1,750 | $52,500 | $52,500 | $52,500 | $52,500 | $52,500 | $52,500 | $52,500 | $52,500 | $52,500 | $52,500 | |
| Subtotal Cash from Operations | $52,500 | $54,250 | $105,000 | $105,000 | $105,000 | $105,000 | $105,000 | $105,000 | $105,000 | $105,000 | $105,000 | $105,000 | |
| Additional Cash Received | |||||||||||||
| Sales Tax, VAT, HST/GST Received | 0.00% | $0 | $0 | $0 | $0 | $0 | $0 | $0 | $0 | $0 | $0 | $0 | $0 |
| New Current Borrowing | $0 | $0 | $0 | $0 | $0 | $0 | $0 | $0 | $0 | $0 | $0 | $0 | |
| New Other Liabilities (interest-free) | $0 | $0 | $0 | $0 | $0 | $0 | $0 | $0 | $0 | $0 | $0 | $0 | |
| New Long-term Liabilities | $0 | $0 | $0 | $0 | $0 | $0 | $0 | $0 | $0 | $0 | $0 | $0 | |
| Sales of Other Current Assets | $0 | $0 | $0 | $0 | $0 | $0 | $0 | $0 | $0 | $0 | $0 | $0 | |
| Sales of Long-term Assets | $0 | $0 | $0 | $0 | $0 | $0 | $0 | $0 | $0 | $0 | $0 | $0 | |
| New Investment Received | $0 | $0 | $0 | $0 | $0 | $0 | $0 | $0 | $0 | $0 | $0 | $0 | |
| Subtotal Cash Received | $52,500 | $54,250 | $105,000 | $105,000 | $105,000 | $105,000 | $105,000 | $105,000 | $105,000 | $105,000 | $105,000 | $105,000 | |
| Expenditures | Month 1 | Month 2 | Month 3 | Month 4 | Month 5 | Month 6 | Month 7 | Month 8 | Month 9 | Month 10 | Month 11 | Month 12 | |
| Expenditures from Operations | |||||||||||||
| Cash Spending | $18,000 | $18,000 | $18,000 | $18,000 | $18,000 | $18,000 | $18,000 | $18,000 | $18,000 | $18,000 | $18,000 | $18,000 | |
| Bill Payments | $6,993 | $59,826 | $60,847 | $60,889 | $62,122 | $62,069 | $60,557 | $60,847 | $60,847 | $60,847 | $60,997 | $65,187 | |
| Subtotal Spent on Operations | $24,993 | $77,826 | $78,847 | $78,889 | $80,122 | $80,069 | $78,557 | $78,847 | $78,847 | $78,847 | $78,997 | $83,187 | |
| Additional Cash Spent | |||||||||||||
| Sales Tax, VAT, HST/GST Paid Out | $0 | $0 | $0 | $0 | $0 | $0 | $0 | $0 | $0 | $0 | $0 | $0 | |
| Principal Repayment of Current Borrowing | $0 | $0 | $0 | $0 | $0 | $0 | $0 | $0 | $0 | $0 | $0 | $0 | |
| Other Liabilities Principal Repayment | $0 | $0 | $0 | $0 | $0 | $0 | $0 | $0 | $0 | $0 | $0 | $0 | |
| Long-term Liabilities Principal Repayment | $0 | $0 | $0 | $0 | $0 | $0 | $0 | $0 | $0 | $0 | $0 | $0 | |
| Purchase Other Current Assets | $0 | $0 | $0 | $0 | $0 | $0 | $0 | $0 | $0 | $0 | $0 | $0 | |
| Purchase Long-term Assets | $0 | $0 | $0 | $0 | $0 | $0 | $0 | $0 | $0 | $0 | $0 | $0 | |
| Dividends | $0 | $0 | $0 | $0 | $0 | $0 | $0 | $0 | $0 | $0 | $0 | $0 | |
| Subtotal Cash Spent | $24,993 | $77,826 | $78,847 | $78,889 | $80,122 | $80,069 | $78,557 | $78,847 | $78,847 | $78,847 | $78,997 | $83,187 | |
| Net Cash Flow | $27,507 | ($23,576) | $26,153 | $26,111 | $24,878 | $24,931 | $26,443 | $26,153 | $26,153 | $26,153 | $26,003 | $21,813 | |
| Cash Balance | $127,507 | $103,931 | $130,084 | $156,195 | $181,073 | $206,003 | $232,446 | $258,599 | $284,752 | $310,905 | $336,908 | $358,722 | |
| Pro Forma Balance Sheet | |||||||||||||
| Month 1 | Month 2 | Month 3 | Month 4 | Month 5 | Month 6 | Month 7 | Month 8 | Month 9 | Month 10 | Month 11 | Month 12 | ||
| Assets | Starting Balances | ||||||||||||
| Current Assets | |||||||||||||
| Cash | $100,000 | $127,507 | $103,931 | $130,084 | $156,195 | $181,073 | $206,003 | $232,446 | $258,599 | $284,752 | $310,905 | $336,908 | $358,722 |
| Accounts Receivable | $0 | $52,500 | $103,250 | $103,250 | $103,250 | $103,250 | $103,250 | $103,250 | $103,250 | $103,250 | $103,250 | $103,250 | $103,250 |
| Other Current Assets | $31,588 | $31,588 | $31,588 | $31,588 | $31,588 | $31,588 | $31,588 | $31,588 | $31,588 | $31,588 | $31,588 | $31,588 | $31,588 |
| Total Current Assets | $131,588 | $211,594 | $238,769 | $264,922 | $291,032 | $315,910 | $340,841 | $367,284 | $393,437 | $419,590 | $445,743 | $471,746 | $493,559 |
| Long-term Assets | |||||||||||||
| Long-term Assets | $0 | $0 | $0 | $0 | $0 | $0 | $0 | $0 | $0 | $0 | $0 | $0 | $0 |
| Accumulated Depreciation | $0 | $0 | $0 | $0 | $0 | $0 | $0 | $0 | $0 | $0 | $0 | $0 | $0 |
| Total Long-term Assets | $0 | $0 | $0 | $0 | $0 | $0 | $0 | $0 | $0 | $0 | $0 | $0 | $0 |
| Total Assets | $131,588 | $211,594 | $238,769 | $264,922 | $291,032 | $315,910 | $340,841 | $367,284 | $393,437 | $419,590 | $445,743 | $471,746 | $493,559 |
| Liabilities and Capital | Month 1 | Month 2 | Month 3 | Month 4 | Month 5 | Month 6 | Month 7 | Month 8 | Month 9 | Month 10 | Month 11 | Month 12 | |
| Current Liabilities | |||||||||||||
| Accounts Payable | $5,000 | $57,797 | $58,819 | $58,819 | $60,051 | $60,051 | $58,529 | $58,819 | $58,819 | $58,819 | $58,819 | $63,169 | $58,529 |
| Current Borrowing | $0 | $0 | $0 | $0 | $0 | $0 | $0 | $0 | $0 | $0 | $0 | $0 | $0 |
| Other Current Liabilities | $0 | $0 | $0 | $0 | $0 | $0 | $0 | $0 | $0 | $0 | $0 | $0 | $0 |
| Subtotal Current Liabilities | $5,000 | $57,797 | $58,819 | $58,819 | $60,051 | $60,051 | $58,529 | $58,819 | $58,819 | $58,819 | $58,819 | $63,169 | $58,529 |
| Long-term Liabilities | $0 | $0 | $0 | $0 | $0 | $0 | $0 | $0 | $0 | $0 | $0 | $0 | $0 |
| Total Liabilities | $5,000 | $57,797 | $58,819 | $58,819 | $60,051 | $60,051 | $58,529 | $58,819 | $58,819 | $58,819 | $58,819 | $63,169 | $58,529 |
| Paid-in Capital | $195,675 | $195,675 | $195,675 | $195,675 | $195,675 | $195,675 | $195,675 | $195,675 | $195,675 | $195,675 | $195,675 | $195,675 | $195,675 |
| Retained Earnings | ($69,088) | ($69,088) | ($69,088) | ($69,088) | ($69,088) | ($69,088) | ($69,088) | ($69,088) | ($69,088) | ($69,088) | ($69,088) | ($69,088) | ($69,088) |
| Earnings | $0 | $27,209 | $53,363 | $79,516 | $104,394 | $129,272 | $155,725 | $181,878 | $208,031 | $234,184 | $260,337 | $281,990 | $308,443 |
| Total Capital | $126,588 | $153,797 | $179,950 | $206,103 | $230,981 | $255,859 | $282,312 | $308,465 | $334,618 | $360,771 | $386,924 | $408,577 | $435,030 |
| Total Liabilities and Capital | $131,588 | $211,594 | $238,769 | $264,922 | $291,032 | $315,910 | $340,841 | $367,284 | $393,437 | $419,590 | $445,743 | $471,746 | $493,559 |
| Net Worth | $126,588 | $153,797 | $179,950 | $206,103 | $230,981 | $255,859 | $282,312 | $308,465 | $334,618 | $360,771 | $386,924 | $408,577 | $435,030 |

