
Sammy's Family Entertainment Center
Executive Summary
The Business
Sammy’s is a Family Entertainment Center with a world class, natural looking miniature golf course acting as the initial anchor for other attractions to be added later. Family Entertainment is a highly profitable industry that has been growing rapidly over the past several years. This is due largely to a trend within the country to return to family values. The initial profit centers will be the miniature golf course, video arcade, climbing wall, and food service.
Marketing
There are 150,000 people living within a 15-mile radius of the Firefly County site. One of the interesting facts about the miniature golf business is the breadth of the customer base. While families with children may act as an anchor, seniors, teens, and corporate customers add significant income. A variety of fun promotions keep the business profitable during the entire season. While our marketing plan is devised from other successful plans in the industry, there will be some additions as we start the business. Mulligan-Bogey Leisure Builders, our construction experts, include a marketing plan with golf course completion. This plan includes input from over 200 course owners and shows the most successful marketing programs being implemented across the country.
Management
John and Michelle Putteer have successful experience in small business ownership, personnel management, and financial management. The miniature golf course operates with only one person during the day and two or three people during peak hours. The low personnel requirement makes management easy and keeps employee costs at a minimum.
Financial
The low inventory and low operational cost of a miniature golf course allow owners to reap profits early. With first year sales projections conservatively planned this business should be profitable from year one.
Investment Objectives
Sammy’s will become operational with an initial investment from owners John and Michelle Putteer and a long-term loan. One local commercial lender has indicated an interest in the conceptual business. John has also been approached by local investors who are interested in the opportunity to invest in the project.
1.1 Keys to Success
- A highly visible, well-trafficked site near the center of our service area.
- Friendly, happy employees providing superior customer service.
- A safe, clean environment that the community will be proud of.
- Have fun while delivering a quality product.
1.2 Objectives
The main objective of Sammy’s is to use a “World Class” miniature golf course to provide a safe, relaxing setting for family and friends to enjoy quality time together, while participating in fun and exciting outdoor activities.
Objectives include:
- Open for business on April 15.
- Be profitable in the first year of operation.
- First year sales above par.
- Add a Go-Kart track to the facility after three years of operation.
1.3 Mission
The Mission of Sammy’s is to provide THE fun, affordable, family entertainment center for community members living in and around Firefly County.
Company Summary
Sammy’s is a Family Entertainment Center with a world class, natural looking miniature golf course acting as the initial anchor for other attractions to be added later. Sammy’s hallmark will be a large, natural looking waterfall and water features. Family Entertainment is a highly profitable industry that has been growing rapidly over the past decade. This is due largely to a trend within the country to return to family values. The initial profit centers will be:
- miniature golf course
- video arcade
- climbing wall
- food service
Miniature golf is NOT golf in miniature. However, miniature golf does have a lot in common with regulation golf. To be interesting, miniature golf holes must have the contour changes found on a regulation green, which cause the ball to break and turn as it rolls toward the cup. Undulations and banking give the game an element of challenge and fun.
The anchor of Sammy’s is a “new concept” miniature golf course. The industry also refers to these as “sports courses.” Unlike miniature golf courses of old, windmills and standing bears are not found on today’s courses. Miniature golf courses, however, do need unique elements to hold the players’ interest. Greens that bring water, sand traps and rough turf into play add this uniqueness to miniature golf, while still maintaining an interesting and challenging game. Modern miniature golf courses are designed with attractive landscaping, water features, and elevation changes. A waterfall is the focal point of the Sammy’s course design. The water is a defining characteristic, in both its sight and sound.
The golf course is being designed and built by the most respected miniature golf course company in the United States, Mulligan-Bogey Leisure Builders, Inc. Four other builders were considered, but did not meet the professional standards of Mulligan-Bogey Leisure Builders. Mulligan-Bogey has built more than 400 profitable courses during their 40 years in business. They have demonstrated knowledge of what is required to make a successful facility. The course will be challenging, but not overly so. This will bring customers back to attempt to better their previous score.
2.1 Start-up Summary
Total start-up cost include construction, equipment, initial expenses, and working capital. Start-up assets required include short-term assets (office furniture and kitchen equipment), and we need initial cash to handle the first month of operations. The details are included in the start-up table.
Owners are making a cash investment. Additional loan financing is currently being arranged for ramp up and launch.

| Start-up | |
| Requirements | |
| Start-up Expenses | |
| Legal | $1,250 |
| Brochures | $1,000 |
| Insurance | $7,500 |
| Rent | $1 |
| Start-up Food costs | $500 |
| Supplies and Disposables | $3,250 |
| Total Start-up Expenses | $13,501 |
| Start-up Assets | |
| Cash Required | $13,769 |
| Other Current Assets | $23,230 |
| Long-term Assets | $649,500 |
| Total Assets | $686,499 |
| Total Requirements | $700,000 |
| Start-up Funding | |
| Start-up Expenses to Fund | $13,501 |
| Start-up Assets to Fund | $686,499 |
| Total Funding Required | $700,000 |
| Assets | |
| Non-cash Assets from Start-up | $672,730 |
| Cash Requirements from Start-up | $13,769 |
| Additional Cash Raised | $0 |
| Cash Balance on Starting Date | $13,769 |
| Total Assets | $686,499 |
| Liabilities and Capital | |
| Liabilities | |
| Current Borrowing | $0 |
| Long-term Liabilities | $560,000 |
| Accounts Payable (Outstanding Bills) | $0 |
| Other Current Liabilities (interest-free) | $0 |
| Total Liabilities | $560,000 |
| Capital | |
| Planned Investment | |
| Owners Equity Investment | $140,000 |
| Other | $0 |
| Additional Investment Requirement | $0 |
| Total Planned Investment | $140,000 |
| Loss at Start-up (Start-up Expenses) | ($13,501) |
| Total Capital | $126,499 |
| Total Capital and Liabilities | $686,499 |
| Total Funding | $700,000 |
2.2 Company Ownership
Sammy’s will be created as a privately owned Subchapter C Corporation, registered in Firefly County. Stock will be equally held by the principal investors John and Michelle Putteer. As of this writing, the corporation has not been chartered. Other options of legal formation are still being investigated.
Products and Services
Miniature Golf
The primary attraction is the world class 18-hole miniature golf course, where participants have fun for only $5 per round. The challenge in miniature golf is to make the course interesting to play. Interesting shots bring repeat business. Undulations, banking, the size of the greens, the position of the cups, the intermixing of easier holes with more difficult holes to prevent back-up on the course, and hundreds of other little refinements, which come only from experience, are the difference between success and failure.
On a well-designed course, a player is rewarded for a good putt without being overly penalized for a poor putt. If you hit the putt correctly it will go in the cup. If you hit it poorly it may take two or three putts to get it in the cup, but you are not “out of play” or holding up the group behind you.

Players take about one hour to complete a round of golf. The course can easily accommodate up to 100 players per hour during peak times. These numbers are common on weekend evenings during the summer season.
Rock Climbing Wall
The 24-foot portable rock-climbing wall offers an element of adventure for those interested in extreme sports. The wall is located on site most of the time, but has the ability to be set up at fairs/festivals, school parking lots, or company picnics.
The climbing wall is mounted on a double axle trailer. The wall is raised and lowered by the trailer hydraulics in a few minutes. Complete set-up takes only ten minutes. There are three climbing stations on the wall with state of the art auto belay systems (automatically lets you down slowly); this allows everyone a chance to climb without fear of injury.
Video Arcade
The video arcade has a mix of popular games for children of all ages. The games vary in type and skill level. Some are physically oriented; others focus on hand eye coordination. The most profitable games issue tickets that may be redeemed for prizes. The arcade will be operated on a 50-50 split with a regional arcade company. In a national survey of FEC operators, respondents reported coin-operated games, both redemption/skill and video, were the second top attraction and revenue source, behind birthday parties. While FEC operators may have different attractions, all of them have video and/or redemption games.
Food Service
A small snack bar will serve fountain drinks, hot dogs, chips, and frozen custard (ice cream). The food area will also provide space for birthdays and other private parties. A renter may use our food fare or use our outside caterer.
Customers will walk through the food service area to and from the miniature golf course. As the customers walk off the 18th hole they find hot dogs, chips, and fountain drinks awaiting them. Frozen custard is a summer favorite too. Besides lending the feel of a full outing experience, the food service is a profitable portion of the business.
Vending
In addition to the arcade business there are two other profit centers using vending machines. On the course, a bottled water vending machine is located between the 9th and 10th hole.The final fun profit center comes from three fish food vending machines located at the Koi ponds, which are a central part of the golf experience. Other course operators are redeeming $13,000 per year from their fish food vending machines.
On a national level, the top revenue generators at FEC’s are motion simulators (arcade), birthday and other parties, miniature golf, food and beverage, and go-karts.
3.1 Future Growth
- Go-Karts
- Second 18 holes of miniature golf
- Batting cages
- Trampoline Thing
- Logo sportswear sales
- Remote control 4WD vehicles
- Lagoon for bumper boats and/or remote control boats.
Market Analysis Summary
There are over 150,000 people living within a 15-mile radius of the Firefly County site. One of the interesting facts about the miniature golf business is the breadth of the customer base. While families with children may act as an anchor, seniors, teens, and corporate customers add significant income. A variety of fun promotions keeps the business profitable during the entire season. While our marketing plan is devised from other successful plans in the industry, there will be some additions as we start the business. Mulligan-Bogey Leisure Builders includes a marketing plan with course completion. This plan includes input from over 200 course owners and shows the most successful marketing programs being implemented across the country.
Customers will appreciate Sammy’s because of the high value to cost ratio our services provide. There is nowhere else in our area where a customer can enjoy an hour, or more, of entertainment for only $5. When the customer considers the high quality of the facility, the friendly staff and the variety of entertainment available, Sammy’s will be the first choice for individual, family, or group entertainment.
4.1 Market Segmentation
Our market segmentation scheme is fairly straightforward. The Miniature Golf Club of America and the Association of Fun and Relaxation both have excellent market research and have highlighted the following target audiences:
Individuals: There are over 150,000 people living within 15 miles of our location in Firefly County. The typical customer ranges in age from six to fifty-four, with family income over $20,900.[1] This large swath of society provides a broad customer base in Firefly County.
Families with young children enjoy the outings. Miniature golf is one of the few activities teenagers find acceptable to do with parents. This is demonstrated in research, which shows that children 5 to 18 years old, with at least one adult, represent the largest single audience at 36.9%.[2]
Teens and young adults, age 15 to 24, will make outings a date or group event. We note here that teens fit into two separate market segments. They may enjoy an outing as part of a family unit or independently as part of a peer group.
Adults, age 25 to 54, find the recreation enjoyable, with or without children or grandchildren.
Seniors, age 55 to 74, find the gentle form of recreation refreshing, whether alone or with grandchildren.
Private groups using FECs range from children’s birthday parties to family get togethers.
Organizations using the centers may be church groups, civic organizations, office get togethers, customer appreciation events, or corporate parties.
While the prime time for individual customers is evening and weekend, the wide group customer base allows Sammy’s to schedule daytime and weekday hours for maximum facility utilization.
Understanding and satisfying the customers’ needs are the key elements to a successful operation. The business goal is three-fold:
- Get the customer in the door
- Keep them entertained
- Get them to come back![3]
___________________________________________________________
[1] Telephone conversation, Sam Tix, President of the “Miniature Golf Club of America”
[2] Association of Fun and Relaxation 2002 annual report
[3] Association of Fun and Relaxation 2002 annual report

| Market Analysis | |||||||
| Year 1 | Year 2 | Year 3 | Year 4 | Year 5 | |||
| Potential Customers | Growth | CAGR | |||||
| Ages 5 to 14 | 1% | 24,501 | 24,783 | 25,068 | 25,356 | 25,648 | 1.15% |
| Ages 15 to 19 | 1% | 15,525 | 15,704 | 15,884 | 16,067 | 16,252 | 1.15% |
| Ages 20 to 24 | 1% | 16,851 | 17,045 | 17,241 | 17,439 | 17,640 | 1.15% |
| Ages 25 to 34 | 1% | 22,795 | 23,057 | 23,322 | 23,591 | 23,862 | 1.15% |
| Ages 35 to 44 | 1% | 25,918 | 26,216 | 26,518 | 26,822 | 27,131 | 1.15% |
| Ages 45 to 54 | 1% | 25,889 | 26,187 | 26,488 | 26,792 | 27,101 | 1.15% |
| Ages 55 to 74 | 1% | 27,119 | 27,431 | 27,746 | 28,065 | 28,388 | 1.15% |
| Total | 1.15% | 158,598 | 160,422 | 162,267 | 164,133 | 166,020 | 1.15% |
4.2 Target Market Segment Strategy
The Family Entertainment Industry has been enjoying significant growth in the last decade. Along with this growth has come research to assist the industry in further development. The markets listed below are proven segments, across the nation, for FECs to target in their marketing efforts.
A. Individuals
Families with young children enjoy outings. As the children mature, miniature golf is one of the few activities teenagers find acceptable to do with parents.[1] This is demonstrated in research, which shows that children 5 to 18 years old, with at least one adult, represent the largest market segment (36.9%) attending FECs.[2]
Teens and young adults will make the outing a date. FECs have proven popular with college age students. The proximity of Southeast State University and Firefly Community College make this segment particularly attractive. While many state college students travel home for the summer, the community college students live, or stay in the area.
Adults and seniors find the gentle form of recreation enjoyable, with or without children or grandchildren.
B. Groups
Private groups using FECs include:
- Birthday parties
- Family get togethers
Organizations using FECs include:
- Church groups
- Civic organizations
- Office get togethers
- Customer appreciation events
- Corporate parties
- Group fundraisers
Group events are particularly desirable because:
- A large group of customers can be scheduled for off-peak hours
- Parties breed other parties as guests decide they want to book a similar event
- These are low cost, high profit events, that require little or no additional staffing
___________________________________________________________
[1] Telephone conversation, Sam Tix, President of the “Miniature Golf Club of America”
[2] Association of Fun and Relaxation 2002 annual report
4.3 Service Business Analysis
Family Entertainment, or Fun Centers (FEC) are defined by the Association of Fun and Relaxation (AFAR) as, “unique community-based recreation/entertainment destinations with family appeal and a reliance on repeat customers for their success.” A facility is considered an FEC if it contains three or more of the following elements as major attractions: miniature golf, batting cages, bumper boats/cars, go karts, rides, coin operated games, and soft modular play areas. After nearly a decade of exponential growth, Family Entertainment Centers are still a growing segment of the amusement industry.
In a survey conducted for the 2002 AFAR Annual Report, 89% of respondents reported increased business revenues as the new century began. In the same survey, respondents indicated 73% of customers spent over $10 per person.
Family Entertainment Centers are successful in communities with populations as small as 40,000. Profitable FECs also exist in smaller communities with adequate trade areas.
4.3.1 Competition and Buying Patterns
Direct competition for identical facilities is not found in our service area. While there are competitive miniature golf courses in Wedgeville, Mashie Woods, Cleek, and St. Andrews, they are all well outside Sammy’s service area.
There are direct competitors in the immediate area for some components of Sammy’s.
- There is a video arcade in the Mall. This established facility is frequently busy with children whose parents are shopping in the mall. Other customers are junior and senior high school children who are there with friends, just “hanging out”. This competing arcade has the disadvantage of being a one-dimensional facility. They cannot offer birthday parties, miniature golf, or anything but arcade games.
- There is a miniature golf course on Hwy 20 just outside Niblick City. This facility is not conducive to children because the main attraction is a Par 3 golf course with a bar in the clubhouse. The course does not offer birthday parties or other complimentary attractions.
The fact that there are not serious direct competitors in Firefly County does not mean Sammy’s will not compete with other established recreation and amusement activities for the consumer’s business. Sammy’s will target marketing efforts at indirect competition, such as:
- Movie theaters
- Bowling alleys
- Roller skating rinks
- Cape Speedway racetrack
- University sporting events
- Par 3 golf course
- Video arcade
Sammy’s also recognizes the indirect competition from local restaurants.
Sammy’s realizes that there is competition for the customer’s dollar. As the local economy worsens with the recent closure of more mills in the local area, lower income families will watch their spending carefully. Although this is an area of concern, it is also an area where Sammy’s low cost will be appealing to the consumer.
While many industries experienced downturns during 2001, 66% of FEC owners experienced steady, or growing, revenues. It is important to note that 24% of respondents to the national survey were not open for a full year before the survey. Only 11% reported declining revenues. To further support the validity of the FEC industry in economic downturns, it is noted that 73% of customers spent over $10 per person in 2001. This is a big jump over previous years where only 43% of customers had this level of spending. During good times FECs do well. During hard economic times families redirect scarce recreational resources to these low cost type of activities and FECs do even better.
History has proven there are two types of businesses that thrive in depressed economic times. These two categories of businesses are alcohol and family entertainment. As far back as the depression of the early 30s, the family entertainment industry has performed well in prosperous times and in economic downturns.
Strategy and Implementation Summary
John and Michelle Putteer enjoy an unusual position in seeking investors. Many businesses in the early stage of their plan are wondering where to get funding. The Putteer’s have both institutional and private investors who have expressed an interest in financing the Sammy’s concept.
As noted elsewhere, this new concept in family entertainment has proven to be a popular and worthwhile business.
5.1 Competitive Edge
Sammy’s has several distinct competitive advantages over possible competitors.
We need to emphasize again, this “new concept” miniature golf course will be the first one in the service area. The big signature waterfall, large course with water features, and additional attractions will truly make Sammy’s a “one of a kind” facility.
We mentioned two direct competitors when considering competition. But Sammy’s has a large advantage over both:
- Competitor’s problem: The miniature golf course on Hwy 20 just outside Niblick City is an updated, remodeled version of the old style miniature golf course. But this facility is not “kid friendly.” The main feature is a Par 3 golf course with a tavern in the club house. There is not even an appropriate rest room for families/children to use.
Sammy’s advantage: Sammy’s will be the first and only facility of its type in the service area. The facility is designed to be “family friendly” throughout. Sammy’s will offer a much better value for an equal price. When the consumer considers the clean, attractive, multi-dimensional, kid friendly facility, there will be little question which provides the better value.
- Competitor’s problem: The video arcade in the local mall is a one dimensional facility that only offers video games. They have no other attractions that would interest a family. They cannot offer birthday parties, or other group gatherings. The typical customer at this facility is the unsupervised child/teenager visiting while his parents are shopping.
Sammy’s advantage: The dimly lit mall arcade is no comparison for Sammy’s clean, supervised multi-dimensional facility. Again, when compared side by side, there will be little question as to the better value.
It is important to address the indirect competitors in our service area. These indirect competitors come into play when people are considering an outing, but are not sure where to go. Sammy’s has a distinct advantage in pricing over the competitors. There is also an attraction to Sammy’s as the newest entertainment type in the area, whereas other indirect competitors no longer have a “novelty” appeal to the consumers.
The combination of price, novelty, and choices of activities from multi-dimensional offerings clearly makes Sammy’s the competitive leader in family entertainment.
5.2 Marketing Strategy
Sammy’s will be positioned as a relaxing, worry-free environment where friends and families enjoy time together. This unique new facility will draw return visitors to the attractive, clean, safe setting.
Carefully designed advertising and promotions will accurately target the spectrum of customers identified above in the Target Market Segmentation topic.
While fun and excitement are the main draws that bring customers in the door, the value pricing and excellent location are also important factors.
Sammy’s pricing is designed to appeal to all levels of the economic spectrum. A game of miniature golf will only be $5 per person. Children under five are free with an adult. This price is lower than a movie and the experience lasts as long. As noted above, family entertainment is a high priority.
The arcade games will operate with tokens. Free tokens can be given to each participant at a birthday party, each golf game, or other marketing promotions. Tokens are also available for sale at the low price of five tokens for one dollar.
5.3 Sales Strategy
Sammy’s is in the enviable position of having customers who come to the facility with the intent to purchase. But we do not take lightly the need to treat our customers in a manner congruent with the fun loving, relaxing image of Sammy’s. Our friendly, energetic, fun-loving staff will be trained to make the experience memorable and enjoyable, leaving the customer with a desire to return.
The staff will be trained to maximize the sale by adding concessions, arcade, and climbing wall to the golfing experience. We will use promotions and staff to inform the customer about the availability of our facility for group events.
Another factor in garnering repeat customers is the challenge to better their score on the next round. For the truly competitive miniature golfer, Sammy’s involvement with the Mulligan-Bogey Cup Championship offers an appealing incentive for those intrigued by the $10,000 grand prize. This national event is held each year at one of the Mulligan-Bogey built miniature golf courses.
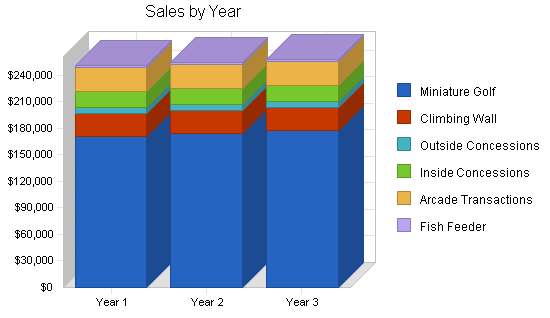
5.3.1 Sales Forecast
The forecast presented here is realistic, but conservative. The course will open March 15 each year. Sammy’s is closed each January and February. The reader should note second year revenues will likely be higher than presented because of consumer awareness of the facility after the first year.
Actual usage from existing courses, with similar demographics and seasonal weather patterns, was considered when making these forecasts. Sammy’s reduced the numbers in order to make a conservative forecast. For a list of actual numbers see the Builder’s Estimate topic, below.
Parties have not been included in these numbers because they are so difficult to forecast. But existing course owners report parties as a significant portion of their income. Therefore, Sammy’s will aggressively market their facilities for all types of parties. Once again we see the conservative nature of the forecast. The additional revenue will be realized with almost no increase in sales costs.
The climbing wall will only be available during peak hours because another employee is needed on the wall whenever it is in use. This wall is mobile and can be set up at other locations for both cash flow and marketing purposes.
Outside concessions projects that 20% of golfers will purchase a bottle of water from the outside vending machine.
Inside concessions projections are based on 35% of golfers visiting our snack bar and spending an average of $2.
Forty percent of golfers will stop in the arcade to play skill or action games. While this figure may be slightly high, it does not consider individuals who may not play miniature golf, but come for the arcade only. Arcade revenues are split 50/50 with the machine owners.
The fish feeder is an idea so effective it is humorous to watch. One miniature golf course owner spent money for years to feed his fish. Then he put vending machines out and discovered another profit center earning over $13,000 the first year. The Department of Fish and Wildlife discovered the same thing when they added vending machines at their hatcheries.
Overall growth is low because attendance at FECs levels, or declines slightly, after the first few years of operation due to the fact that the novelty wears off. To offset a decline in revenues, successful FECs change the appearance of the course with new landscaping and decorative layouts.

| Sales Forecast | |||
| Year 1 | Year 2 | Year 3 | |
| Sales | |||
| Miniature Golf | $170,760 | $174,175 | $177,659 |
| Climbing Wall | $25,614 | $25,614 | $25,614 |
| Outside Concessions | $6,831 | $6,831 | $6,831 |
| Inside Concessions | $17,930 | $17,930 | $17,930 |
| Arcade Transactions | $27,321 | $27,321 | $27,321 |
| Fish Feeder | $2,562 | $2,562 | $2,562 |
| Total Sales | $251,018 | $254,433 | $257,917 |
| Direct Cost of Sales | Year 1 | Year 2 | Year 3 |
| Outside Concessions | $1,707 | $1,741 | $1,776 |
| Inside Concessions | $6,275 | $6,401 | $6,529 |
| Arcade Transactions | $13,661 | $13,661 | $13,661 |
| Fish Feeder | $512 | $522 | $533 |
| Subtotal Direct Cost of Sales | $22,155 | $22,325 | $22,498 |
5.4 Milestones
The major milestones are separated into three categories:
- The planning, or pre-construction phase
- The construction phase
- The operational phase
The business is the creation of John Putteer, who is solely responsible for oversight and coordination of the entire project.
The dollar figures used in the milestones table are approximate numbers, based on current estimates and projections within the business plan.
Funding: Both commercial and private investors have expressed an interest in reading the completed plan. They have also expressed a genuine belief in this proposal and have indicated an early positive interest in financing the project.
Construction: While John Putteer is the project coordinator, other contractors will be utilized during the course of construction. The General Contractor will be Fairway Construction from Firefly. The miniature golf course will be built by Mulligan-Bogey Leisure Builders.

| Milestones | |||||
| Milestone | Start Date | End Date | Budget | Manager | Department |
| Complete Business Plan | 2/15/2004 | 5/24/2004 | $0 | Davis | Owner/Operator |
| Property Under Contract | 6/1/2004 | 8/15/2004 | $20,000 | Davis | Owner/Operator |
| Secure Funding Commitments | 6/15/2004 | 8/15/2004 | $0 | Davis | Owner/Operator |
| Engineering/Site Plans | 8/15/2004 | 9/15/2004 | $20,000 | Davis | Owner/Operator |
| Permits | 9/15/2004 | 10/15/2004 | $20,000 | Davis | Owner/Operator |
| Construction | 10/15/2004 | 3/15/2005 | $589,500 | Davis | Owner/Operator |
| Interview & Hire Personnel | 3/15/2005 | 3/31/2005 | $150 | Davis | Owner/Operator |
| Train Personnel | 4/1/2005 | 4/15/2005 | $350 | Davis | Owner/Operator |
| Marketing & Promotions | 4/1/2005 | 5/31/2005 | $2,400 | Davis | Owner/Operator |
| Open for Business | 4/15/2005 | 5/15/2005 | $500 | Davis | Owner/Operator |
| Grand Opening | 5/16/2005 | 5/29/2005 | $3,150 | Davis | Owner/Operator |
| Totals | $656,050 | ||||
Management Summary
John and Michelle both manage people in their current careers. John is an Engineer/Paramedic making split-second life and death decisions on a daily basis. He supervises another fire fighter on the ambulance. For five years John acted as a Captain for the Firefly Fire Department supervising seven firefighters and making decisions for the city of Firefly. He was also President of the Firefly Firefighters Union for ten years. During this time he made executive decisions in his management capacity and participated in negotiations. John is the owner/manager of Airport Mini Storage. When he bought the units they were losing money at only 60% occupancy. Under his management they are consistently 90% occupied and remain profitable.
Michelle is a dental hygienist who has one assistant working for her. She also frequently manages student interns. As a dental hygienist she is skilled in the management and motivation of each patient on a personal level. The ability to evaluate and judge acceptance and compliance in individuals is a skill that she employs daily.
For additional information see Resumes below. [Confidential and Proprietary information omitted from this sample plan.]
6.1 Personnel Plan
Staffing
Optimum customer service is important, even critical, for the success of Sammy’s. But the owners also realize the high (and expanding) cost of employees. Fortunately, in the miniature golf industry, a high number of customers can be served efficiently by relatively few employees.
Sammy’s will require one staff member for off peak hours. Additional staff will be scheduled in accordance with demand determined by daily attendance patterns, eg: more staff will be required during summer months and during weekend and evening hours.
Manager
Sammy’s will have a salaried manager on staff during the months the facility is open.
Assistant Manager
The assistant manager will be an hourly employee working for $9.35 per hour.
Part-time Staff
Part-time staff will be used as needed for optimal customer service.
| Personnel Plan | |||
| Year 1 | Year 2 | Year 3 | |
| Manager | $25,000 | $25,625 | $26,266 |
| Asst. Manager | $15,000 | $15,375 | $15,759 |
| Part time staff (1.5 FTE) | $15,450 | $15,836 | $16,232 |
| Owners (1 FTE) | $0 | $0 | $0 |
| Total People | 5 | 5 | 5 |
| Total Payroll | $55,450 | $56,836 | $58,257 |
Financial Plan
The rapidly growing family entertainment industry is enjoying great success across the nation. These “too good to be true” numbers are, in fact, realistic. Every effort has been made to use conservative numbers in all categories. This point bears repeating; conservative, well researched numbers have been used in all categories.
The lack of inventory and current liabilities will give some readers problems with the “usual” Business Ratios.
7.1 Important Assumptions
History has proven there are two types of businesses that thrive in depressed economic times. These two categories of businesses are alcohol and family entertainment. As far back as the depression of the early 30s, the family entertainment industry has performed well in prosperous times and in economic downturns.
Sammy’s does not assume they have no competition. But it is worthy to note there is a distinct lack of family entertainment in the area. While one might initially think this means such a business will not flourish here, our research has indicated otherwise. For example:
- The expanding network of new concept miniature golf courses is finding success in rural America. Locations near rural arterials are performing well across the nation.
- Locations in cities are doing well also. In our own region we see successful examples in St. Andrews and Mashie Woods.
Note the interest is high for current lending. This is in keeping with the conservative nature of this plan. It further demonstrates the basic health of this conceptual business.
| General Assumptions | |||
| Year 1 | Year 2 | Year 3 | |
| Plan Month | 1 | 2 | 3 |
| Current Interest Rate | 10.00% | 8.00% | 10.00% |
| Long-term Interest Rate | 8.00% | 8.00% | 8.00% |
| Tax Rate | 35.50% | 35.50% | 35.50% |
| Other | 0 | 0 | 0 |
7.2 Break-even Analysis
We see an extremely low variable cost in the Break-even table. While some would consider this an error, we know it to be the beauty of the business. The variable costs are limited to a scorecard (1 cent), a stubby pencil that is used several times, and the replacement of balls (which are used hundreds of times).
The largest variable that determines the level of success in a miniature golf operation is the percent utilization of the golf course during the season. As the marketing plan points out, there are clearly defined peaks and valleys of activity during a typical week. Evenings and weekends tend to produce very high utilization, even full utilization for much of this time. On the other hand, weekday hours (between 10 am and 4 pm) tend to have lower utilization. On average over the full season, most facilities (with a direct population base of 40,000 to 60,000) experience a utilization of approximately 35%. Sammy’s is fortunate to have a population base of over 150,000 within a 15 mile radius (based on the 2000 US Census). In spite of that, we have used rather conservative estimates of utilization (about 20%) in deriving our projected revenues. But it is worthy to note that if our course utilization were only 10% (half of the 20% projection), we would still break even. This huge margin of error should satisfy even the most skeptical reader.
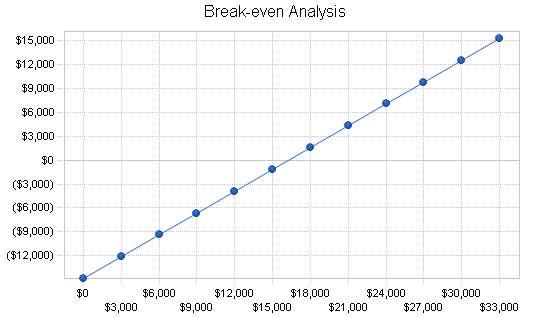
| Break-even Analysis | |
| Monthly Revenue Break-even | $16,279 |
| Assumptions: | |
| Average Percent Variable Cost | 9% |
| Estimated Monthly Fixed Cost | $14,842 |
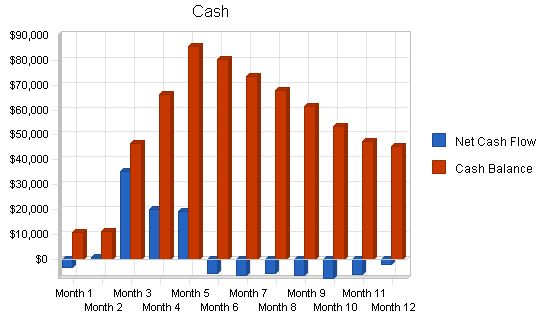
7.3 Projected Cash Flow
With a first reading, the projected cash flow numbers appear unrealistic. Allow us to reinforce information given in the notes to the sales forecast.
- The numbers have been verified by Mulligan-Bogey Leisure Builders. Mulligan-Bogey has built over 400 successful courses in the last ten years and they are well aware of the revenues of their courses.
- The revenue numbers were presented to two separate owners who have opened courses within the last three years. The owners felt the revenue estimates were conservative, but accurate for planning purposes.
- Even if, for some catastrophic reason, the actual revenues were substantially lower, the reader can see this business will still be profitable, with positive cash balance from the first month.
Although the Cash Spending row in our projections contains only payroll expenses, we may choose to pay some bills (from the Bill Payments row) in fewer than 30 days, once the business is up and running; these would then also be part of cash spending. Our current projections, however, were designed conservatively.
The cost of the golf course includes everything except the scorecards. So no balls or clubs are included in the startup costs.
Along with a $20,000 option, Sammy’s will offer $1 lease for the first year. Although this initially sounds unacceptable, it is worth noting the owner will receive $20,000 for the option, and the property has been vacant and for sale for two years, without an offer.
Underwriters are working on an insurance quote. We have used the best estimate of insurance professionals.
The arcade will operate on a 50-50 split with an arcade company. We have shown the revenue as a sale and the arcade companies share as an expense.
| Pro Forma Cash Flow | |||
| Year 1 | Year 2 | Year 3 | |
| Cash Received | |||
| Cash from Operations | |||
| Cash Sales | $251,018 | $254,433 | $257,917 |
| Subtotal Cash from Operations | $251,018 | $254,433 | $257,917 |
| Additional Cash Received | |||
| Sales Tax, VAT, HST/GST Received | $0 | $0 | $0 |
| New Current Borrowing | $0 | $0 | $0 |
| New Other Liabilities (interest-free) | $0 | $0 | $0 |
| New Long-term Liabilities | $0 | $0 | $0 |
| Sales of Other Current Assets | $0 | $0 | $0 |
| Sales of Long-term Assets | $0 | $0 | $0 |
| New Investment Received | $0 | $0 | $0 |
| Subtotal Cash Received | $251,018 | $254,433 | $257,917 |
| Expenditures | Year 1 | Year 2 | Year 3 |
| Expenditures from Operations | |||
| Cash Spending | $55,450 | $56,836 | $58,257 |
| Bill Payments | $152,088 | $148,781 | $156,341 |
| Subtotal Spent on Operations | $207,538 | $205,617 | $214,599 |
| Additional Cash Spent | |||
| Sales Tax, VAT, HST/GST Paid Out | $0 | $0 | $0 |
| Principal Repayment of Current Borrowing | $0 | $0 | $0 |
| Other Liabilities Principal Repayment | $0 | $0 | $0 |
| Long-term Liabilities Principal Repayment | $11,837 | $12,819 | $13,883 |
| Purchase Other Current Assets | $0 | $0 | $0 |
| Purchase Long-term Assets | $0 | $0 | $0 |
| Dividends | $0 | $0 | $0 |
| Subtotal Cash Spent | $219,375 | $218,436 | $228,482 |
| Net Cash Flow | $31,643 | $35,997 | $29,435 |
| Cash Balance | $45,412 | $81,409 | $110,844 |
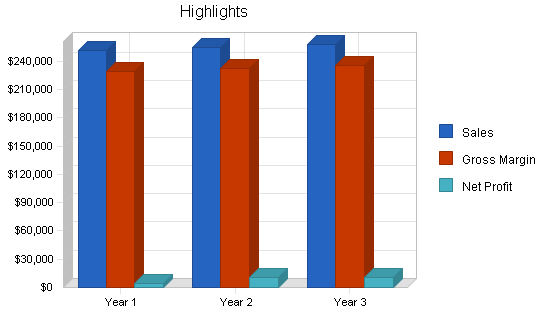
7.4 Projected Profit and Loss
Estimates for financial projections are prepared with a conservative look at all aspects of the business. We have relied on three external sources for input and validation. We are in contact with two helpful course owners in similar demographic areas. One business has been operating for one year and the other for four years. Their input has been invaluable in comparing theoretical projections with reality. Another excellent source of data is Mulligan-Bogey Leisure Builders; they have built over 400 successful courses and are able to tell a prospective owner what to realistically expect.
It is important to note, based on their past experience, all three sources of information have agreed that our sales projections are either accurate or too low. They also agree the expense projections are either accurate, or too high. Thus we see a conservative forecast, giving both owner and investor a safety buffer.
Accounting and legal costs are projected at $1,250 at the outset for our Sub S Corporation, then another $500 for set-up by the accounting firm. The company will have its books reviewed each quarter; fees for accounting are listed below.


| Pro Forma Profit and Loss | |||
| Year 1 | Year 2 | Year 3 | |
| Sales | $251,018 | $254,433 | $257,917 |
| Direct Cost of Sales | $22,155 | $22,325 | $22,498 |
| Other Costs of Sales | $0 | $0 | $0 |
| Total Cost of Sales | $22,155 | $22,325 | $22,498 |
| Gross Margin | $228,863 | $232,108 | $235,419 |
| Gross Margin % | 91.17% | 91.23% | 91.28% |
| Expenses | |||
| Payroll | $55,450 | $56,836 | $58,257 |
| Sales and Marketing and Other Expenses | $9,250 | $6,150 | $6,335 |
| Depreciation | $32,640 | $32,640 | $32,640 |
| Land Lease | $33,000 | $33,000 | $33,000 |
| Utilities | $15,550 | $16,328 | $17,144 |
| Insurance | $10,000 | $10,500 | $11,025 |
| Payroll Taxes | $6,654 | $6,854 | $7,059 |
| Acctg & Legal | $2,750 | $2,833 | $2,917 |
| Operating Supplies | $2,510 | $2,585 | $2,663 |
| Telephone | $1,800 | $1,854 | $1,910 |
| Continuing Education | $8,500 | $3,500 | $3,850 |
| Total Operating Expenses | $178,104 | $173,079 | $176,800 |
| Profit Before Interest and Taxes | $50,759 | $59,029 | $58,619 |
| EBITDA | $83,399 | $91,669 | $91,259 |
| Interest Expense | $44,293 | $43,340 | $42,272 |
| Taxes Incurred | $2,295 | $5,569 | $5,803 |
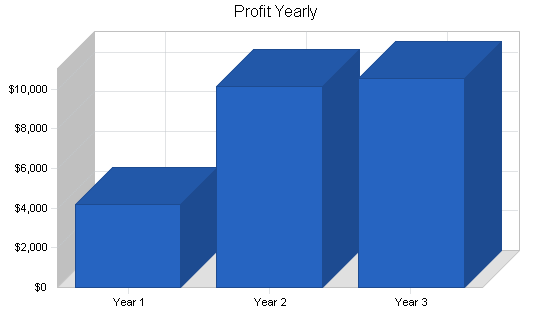
| Net Profit | $4,170 | $10,119 | $10,543 |
| Net Profit/Sales | 1.66% | 3.98% | 4.09% |
7.5 Projected Balance Sheet
The asset side of the balance sheet shows an accurate picture.
The Balance Sheet shows the current liabilities at a zero balance. This is because all purchases and payroll are paid on a cash basis. >/P>
The beauty of this business is beginning to become apparent. There is a reasonably high capital output, but the operation of the business is completed with virtually no inventory to purchase and low labor cost. When the reader combines this information with the fact that the sales forecast is conservative, one can see that success is assured.
| Pro Forma Balance Sheet | |||
| Year 1 | Year 2 | Year 3 | |
| Assets | |||
| Current Assets | |||
| Cash | $45,412 | $81,409 | $110,844 |
| Other Current Assets | $23,230 | $23,230 | $23,230 |
| Total Current Assets | $68,642 | $104,639 | $134,074 |
| Long-term Assets | |||
| Long-term Assets | $649,500 | $649,500 | $649,500 |
| Accumulated Depreciation | $32,640 | $65,280 | $97,920 |
| Total Long-term Assets | $616,860 | $584,220 | $551,580 |
| Total Assets | $685,502 | $688,859 | $685,654 |
| Liabilities and Capital | Year 1 | Year 2 | Year 3 |
| Current Liabilities | |||
| Accounts Payable | $6,669 | $12,726 | $12,861 |
| Current Borrowing | $0 | $0 | $0 |
| Other Current Liabilities | $0 | $0 | $0 |
| Subtotal Current Liabilities | $6,669 | $12,726 | $12,861 |
| Long-term Liabilities | $548,163 | $535,344 | $521,461 |
| Total Liabilities | $554,833 | $548,071 | $534,323 |
| Paid-in Capital | $140,000 | $140,000 | $140,000 |
| Retained Earnings | ($13,501) | ($9,331) | $788 |
| Earnings | $4,170 | $10,119 | $10,543 |
| Total Capital | $130,669 | $140,788 | $151,332 |
| Total Liabilities and Capital | $685,502 | $688,859 | $685,654 |
| Net Worth | $130,669 | $140,788 | $151,332 |
7.6 Business Ratios
As noted earlier, this family entertainment business has no inventory and does not do sales on credit. Therefore several ratios normally deemed important by the reader will not show reasonable numbers. The high value for Profit Before Interest and Taxes is not an error.
The following table outlines some of the more important ratios from the Amusement and Recreation industry. The final column, Industry Profile, details specific ratios based on the industry as it is classified by the NAICS code 713990.
| Ratio Analysis | ||||
| Year 1 | Year 2 | Year 3 | Industry Profile | |
| Sales Growth | 0.00% | 1.36% | 1.37% | 4.59% |
| Percent of Total Assets | ||||
| Other Current Assets | 3.39% | 3.37% | 3.39% | 41.52% |
| Total Current Assets | 10.01% | 15.19% | 19.55% | 51.30% |
| Long-term Assets | 89.99% | 84.81% | 80.45% | 48.70% |
| Total Assets | 100.00% | 100.00% | 100.00% | 100.00% |
| Current Liabilities | 0.97% | 1.85% | 1.88% | 27.43% |
| Long-term Liabilities | 79.97% | 77.71% | 76.05% | 27.45% |
| Total Liabilities | 80.94% | 79.56% | 77.93% | 54.88% |
| Net Worth | 19.06% | 20.44% | 22.07% | 45.12% |
| Percent of Sales | ||||
| Sales | 100.00% | 100.00% | 100.00% | 100.00% |
| Gross Margin | 91.17% | 91.23% | 91.28% | 100.00% |
| Selling, General & Administrative Expenses | 1.11% | 0.73% | 0.74% | 63.25% |
| Advertising Expenses | 2.58% | 1.69% | 1.72% | 4.30% |
| Profit Before Interest and Taxes | 20.22% | 23.20% | 22.73% | 4.21% |
| Main Ratios | ||||
| Current | 10.29 | 8.22 | 10.42 | 1.04 |
| Quick | 10.29 | 8.22 | 10.42 | 0.60 |
| Total Debt to Total Assets | 80.94% | 79.56% | 77.93% | 58.43% |
| Pre-tax Return on Net Worth | 4.95% | 11.14% | 10.80% | 6.31% |
| Pre-tax Return on Assets | 0.94% | 2.28% | 2.38% | 15.19% |
| Additional Ratios | Year 1 | Year 2 | Year 3 | |
| Net Profit Margin | 1.66% | 3.98% | 4.09% | n.a |
| Return on Equity | 3.19% | 7.19% | 6.97% | n.a |
| Activity Ratios | ||||
| Accounts Payable Turnover | 23.80 | 12.17 | 12.17 | n.a |
| Payment Days | 27 | 23 | 30 | n.a |
| Total Asset Turnover | 0.37 | 0.37 | 0.38 | n.a |
| Debt Ratios | ||||
| Debt to Net Worth | 4.25 | 3.89 | 3.53 | n.a |
| Current Liab. to Liab. | 0.01 | 0.02 | 0.02 | n.a |
| Liquidity Ratios | ||||
| Net Working Capital | $61,973 | $91,913 | $121,213 | n.a |
| Interest Coverage | 1.15 | 1.36 | 1.39 | n.a |
| Additional Ratios | ||||
| Assets to Sales | 2.73 | 2.71 | 2.66 | n.a |
| Current Debt/Total Assets | 1% | 2% | 2% | n.a |
| Acid Test | 10.29 | 8.22 | 10.42 | n.a |
| Sales/Net Worth | 1.92 | 1.81 | 1.70 | n.a |
| Dividend Payout | 0.00 | 0.00 | 0.00 | n.a |
Builder's Estimate
Date: May 28, 2004
Mulligan-Bogey Leisure Builders Inc., cannot guarantee income. However, with locations similar to yours, we can project the following:
| Peak Season – June 1 through September 1 | |
| Daytime Hours (10am-6pm): | |
|
25 players/hour x 8 hours = 200 players |
|
|
200 players/day @ $5/game = $1000/day |
|
|
$1000/day x 90 days = $90,000 |
|
|
Projected receipts/Daytime/Peak Season |
$90,000 |
| Evening Hours (6pm-11pm) | |
|
50 player/hour x 5 hours = 250 players |
|
|
250 player/evening @ $5/game = $1250/evening |
|
|
$1250/evening x 90 evenings = $112,500 |
|
|
Projected receipts/Evening/Peak Season |
$112,500 |
| Off Season – May 1 – June 1 & Sept. 1 – Oct. 1 | |
|
Daytime Hours (10am-6pm) |
|
|
12 players/hour x 8 hours = 96 players |
|
|
96 players/day @ $5/game = $480 |
|
|
$480/day x 60 days = $28,800 |
|
|
Projected receipts/Daytime/Off Season |
$28,800 |
| Evening Hours (6pm-11pm) | |
|
25 players/hour x 5 hours = 125 players |
|
|
125 players/evening @ $5/game – $625/evening |
|
|
$625/evening x 60 evenings = $37,500 |
|
|
Projected receipts/Evening/Off Season |
$37,500 |
| Total Gross Receipts/Season/Golf Course |
$268,800 |
| Less estimated rain days 10% |
$26,880 |
| Total Income |
$241,920 |
We hope these figures will be helpful to you. We consider 100 players per hour to be 100% capacity; however, we have had customers tell us that 125 players per hour is not unrealistic. Also, consider that many golf courses are able to open for business before May 1 and remain open after October 1, which could further inflate these numbers.
If you have any questions or need further assistance, please feel free to call anytime.
Sincerely,
Mulligan-Bogey Leisure Builders


