
Martin Cove Brewing Company
Executive Summary
Martin Cove Brewing Company has been a successful microbrewery in southern Oregon for the past three years. Located in the city of Medford, the company has increased sales by 15% each year. The company’s product lines are Martin Cove Pilsner and Red Ale. This year, Martin Cove Brewing Company, will gross $520,000 in sales. This was generated from an initial investment of $150,000.
Martin Cove Brewing Company handcrafts its beers in small 20 barrel batches under the close personal attention of our brewers. The latest brewing equipment and technologies are seamlessly combined with traditional brewing methods to ensure consistently excellent taste, whether packaged in bottles or draft kegs.
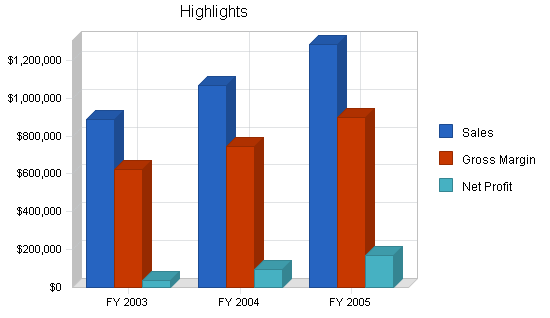
Martin Cove Brewing Company is planning to expand its distribution to selected metro areas within the state of Oregon. Over the last three years, Martin Cove Brewing Company has become one of the city’s most popular microbreweries, and aims to repeat this Oregon-wide. In addition, the company will introduce a new product, a traditional German Marzen style lager. Owner funding and internally generated cash flow will enable the expansion plan. Sales projections for the next three years are based on current sales success with the target customer base in southern Oregon. The effective implementation of this plan will result in sales revenues growing to $1.2 million by Year 3.
Martin Cove Brewing Company will apply the same sales strategy that built sales in Medford: remove all obstacles between you and the customer. Once the customer tastes the product, he or she will know the quality and craftsmanship that goes into every bottle of Martin Cove.
Martin Cove Microbrews will be available in bars as well as retail outlets, such as local markets and corner stores. It will also aim to distribute through supermarkets, but it is envisioned that getting shelf space in national supermarkets will be more difficult and more expensive.
1.1 Objectives
The objectives of Martin Cove Brewing Company are the following:
- Establish strong relationships with local beer distributors in selected sales areas.
- Maintain tight control of cost and operation during expansion.
- Maintain the high-quality product that the company has become known for.
Company Summary
Martin Cove Brewing Company has built a reputation for handcrafted care, time-honored methodology, and the finest natural ingredients from around the world.
Martin Cove Brewing Company has been a successful microbrewery in southern Oregon for the past three years. Located in the city of Medford, the company has increased sales by 15% each year. The company’s product lines are Martin Cove Pilsner and Red Ale.
Martin Cove Brewing Company handcrafts its beers in small 20 barrel batches under the close personal attention of our brewers. The latest brewing equipment and technologies are seamlessly combined with traditional brewing methods to ensure consistently excellent taste, whether packaged in bottles or draft kegs.
Martin Cove Brewing Company is planning to expand its distribution to selected metro areas within the state of Oregon. Over the last three years, Martin Cove Brewing Company has become one of the city’s most popular microbreweries, and aims to repeat this Oregon-wide. In addition, the company will introduce a new product, a traditional German Marzen style lager. Owner funding and internally generated cash flow will enable the expansion plan.
2.1 Company History
Martin Cove Brewing Company was started in the city of Medford in 1996. John Wilson was bartending at two local establishments in Medford for ten years before starting Martin Cove Brewing Company. Brewmasters Bob Taft and Jeffery Calson had worked for Portland Brewery Company for six and eight years, respectively, before starting Martin Cove Brewing Company. Felix Henderson had twelve years of experience in retail sales and marketing when he joined as co-owner/marketing director for Martin Cove Brewing Company.
Martin Cove Brewing Company handcrafts its beer in small 20 barrel batches under the close personal attention of our brewers. The latest brewing equipment and technologies are seamlessly combined with traditional brewing methods to ensure consistently excellent taste, whether packaged in bottles or draft kegs.
The beers proved to be so popular that Martin Cove Brewing Company soon could be found in almost every market and pub in Medford. Over the next three years, Martin Cove Brewing Company has become one of the city’s most popular microbreweries.
Martin Cove Brewing Company’s operations has expanded dramatically over the past three years. Currently, the company has a staff of eleven in production, delivery, and sales.

| Past Performance | |||
| FY 2000 | FY 2001 | FY 2002 | |
| Sales | $350,000 | $420,000 | $520,000 |
| Gross Margin | $245,000 | $294,000 | $364,000 |
| Gross Margin % | 70.00% | 70.00% | 70.00% |
| Operating Expenses | $200,000 | $260,000 | $320,000 |
| Collection Period (days) | 0 | 49 | 57 |
| Inventory Turnover | 52.00 | 52.00 | 52.00 |
| Balance Sheet | |||
| FY 2000 | FY 2001 | FY 2002 | |
| Current Assets | |||
| Cash | $10,000 | $30,000 | $80,000 |
| Accounts Receivable | $49,000 | $58,000 | $80,000 |
| Inventory | $10,000 | $10,000 | $20,000 |
| Other Current Assets | $5,000 | $5,000 | $5,000 |
| Total Current Assets | $74,000 | $103,000 | $185,000 |
| Long-term Assets | |||
| Long-term Assets | $100,000 | $100,000 | $100,000 |
| Accumulated Depreciation | $4,000 | $8,000 | $12,000 |
| Total Long-term Assets | $96,000 | $92,000 | $88,000 |
| Total Assets | $170,000 | $195,000 | $273,000 |
| Current Liabilities | |||
| Accounts Payable | $30,000 | $20,000 | $20,000 |
| Current Borrowing | $0 | $0 | $0 |
| Other Current Liabilities (interest free) | $0 | $0 | $0 |
| Total Current Liabilities | $30,000 | $20,000 | $20,000 |
| Long-term Liabilities | $60,000 | $40,000 | $40,000 |
| Total Liabilities | $90,000 | $60,000 | $60,000 |
| Paid-in Capital | $30,000 | $40,000 | $80,000 |
| Retained Earnings | $38,000 | $80,000 | $109,000 |
| Earnings | $12,000 | $15,000 | $24,000 |
| Total Capital | $80,000 | $135,000 | $213,000 |
| Total Capital and Liabilities | $170,000 | $195,000 | $273,000 |
| Other Inputs | |||
| Payment Days | 12 | 12 | 12 |
| Sales on Credit | $0 | $400,000 | $440,000 |
| Receivables Turnover | 0.00 | 6.90 | 5.50 |
2.2 Company Ownership
Martin Cove Brewing is owned by John Wilson, Bob Taft, Jeffery Calson, and Felix Henderson.
Products
Martin Cove Brewing Company has three beer product lines:
- Roaring River Red is an Irish style ale made the traditional way, with
roasted specialty malts that give it that deep, ruby-colored hue.
- Martin Cove Pilsner is light, crisp and crystal clear, with a pure white foamy head. It’s a blend of the very finest domestic and imported malts, hops and bottom-fermented lager yeast, delicately balanced.
- Martin Cove Lager is brewed in the traditional German Marzen style and is malty and full-bodied. We combine imported German hops and a special European yeast strain with the finest two row malted barley from the Pacific Northwest to give Martin Cove Lager its unique character and warm, light amber color.
Market Analysis Summary
Over the past ten years, regional microbreweries have gained market share of beer sales in the state of Oregon. A number of regional brands have moved from speciality market to the supermarket. The numbers have been impressive. At present, regional microbrews represent 10% of beer sales in Oregon. This represents a 35% increase over sales numbers for the year 2000. Most importantly, the increased sales have occurred in the affluent communities in Oregon’s metro areas.
Oregon’s population has grown by 15% annually for the past ten years. Most of the growth has been in response to the explosion of hiring in the high-tech industry. The growth has added to the customer base that purchases regional microbrews. Traditionally, microbrews have been favored by young professional men and women in their late twenties and early thirties.
Another growth area that has had an impact on microbrew sales is the dramatic enrollment increase in the state’s colleges and universities. Currently, there are 60,000 college students in the cities of Eugene, Corvallis and Portland. Microbrews represent 35% of beers sales in the campus communities.
4.1 Market Segmentation
Martin Cove Brewing Company plans to focus on the following market segments:
- Customers in university campus communities.
- Professional men and women aged 25 – 35 living in affluent metro communities.
Marketing and promotional activities will be grassroots based, rather than more expensive mass marketing. Martin Cove will reach these people through sponsorship of local entertainment of cultural events, advertising in small niche magazines targeted towards young “fashionable” professionals and sponsorship of activity groups.

| Market Analysis | |||||||
| 2002 | 2003 | 2004 | 2005 | 2006 | |||
| Potential Customers | Growth | CAGR | |||||
| University Communities | 15% | 100,000 | 115,000 | 132,250 | 152,088 | 174,901 | 15.00% |
| Affluent Metro Communities | 10% | 400,000 | 440,000 | 484,000 | 532,400 | 585,640 | 10.00% |
| Total | 11.06% | 500,000 | 555,000 | 616,250 | 684,488 | 760,541 | 11.06% |

Strategy and Implementation Summary
The first step in the expansion plan is to introduce the Martin Cove Brewing Company product line into the selected areas. New sales representatives will be assigned to the Portland tri-county area and the lower Willamette Valley area (Corvallis and Eugene). The retail marketing focus will be on speciality stores that carry regional microbrews. Martin Cove Brewing Company will promote sales by reducing wholesale prices 12% for the first three months of sales.
Martin Cove Brewing Company products will be distributed in the Portland tri-county area by Cascade Distribution. In the lower Willamette Valley area, McKenzie Distribution will carry Martin Cove Brewing Company products.
Martin Cove Brewing Company’s new product, a traditional German Marzen style lager, is unique enough in taste and processing to be attractive to any business that serves beers to customers. The added advantage is that the lager has no competitors. Martin Cove Brewing Company will promote sales by reducing wholesale prices 12% for the first three months of sales.
5.1 Sales Strategy
Martin Cove Brewing Company will apply the same sales strategy that built sales in Medford: remove all obstacles between you and the customer. Once the customer tastes the product, he or she will know the quality and craftsmanship that goes into every bottle of Martin Cove.
Martin Cove Microbrews will be available in bars as well as retail outlets, such as local markets and corner stores. It will also aim to distribute through supermarkets, but it is envisioned that getting shelf space in national supermarkets will be more difficult and more expensive.
5.1.1 Sales Forecast
The following is the sales forecast for the next three years.


| Sales Forecast | |||
| FY 2003 | FY 2004 | FY 2005 | |
| Sales | |||
| Microbrews | $890,000 | $1,068,000 | $1,281,600 |
| Other | $0 | $0 | $0 |
| Total Sales | $890,000 | $1,068,000 | $1,281,600 |
| Direct Cost of Sales | FY 2003 | FY 2004 | FY 2005 |
| Microbrews | $267,000 | $320,400 | $384,480 |
| Other | $0 | $0 | $0 |
| Subtotal Direct Cost of Sales | $267,000 | $320,400 | $384,480 |
5.2 Competitive Edge
Martin Cove Brewing Company’s competitive edge is as follows:
- Quality Process and Ingredients: Our beers are the highest quality and include only the finest natural ingredients. Carefully selected for their distinctive flavor profile, the beers are classically fermented and cold lagered for a smooth, bold taste. We use fine North American two row barley malt in addition to imported Belgian specialty malts, generally regarded as among the finest malts in the world. We use hops from the Pacific Northwest in our ales, and use imported German hops to give our Martin Cove Lagers their distinctive taste.
- Handcrafted: Our beers are stored in small 20 barrel batches under the close personal attention of our brewers. The latest brewing equipment and technologies are seamlessly combined with traditional brewing methods to ensure consistently excellent taste, whether packaged in bottles or draft kegs.
Management Summary
The following is the management summary for Martin Cove Brewing Company:
- John Wilson will manage the bottling and shipping operation.
- Brewmasters Bob Taft and Jeffery Calson will manage the brewing process.
- Felix Henderson will manage marketing and sales.
6.1 Personnel Plan
Martin Cove Brewing Company’s personnel plan is as follows:
- Bottling and shipping manager;
- Brewing managers (2);
- Marketing/sales manager;
- Bottling staff (4);
- Shipping staff (3).
| Personnel Plan | |||
| FY 2003 | FY 2004 | FY 2005 | |
| Bottling and Shipping Mgr | $48,000 | $50,000 | $52,000 |
| Brewing Mgrs (2) | $96,000 | $100,000 | $104,000 |
| Marketing and Sales Mgr | $48,000 | $50,000 | $52,000 |
| Bottling Staff | $108,000 | $112,000 | $116,000 |
| Shipping Staff | $72,000 | $75,000 | $78,000 |
| Total People | 11 | 11 | 11 |
| Total Payroll | $372,000 | $387,000 | $402,000 |
Financial Plan
The following is the financial plan for Martin Cove Brewing Company.
7.1 Break-even Analysis
The monthly break-even point is $67,036.

| Break-even Analysis | |
| Monthly Revenue Break-even | $67,036 |
| Assumptions: | |
| Average Percent Variable Cost | 30% |
| Estimated Monthly Fixed Cost | $46,925 |
7.2 Projected Profit and Loss
The following table and charts highlight the projected profit and loss for the next three years.


| Pro Forma Profit and Loss | |||
| FY 2003 | FY 2004 | FY 2005 | |
| Sales | $890,000 | $1,068,000 | $1,281,600 |
| Direct Cost of Sales | $267,000 | $320,400 | $384,480 |
| Other Production Expenses | $0 | $0 | $0 |
| Total Cost of Sales | $267,000 | $320,400 | $384,480 |
| Gross Margin | $623,000 | $747,600 | $897,120 |
| Gross Margin % | 70.00% | 70.00% | 70.00% |
| Expenses | |||
| Payroll | $372,000 | $387,000 | $402,000 |
| Sales and Marketing and Other Expenses | $63,000 | $83,000 | $105,000 |
| Depreciation | $14,400 | $14,400 | $14,400 |
| Sales Commission | $26,700 | $32,040 | $38,448 |
| Utilities | $12,000 | $12,000 | $12,000 |
| Insurance | $2,400 | $2,600 | $2,800 |
| Rent | $16,800 | $16,800 | $16,800 |
| Payroll Taxes | $55,800 | $58,050 | $60,300 |
| Other | $0 | $0 | $0 |
| Total Operating Expenses | $563,100 | $605,890 | $651,748 |
| Profit Before Interest and Taxes | $59,900 | $141,710 | $245,372 |
| EBITDA | $74,300 | $156,110 | $259,772 |
| Interest Expense | $3,782 | $3,398 | $2,998 |
| Taxes Incurred | $16,835 | $41,494 | $72,712 |
| Net Profit | $39,282 | $96,818 | $169,662 |
| Net Profit/Sales | 4.41% | 9.07% | 13.24% |
7.3 Projected Cash Flow
The following table and chart highlight the projected cash flow for the next three years.

| Pro Forma Cash Flow | |||
| FY 2003 | FY 2004 | FY 2005 | |
| Cash Received | |||
| Cash from Operations | |||
| Cash Sales | $222,500 | $267,000 | $320,400 |
| Cash from Receivables | $622,500 | $776,000 | $931,200 |
| Subtotal Cash from Operations | $845,000 | $1,043,000 | $1,251,600 |
| Additional Cash Received | |||
| Sales Tax, VAT, HST/GST Received | $0 | $0 | $0 |
| New Current Borrowing | $0 | $0 | $0 |
| New Other Liabilities (interest-free) | $0 | $0 | $0 |
| New Long-term Liabilities | $0 | $0 | $0 |
| Sales of Other Current Assets | $0 | $0 | $0 |
| Sales of Long-term Assets | $0 | $0 | $0 |
| New Investment Received | $0 | $0 | $0 |
| Subtotal Cash Received | $845,000 | $1,043,000 | $1,251,600 |
| Expenditures | FY 2003 | FY 2004 | FY 2005 |
| Expenditures from Operations | |||
| Cash Spending | $372,000 | $387,000 | $402,000 |
| Bill Payments | $461,903 | $552,706 | $690,670 |
| Subtotal Spent on Operations | $833,903 | $939,706 | $1,092,670 |
| Additional Cash Spent | |||
| Sales Tax, VAT, HST/GST Paid Out | $0 | $0 | $0 |
| Principal Repayment of Current Borrowing | $0 | $0 | $0 |
| Other Liabilities Principal Repayment | $0 | $0 | $0 |
| Long-term Liabilities Principal Repayment | $4,020 | $4,000 | $4,000 |
| Purchase Other Current Assets | $0 | $0 | $0 |
| Purchase Long-term Assets | $0 | $0 | $0 |
| Dividends | $0 | $0 | $0 |
| Subtotal Cash Spent | $837,923 | $943,706 | $1,096,670 |
| Net Cash Flow | $7,077 | $99,294 | $154,930 |
| Cash Balance | $87,077 | $186,372 | $341,302 |
7.4 Projected Balance Sheet
The following table highlights the projected balance sheet for the next three years.
| Pro Forma Balance Sheet | |||
| FY 2003 | FY 2004 | FY 2005 | |
| Assets | |||
| Current Assets | |||
| Cash | $87,077 | $186,372 | $341,302 |
| Accounts Receivable | $125,000 | $150,000 | $180,000 |
| Inventory | $23,100 | $27,720 | $33,264 |
| Other Current Assets | $5,000 | $5,000 | $5,000 |
| Total Current Assets | $240,177 | $369,092 | $559,566 |
| Long-term Assets | |||
| Long-term Assets | $100,000 | $100,000 | $100,000 |
| Accumulated Depreciation | $26,400 | $40,800 | $55,200 |
| Total Long-term Assets | $73,600 | $59,200 | $44,800 |
| Total Assets | $313,777 | $428,292 | $604,366 |
| Liabilities and Capital | FY 2003 | FY 2004 | FY 2005 |
| Current Liabilities | |||
| Accounts Payable | $25,515 | $47,211 | $57,623 |
| Current Borrowing | $0 | $0 | $0 |
| Other Current Liabilities | $0 | $0 | $0 |
| Subtotal Current Liabilities | $25,515 | $47,211 | $57,623 |
| Long-term Liabilities | $35,980 | $31,980 | $27,980 |
| Total Liabilities | $61,495 | $79,191 | $85,603 |
| Paid-in Capital | $80,000 | $80,000 | $80,000 |
| Retained Earnings | $133,000 | $172,282 | $269,101 |
| Earnings | $39,282 | $96,818 | $169,662 |
| Total Capital | $252,282 | $349,101 | $518,763 |
| Total Liabilities and Capital | $313,777 | $428,292 | $604,366 |
| Net Worth | $252,282 | $349,101 | $518,763 |
7.5 Business Ratios
Industry profile ratios based on the Standard Industrial Classification(SIC) code 5181, Beer and Ale, are shown for comparison.
| Ratio Analysis | ||||
| FY 2003 | FY 2004 | FY 2005 | Industry Profile | |
| Sales Growth | 71.15% | 20.00% | 20.00% | 6.20% |
| Percent of Total Assets | ||||
| Accounts Receivable | 39.84% | 35.02% | 29.78% | 19.00% |
| Inventory | 7.36% | 6.47% | 5.50% | 28.70% |
| Other Current Assets | 1.59% | 1.17% | 0.83% | 31.50% |
| Total Current Assets | 76.54% | 86.18% | 92.59% | 79.20% |
| Long-term Assets | 23.46% | 13.82% | 7.41% | 20.80% |
| Total Assets | 100.00% | 100.00% | 100.00% | 100.00% |
| Current Liabilities | 8.13% | 11.02% | 9.53% | 32.00% |
| Long-term Liabilities | 11.47% | 7.47% | 4.63% | 18.40% |
| Total Liabilities | 19.60% | 18.49% | 14.16% | 50.40% |
| Net Worth | 80.40% | 81.51% | 85.84% | 49.60% |
| Percent of Sales | ||||
| Sales | 100.00% | 100.00% | 100.00% | 100.00% |
| Gross Margin | 70.00% | 70.00% | 70.00% | 24.60% |
| Selling, General & Administrative Expenses | 65.60% | 60.97% | 56.82% | 15.60% |
| Advertising Expenses | 6.74% | 7.49% | 7.80% | 0.60% |
| Profit Before Interest and Taxes | 6.73% | 13.27% | 19.15% | 2.80% |
| Main Ratios | ||||
| Current | 9.41 | 7.82 | 9.71 | 2.24 |
| Quick | 8.51 | 7.23 | 9.13 | 1.07 |
| Total Debt to Total Assets | 19.60% | 18.49% | 14.16% | 50.40% |
| Pre-tax Return on Net Worth | 22.24% | 39.62% | 46.72% | 9.10% |
| Pre-tax Return on Assets | 17.88% | 32.29% | 40.10% | 18.40% |
| Additional Ratios | FY 2003 | FY 2004 | FY 2005 | |
| Net Profit Margin | 4.41% | 9.07% | 13.24% | n.a |
| Return on Equity | 15.57% | 27.73% | 32.71% | n.a |
| Activity Ratios | ||||
| Accounts Receivable Turnover | 5.34 | 5.34 | 5.34 | n.a |
| Collection Days | 59 | 63 | 63 | n.a |
| Inventory Turnover | 10.91 | 12.61 | 12.61 | n.a |
| Accounts Payable Turnover | 18.32 | 12.17 | 12.17 | n.a |
| Payment Days | 28 | 23 | 27 | n.a |
| Total Asset Turnover | 2.84 | 2.49 | 2.12 | n.a |
| Debt Ratios | ||||
| Debt to Net Worth | 0.24 | 0.23 | 0.17 | n.a |
| Current Liab. to Liab. | 0.41 | 0.60 | 0.67 | n.a |
| Liquidity Ratios | ||||
| Net Working Capital | $214,662 | $321,881 | $501,943 | n.a |
| Interest Coverage | 15.84 | 41.70 | 81.85 | n.a |
| Additional Ratios | ||||
| Assets to Sales | 0.35 | 0.40 | 0.47 | n.a |
| Current Debt/Total Assets | 8% | 11% | 10% | n.a |
| Acid Test | 3.61 | 4.05 | 6.01 | n.a |
| Sales/Net Worth | 3.53 | 3.06 | 2.47 | n.a |
| Dividend Payout | 0.00 | 0.00 | 0.00 | n.a |
Appendix
| Sales Forecast | |||||||||||||
| Feb | Mar | Apr | May | Jun | Jul | Aug | Sep | Oct | Nov | Dec | Jan | ||
| Sales | |||||||||||||
| Microbrews | 0% | $55,000 | $55,000 | $60,000 | $65,000 | $75,000 | $85,000 | $85,000 | $80,000 | $80,000 | $80,000 | $100,000 | $70,000 |
| Other | 0% | $0 | $0 | $0 | $0 | $0 | $0 | $0 | $0 | $0 | $0 | $0 | $0 |
| Total Sales | $55,000 | $55,000 | $60,000 | $65,000 | $75,000 | $85,000 | $85,000 | $80,000 | $80,000 | $80,000 | $100,000 | $70,000 | |
| Direct Cost of Sales | Feb | Mar | Apr | May | Jun | Jul | Aug | Sep | Oct | Nov | Dec | Jan | |
| Microbrews | $16,500 | $16,500 | $18,000 | $19,500 | $22,500 | $25,500 | $25,500 | $24,000 | $24,000 | $24,000 | $30,000 | $21,000 | |
| Other | $0 | $0 | $0 | $0 | $0 | $0 | $0 | $0 | $0 | $0 | $0 | $0 | |
| Subtotal Direct Cost of Sales | $16,500 | $16,500 | $18,000 | $19,500 | $22,500 | $25,500 | $25,500 | $24,000 | $24,000 | $24,000 | $30,000 | $21,000 | |
| Personnel Plan | |||||||||||||
| Feb | Mar | Apr | May | Jun | Jul | Aug | Sep | Oct | Nov | Dec | Jan | ||
| Bottling and Shipping Mgr | 0% | $4,000 | $4,000 | $4,000 | $4,000 | $4,000 | $4,000 | $4,000 | $4,000 | $4,000 | $4,000 | $4,000 | $4,000 |
| Brewing Mgrs (2) | 0% | $8,000 | $8,000 | $8,000 | $8,000 | $8,000 | $8,000 | $8,000 | $8,000 | $8,000 | $8,000 | $8,000 | $8,000 |
| Marketing and Sales Mgr | 0% | $4,000 | $4,000 | $4,000 | $4,000 | $4,000 | $4,000 | $4,000 | $4,000 | $4,000 | $4,000 | $4,000 | $4,000 |
| Bottling Staff | 0% | $9,000 | $9,000 | $9,000 | $9,000 | $9,000 | $9,000 | $9,000 | $9,000 | $9,000 | $9,000 | $9,000 | $9,000 |
| Shipping Staff | 0% | $6,000 | $6,000 | $6,000 | $6,000 | $6,000 | $6,000 | $6,000 | $6,000 | $6,000 | $6,000 | $6,000 | $6,000 |
| Total People | 11 | 11 | 11 | 11 | 11 | 11 | 11 | 11 | 11 | 11 | 11 | 11 | |
| Total Payroll | $31,000 | $31,000 | $31,000 | $31,000 | $31,000 | $31,000 | $31,000 | $31,000 | $31,000 | $31,000 | $31,000 | $31,000 | |
| General Assumptions | |||||||||||||
| Feb | Mar | Apr | May | Jun | Jul | Aug | Sep | Oct | Nov | Dec | Jan | ||
| Plan Month | 1 | 2 | 3 | 4 | 5 | 6 | 7 | 8 | 9 | 10 | 11 | 12 | |
| Current Interest Rate | 10.00% | 10.00% | 10.00% | 10.00% | 10.00% | 10.00% | 10.00% | 10.00% | 10.00% | 10.00% | 10.00% | 10.00% | |
| Long-term Interest Rate | 10.00% | 10.00% | 10.00% | 10.00% | 10.00% | 10.00% | 10.00% | 10.00% | 10.00% | 10.00% | 10.00% | 10.00% | |
| Tax Rate | 30.00% | 30.00% | 30.00% | 30.00% | 30.00% | 30.00% | 30.00% | 30.00% | 30.00% | 30.00% | 30.00% | 30.00% | |
| Other | 0 | 0 | 0 | 0 | 0 | 0 | 0 | 0 | 0 | 0 | 0 | 0 | |
| Pro Forma Profit and Loss | |||||||||||||
| Feb | Mar | Apr | May | Jun | Jul | Aug | Sep | Oct | Nov | Dec | Jan | ||
| Sales | $55,000 | $55,000 | $60,000 | $65,000 | $75,000 | $85,000 | $85,000 | $80,000 | $80,000 | $80,000 | $100,000 | $70,000 | |
| Direct Cost of Sales | $16,500 | $16,500 | $18,000 | $19,500 | $22,500 | $25,500 | $25,500 | $24,000 | $24,000 | $24,000 | $30,000 | $21,000 | |
| Other Production Expenses | $0 | $0 | $0 | $0 | $0 | $0 | $0 | $0 | $0 | $0 | $0 | $0 | |
| Total Cost of Sales | $16,500 | $16,500 | $18,000 | $19,500 | $22,500 | $25,500 | $25,500 | $24,000 | $24,000 | $24,000 | $30,000 | $21,000 | |
| Gross Margin | $38,500 | $38,500 | $42,000 | $45,500 | $52,500 | $59,500 | $59,500 | $56,000 | $56,000 | $56,000 | $70,000 | $49,000 | |
| Gross Margin % | 70.00% | 70.00% | 70.00% | 70.00% | 70.00% | 70.00% | 70.00% | 70.00% | 70.00% | 70.00% | 70.00% | 70.00% | |
| Expenses | |||||||||||||
| Payroll | $31,000 | $31,000 | $31,000 | $31,000 | $31,000 | $31,000 | $31,000 | $31,000 | $31,000 | $31,000 | $31,000 | $31,000 | |
| Sales and Marketing and Other Expenses | $5,000 | $6,000 | $6,000 | $5,000 | $5,000 | $5,000 | $5,000 | $5,000 | $6,000 | $5,000 | $5,000 | $5,000 | |
| Depreciation | $1,200 | $1,200 | $1,200 | $1,200 | $1,200 | $1,200 | $1,200 | $1,200 | $1,200 | $1,200 | $1,200 | $1,200 | |
| Sales Commission | $1,650 | $1,650 | $1,800 | $1,950 | $2,250 | $2,550 | $2,550 | $2,400 | $2,400 | $2,400 | $3,000 | $2,100 | |
| Utilities | $1,000 | $1,000 | $1,000 | $1,000 | $1,000 | $1,000 | $1,000 | $1,000 | $1,000 | $1,000 | $1,000 | $1,000 | |
| Insurance | $200 | $200 | $200 | $200 | $200 | $200 | $200 | $200 | $200 | $200 | $200 | $200 | |
| Rent | $1,400 | $1,400 | $1,400 | $1,400 | $1,400 | $1,400 | $1,400 | $1,400 | $1,400 | $1,400 | $1,400 | $1,400 | |
| Payroll Taxes | 15% | $4,650 | $4,650 | $4,650 | $4,650 | $4,650 | $4,650 | $4,650 | $4,650 | $4,650 | $4,650 | $4,650 | $4,650 |
| Other | $0 | $0 | $0 | $0 | $0 | $0 | $0 | $0 | $0 | $0 | $0 | $0 | |
| Total Operating Expenses | $46,100 | $47,100 | $47,250 | $46,400 | $46,700 | $47,000 | $47,000 | $46,850 | $47,850 | $46,850 | $47,450 | $46,550 | |
| Profit Before Interest and Taxes | ($7,600) | ($8,600) | ($5,250) | ($900) | $5,800 | $12,500 | $12,500 | $9,150 | $8,150 | $9,150 | $22,550 | $2,450 | |
| EBITDA | ($6,400) | ($7,400) | ($4,050) | $300 | $7,000 | $13,700 | $13,700 | $10,350 | $9,350 | $10,350 | $23,750 | $3,650 | |
| Interest Expense | $331 | $328 | $325 | $322 | $319 | $317 | $314 | $311 | $308 | $305 | $303 | $300 | |
| Taxes Incurred | ($2,379) | ($2,678) | ($1,672) | ($367) | $1,644 | $3,655 | $3,656 | $2,652 | $2,353 | $2,653 | $6,674 | $645 | |
| Net Profit | ($5,551) | ($6,249) | ($3,902) | ($856) | $3,836 | $8,528 | $8,530 | $6,187 | $5,489 | $6,191 | $15,573 | $1,505 | |
| Net Profit/Sales | -10.09% | -11.36% | -6.50% | -1.32% | 5.12% | 10.03% | 10.04% | 7.73% | 6.86% | 7.74% | 15.57% | 2.15% | |
| Pro Forma Cash Flow | |||||||||||||
| Feb | Mar | Apr | May | Jun | Jul | Aug | Sep | Oct | Nov | Dec | Jan | ||
| Cash Received | |||||||||||||
| Cash from Operations | |||||||||||||
| Cash Sales | $13,750 | $13,750 | $15,000 | $16,250 | $18,750 | $21,250 | $21,250 | $20,000 | $20,000 | $20,000 | $25,000 | $17,500 | |
| Cash from Receivables | $40,000 | $41,375 | $41,250 | $41,375 | $45,125 | $49,000 | $56,500 | $63,750 | $63,625 | $60,000 | $60,000 | $60,500 | |
| Subtotal Cash from Operations | $53,750 | $55,125 | $56,250 | $57,625 | $63,875 | $70,250 | $77,750 | $83,750 | $83,625 | $80,000 | $85,000 | $78,000 | |
| Additional Cash Received | |||||||||||||
| Sales Tax, VAT, HST/GST Received | 0.00% | $0 | $0 | $0 | $0 | $0 | $0 | $0 | $0 | $0 | $0 | $0 | $0 |
| New Current Borrowing | $0 | $0 | $0 | $0 | $0 | $0 | $0 | $0 | $0 | $0 | $0 | $0 | |
| New Other Liabilities (interest-free) | $0 | $0 | $0 | $0 | $0 | $0 | $0 | $0 | $0 | $0 | $0 | $0 | |
| New Long-term Liabilities | $0 | $0 | $0 | $0 | $0 | $0 | $0 | $0 | $0 | $0 | $0 | $0 | |
| Sales of Other Current Assets | $0 | $0 | $0 | $0 | $0 | $0 | $0 | $0 | $0 | $0 | $0 | $0 | |
| Sales of Long-term Assets | $0 | $0 | $0 | $0 | $0 | $0 | $0 | $0 | $0 | $0 | $0 | $0 | |
| New Investment Received | $0 | $0 | $0 | $0 | $0 | $0 | $0 | $0 | $0 | $0 | $0 | $0 | |
| Subtotal Cash Received | $53,750 | $55,125 | $56,250 | $57,625 | $63,875 | $70,250 | $77,750 | $83,750 | $83,625 | $80,000 | $85,000 | $78,000 | |
| Expenditures | Feb | Mar | Apr | May | Jun | Jul | Aug | Sep | Oct | Nov | Dec | Jan | |
| Expenditures from Operations | |||||||||||||
| Cash Spending | $31,000 | $31,000 | $31,000 | $31,000 | $31,000 | $31,000 | $31,000 | $31,000 | $31,000 | $31,000 | $31,000 | $31,000 | |
| Bill Payments | $20,883 | $26,586 | $29,193 | $33,418 | $35,537 | $42,440 | $47,462 | $44,126 | $40,041 | $42,287 | $42,183 | $57,746 | |
| Subtotal Spent on Operations | $51,883 | $57,586 | $60,193 | $64,418 | $66,537 | $73,440 | $78,462 | $75,126 | $71,041 | $73,287 | $73,183 | $88,746 | |
| Additional Cash Spent | |||||||||||||
| Sales Tax, VAT, HST/GST Paid Out | $0 | $0 | $0 | $0 | $0 | $0 | $0 | $0 | $0 | $0 | $0 | $0 | |
| Principal Repayment of Current Borrowing | $0 | $0 | $0 | $0 | $0 | $0 | $0 | $0 | $0 | $0 | $0 | $0 | |
| Other Liabilities Principal Repayment | $0 | $0 | $0 | $0 | $0 | $0 | $0 | $0 | $0 | $0 | $0 | $0 | |
| Long-term Liabilities Principal Repayment | $335 | $335 | $335 | $335 | $335 | $335 | $335 | $335 | $335 | $335 | $335 | $335 | |
| Purchase Other Current Assets | $0 | $0 | $0 | $0 | $0 | $0 | $0 | $0 | $0 | $0 | $0 | $0 | |
| Purchase Long-term Assets | $0 | $0 | $0 | $0 | $0 | $0 | $0 | $0 | $0 | $0 | $0 | $0 | |
| Dividends | $0 | $0 | $0 | $0 | $0 | $0 | $0 | $0 | $0 | $0 | $0 | $0 | |
| Subtotal Cash Spent | $52,218 | $57,921 | $60,528 | $64,753 | $66,872 | $73,775 | $78,797 | $75,461 | $71,376 | $73,622 | $73,518 | $89,081 | |
| Net Cash Flow | $1,532 | ($2,796) | ($4,278) | ($7,128) | ($2,997) | ($3,525) | ($1,047) | $8,289 | $12,249 | $6,378 | $11,482 | ($11,081) | |
| Cash Balance | $81,532 | $78,735 | $74,457 | $67,330 | $64,332 | $60,807 | $59,760 | $68,049 | $80,298 | $86,676 | $98,158 | $87,077 | |
| Pro Forma Balance Sheet | |||||||||||||
| Feb | Mar | Apr | May | Jun | Jul | Aug | Sep | Oct | Nov | Dec | Jan | ||
| Assets | Starting Balances | ||||||||||||
| Current Assets | |||||||||||||
| Cash | $80,000 | $81,532 | $78,735 | $74,457 | $67,330 | $64,332 | $60,807 | $59,760 | $68,049 | $80,298 | $86,676 | $98,158 | $87,077 |
| Accounts Receivable | $80,000 | $81,250 | $81,125 | $84,875 | $92,250 | $103,375 | $118,125 | $125,375 | $121,625 | $118,000 | $118,000 | $133,000 | $125,000 |
| Inventory | $20,000 | $18,150 | $18,150 | $19,800 | $21,450 | $24,750 | $28,050 | $28,050 | $26,400 | $26,400 | $26,400 | $33,000 | $23,100 |
| Other Current Assets | $5,000 | $5,000 | $5,000 | $5,000 | $5,000 | $5,000 | $5,000 | $5,000 | $5,000 | $5,000 | $5,000 | $5,000 | $5,000 |
| Total Current Assets | $185,000 | $185,932 | $183,010 | $184,132 | $186,030 | $197,457 | $211,982 | $218,185 | $221,074 | $229,698 | $236,076 | $269,158 | $240,177 |
| Long-term Assets | |||||||||||||
| Long-term Assets | $100,000 | $100,000 | $100,000 | $100,000 | $100,000 | $100,000 | $100,000 | $100,000 | $100,000 | $100,000 | $100,000 | $100,000 | $100,000 |
| Accumulated Depreciation | $12,000 | $13,200 | $14,400 | $15,600 | $16,800 | $18,000 | $19,200 | $20,400 | $21,600 | $22,800 | $24,000 | $25,200 | $26,400 |
| Total Long-term Assets | $88,000 | $86,800 | $85,600 | $84,400 | $83,200 | $82,000 | $80,800 | $79,600 | $78,400 | $77,200 | $76,000 | $74,800 | $73,600 |
| Total Assets | $273,000 | $272,732 | $268,610 | $268,532 | $269,230 | $279,457 | $292,782 | $297,785 | $299,474 | $306,898 | $312,076 | $343,958 | $313,777 |
| Liabilities and Capital | Feb | Mar | Apr | May | Jun | Jul | Aug | Sep | Oct | Nov | Dec | Jan | |
| Current Liabilities | |||||||||||||
| Accounts Payable | $20,000 | $25,618 | $28,081 | $32,241 | $34,129 | $40,855 | $45,986 | $42,794 | $38,631 | $40,900 | $40,222 | $56,866 | $25,515 |
| Current Borrowing | $0 | $0 | $0 | $0 | $0 | $0 | $0 | $0 | $0 | $0 | $0 | $0 | $0 |
| Other Current Liabilities | $0 | $0 | $0 | $0 | $0 | $0 | $0 | $0 | $0 | $0 | $0 | $0 | $0 |
| Subtotal Current Liabilities | $20,000 | $25,618 | $28,081 | $32,241 | $34,129 | $40,855 | $45,986 | $42,794 | $38,631 | $40,900 | $40,222 | $56,866 | $25,515 |
| Long-term Liabilities | $40,000 | $39,665 | $39,330 | $38,995 | $38,660 | $38,325 | $37,990 | $37,655 | $37,320 | $36,985 | $36,650 | $36,315 | $35,980 |
| Total Liabilities | $60,000 | $65,283 | $67,411 | $71,236 | $72,789 | $79,180 | $83,976 | $80,449 | $75,951 | $77,885 | $76,872 | $93,181 | $61,495 |
| Paid-in Capital | $80,000 | $80,000 | $80,000 | $80,000 | $80,000 | $80,000 | $80,000 | $80,000 | $80,000 | $80,000 | $80,000 | $80,000 | $80,000 |
| Retained Earnings | $109,000 | $133,000 | $133,000 | $133,000 | $133,000 | $133,000 | $133,000 | $133,000 | $133,000 | $133,000 | $133,000 | $133,000 | $133,000 |
| Earnings | $24,000 | ($5,551) | ($11,801) | ($15,703) | ($16,559) | ($12,722) | ($4,194) | $4,336 | $10,524 | $16,013 | $22,204 | $37,777 | $39,282 |
| Total Capital | $213,000 | $207,449 | $201,199 | $197,297 | $196,441 | $200,278 | $208,806 | $217,336 | $223,524 | $229,013 | $235,204 | $250,777 | $252,282 |
| Total Liabilities and Capital | $273,000 | $272,732 | $268,610 | $268,532 | $269,230 | $279,457 | $292,782 | $297,785 | $299,474 | $306,898 | $312,076 | $343,958 | $313,777 |
| Net Worth | $213,000 | $207,449 | $201,199 | $197,297 | $196,441 | $200,278 | $208,806 | $217,336 | $223,524 | $229,013 | $235,204 | $250,777 | $252,282 |

