
The Bottlecap
Executive Summary
The Bottlecap is a specialty beer tavern located near the campus of the University of Oregon.
The Bottlecap will be serving the university and the Eugene, Oregon community with a constantly rotating lineup of premium, unique microbrews for the discerning beer connoisseur.
The Bottlecap is a privately-funded venture lead by Dashiell Lavine and Tyler Vogel.
The Market
The Pacific Northwest is the premier microbrew center in the world. Oregon and Washington boast the highest number of microbrew facilities of any of the 50 states.
In addition to having a lot of production in this area, enjoying fine beers is a culture within itself in the Pacific Northwest, particularly Oregon. To be sure, the market for people that appreciate fine beers is huge.
The Bottlecap will be targeting three distinct customer segments. The first is the beer connoisseur, those that have a true passion for fine beers. This segment has a yearly growth rate of 12% with over 12,000 possible customers.
The Bottlecap will also be targeting the general bar attending crowd. This group are typically professionals that use taverns as a place to unwind after work and socialize. This section is growing at 8% with 30,000 potential members.
The last group that The Bottlecap will go after is the college students of the U of O. This group cares a bit less about the quality of the beer because they are more price sensitive. The number college students are growing at 10% and there are a total of 20,000 to draw off of.
The Competition
The Bottlecap has three direct competitors that are all centrally located near the U of O campus.
The Bottlecap is able to differentiate itself from these competitors through its emphasis on fine beer. The competitors more accurately targets the college students and their lower price point.
The Bottlecap’s emphasis on an outstanding selection of premium beers is one of two competitive edges.
Its second competitive edge is a companion website that was developed as an active feedback mechanism for the customers to express their preference of the beer selection. This allows the customers to have a direct impact on the tap offerings. In addition to giving the customers what they want in terms of beer, it also provides the customer with a feeling of empowerment and a sense that The Bottlecap exists to truly meet their needs.
The Management Team
The Bottlecap was founded and will be run by Dashiell Lavine and Tyler Vogel.
Dashiell’s experience is primarily from the restaurant industry. After receiving his undergraduate degree from Reed College, Dashiell went to work serving at Il Piato, a fine Italian restaurant in NW Portland.
Dashiell worked as a server for two years and then was asked to manage the entire restaurant. Dashill did this for five years, gaining incredible experience and insight regarding all aspects of running a restaurant, both front-end, customer oriented skills as well as back-end operations. The time spent at Il Piato solidified Dashiell’s desire to be his own boss and remain in the restaurant/bar industry.
Tyler came from a more academic background as a CPA from Arthur Anderson (AA). Through school Tyler served in restaurants, but after graduation went to work for AA where he developed an incredible array of financial control skills.
Since it is well known that most restaurants die within the first year, Tyler’s financial analysis and control skills will be indispensable in assuring a solid control mechanism to accurately track and manage the large cash sums that will travel through The Bottlecap every day.
The Bottlecap will be a successful venture as it serves the huge demand for premium beers.
The Bottlecap will offer customers a friendly social atmosphere where they can catch up with old friends, meet new ones, and enjoy fine beers. It is forecasted that The Bottlecap will reach profitability by month four and achieve approximately $73,000 in profits by year three.

1.1 Objectives
Below is a list of the objectives for The Bottlecap.
- Have eight or more good quality, hard-to-find beers on tap.
- Have business grow at least 10% per month.
- Create customer awareness of what The Bottlecap offers through the companion website. Measure popularity by tracking hits on the website.
1.2 Mission
To create an economically healthy organization that provides a variety of quality beers in a casual and classy environment that appeals to a wide range of customers.
1.3 Keys to Success
The keys to the success of The Bottlecap can be summarized by the following points:
- Maintain good relationships with reliable beer distributors.
- Well designed bar with a unique and entertaining atmosphere.
- Quality entertainment.
- Repeat customers.
Company Summary
The Bottlecap, which will be located near the University of Oregon, will offer the community a classy bar with unique beers on tap. The Bottlecap will also provide customers with an innovative environment for enjoying these high quality beers.
2.1 Company Ownership
The Bottlecap will be a privately funded company that will be owned and run by Dashiell Lavine and Tyler Vogel. They will both be equal partners. Joe Smith and Bob Adler will also hold minority stock positions as private investors.
2.2 Start-up Summary
The Bottlecap’s start-up costs will cover beer serving equipment, site renovation and remodeling, capital to cover losses during the first year, a computer to maintain The Bottlecap’s Web presence, and the entertainment equipment, including a big screen television for sports, a pool table, and a stereo. In addition, costs will be allocated for the beer serving equipment. Eight taps, Carbon Dioxide tanks, and glassware will be purchased from various equipment vendors in Eugene.
The site will require funds for renovation and modification. A single estimated figure will be allocated for this purpose. The renovation/modification cost estimate will include the costs associated with preparing the site for opening business in May.
The furniture, the site renovation, permits and fees, and the entertainment equipment will account for a large amount of our start-up costs.
Because of the competitive nature of the marketplace, we have accounted for more money than necessary when it comes to the cash balance. By doing so, we will be in a good position should our numbers not match what we have forecasted and will not lose the large amount invested to start the business.

| Start-up | |
| Requirements | |
| Start-up Expenses | |
| Fees & Permits | $7,500 |
| Exterior Sign | $2,500 |
| Pool Table | $5,000 |
| Stereo System | $350 |
| Legal | $500 |
| Consultants | $1,000 |
| Insurance | $700 |
| Rent | $1,500 |
| Taps | $800 |
| Glassware | $500 |
| Computer System | $1,500 |
| Misc. Supplies & Equipment | $700 |
| Bathroom Supplies | $250 |
| Marketing | $1,000 |
| Fixtures & Re-Model | $25,000 |
| Big Screen Television | $2,000 |
| Point of Sale Systems | $5,000 |
| Furniture | $10,000 |
| Total Start-up Expenses | $65,800 |
| Start-up Assets | |
| Cash Required | $7,920 |
| Start-up Inventory | $1,280 |
| Other Current Assets | $0 |
| Long-term Assets | $0 |
| Total Assets | $9,200 |
| Total Requirements | $75,000 |
| Start-up Funding | |
| Start-up Expenses to Fund | $65,800 |
| Start-up Assets to Fund | $9,200 |
| Total Funding Required | $75,000 |
| Assets | |
| Non-cash Assets from Start-up | $1,280 |
| Cash Requirements from Start-up | $7,920 |
| Additional Cash Raised | $0 |
| Cash Balance on Starting Date | $7,920 |
| Total Assets | $9,200 |
| Liabilities and Capital | |
| Liabilities | |
| Current Borrowing | $0 |
| Long-term Liabilities | $0 |
| Accounts Payable (Outstanding Bills) | $0 |
| Other Current Liabilities (interest-free) | $0 |
| Total Liabilities | $0 |
| Capital | |
| Planned Investment | |
| Dashiell Lavine | $20,000 |
| Tyler Vogel | $20,000 |
| Joe Smith | $17,500 |
| Bob Adler | $17,500 |
| Other | $0 |
| Additional Investment Requirement | $0 |
| Total Planned Investment | $75,000 |
| Loss at Start-up (Start-up Expenses) | ($65,800) |
| Total Capital | $9,200 |
| Total Capital and Liabilities | $9,200 |
| Total Funding | $75,000 |
2.3 Company Locations and Facilities
The Bottlecap’s location will be chosen based upon the following criteria listed in order of importance:

All of these qualities are consistent with The Bottlecap’s goal of providing a central hub of communication and socialization for the Eugene community. In addition to a main area of the bar, there will be two additional rooms. One of the rooms will be the manager’s office and will also house the computer that the website will be maintained on. The second room will be a storage facility for supplies and extra kegs of beer.
Services
The Bottlecap will provide its customers with a unique and friendly environment for enjoying specialty brews and other quality beers. The Bottlecap will also provide customers with a unique and innovative environment for enjoying the quality beers on tap, including a pool table and a big screen television for sporting events.
3.1 Competitive Comparison
The Bottlecap will be the first classy beer-only pub located near the campus that provides its customers with quality beer at affordable prices.
Market Analysis Summary
The Northwest is the Mecca of microbrews and home brewing, and in recent years there has been a surge of interest in craft beers. That is why we believe The Bottlecap, a speciality beer tavern, will flourish in the city of Eugene. Our target markets include beer connoisseurs, professionals, and college students. The identification of these three markets will help us to better direct our advertising and marketing efforts.
4.1 Market Segmentation
Our numbers are based upon the approximate population of Eugene and Springfield. Because many people are not drinkers, we decided upon the number 100,000 for the total of people considered available customers. We then segmented the available customers into the following groups:
Beer Connoisseur: These people will be drawn to The Bottlecap because of their love and passion for beer. The main appeal to this segment will be the large number of hard-to-find beers that are available at our establishment.
Professionals: The general bar-attending public from Eugene. This group will be drawn to the bar after work to relax in a friendly and classy atmosphere.
College Students: University of Oregon and Lane Community College students. More bargain marketing will be aimed at the segment of the market.

| Market Analysis | |||||||
| Year 1 | Year 2 | Year 3 | Year 4 | Year 5 | |||
| Potential Customers | Growth | CAGR | |||||
| Beer Conniseurs | 12% | 20,000 | 22,400 | 25,088 | 28,099 | 31,471 | 12.00% |
| Professionals | 8% | 30,000 | 32,400 | 34,992 | 37,791 | 40,814 | 8.00% |
| College Students | 10% | 20,000 | 22,000 | 24,200 | 26,620 | 29,282 | 10.00% |
| Other | 2% | 30,000 | 30,600 | 31,212 | 31,836 | 32,473 | 2.00% |
| Total | 7.60% | 100,000 | 107,400 | 115,492 | 124,346 | 134,040 | 7.60% |
4.2 Target Market Segment Strategy
Both advertising and word-of-mouth will play a big part in the success of The Bottlecap. Therefore, we will strive to appeal to both new and old customers with a unique advertising campaign, including an online presence that will allow regulars to vote for which beers will be featured each week, as well as a friendly atmosphere that will keep the customers coming back.
4.3 Service Business Analysis
The pub and bar industry in Eugene has grown steadily in its past years. Many factors contribute to the large demand for good beer in Eugene. The climate in Eugene is extremely conducive to beer consumption. Current trends in the Northwest reflect the popularity of unique, quality microbrews. In short, Eugene is a haven for beer lovers.
Due to intense competition, bar owners must look for ways to differentiate their place of business from others in order to achieve and maintain a competitive advantage. The founders of The Bottlecap realize the need for differentiation and strongly believe that combining a bar with a classy and entertaining atmosphere is the key to its success.
4.4 Main Competitors
Since the business will be located near the University of Oregon campus, our three main competitors will be Rennie’s Landing, Taylor’s Bar & Grill, and Max’s Tavern. During the first six months of operation we will aggressively advertise ourselves to University students to differentiate ourselves from the competition.
Strategy and Implementation Summary
The main target audience will be University of Oregon students, therefore, we will principally advertise in the University of Oregon’s Daily Emerald and the Eugene Weekly. We will also advertise on various radio stations.
5.1 Competitive Edge
The Bottlecap will have an edge over the competition due to the large number of specialty beers that will be on tap. The companion website will also give regular customers additional incentive to keep returning to the bar due the ability to vote and influence what beers are on tap as the specialty beers each week. We will also further differentiate ourselves by creating a classy yet laid-back atmosphere that will include a big screen television and a high quality pool table.
5.2 Marketing Strategy
Both advertising and word-of-mouth will play a big part in the success of The Bottlecap. Therefore, we will strive to appeal to both new and old customers with a unique advertising campaign, including a online presence that will allow regulars to vote for which beers will be featured each week, as well as a friendly atmosphere that will keep the customers coming back.
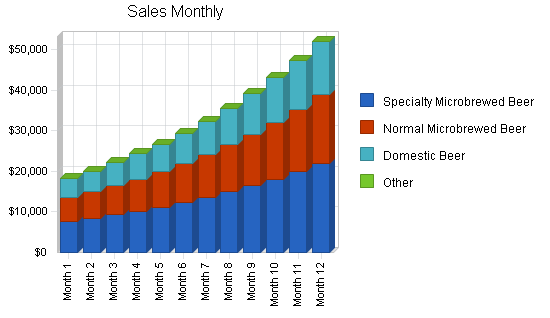
5.3 Sales Forecast
The Bottlecap’s sales forecast was estimated by breaking down each day we are open into hours, and then estimating the number of beers we will sell during those hours. Our starting hours of operation will be 12 p.m.-3 a.m. Saturday, 12 p.m.-12 a.m. Sunday, and 4 p.m.-3 a.m. Wednesday-Friday.
- On average, our numbers for Saturday turned out to be 35 beers an hour.
- On Sunday, we estimated approximately 15 beers an hour.
- Finally, the average for Wednesday-Friday turned out to be 25 beers an hour.
We then estimated that approximately 30% of our sales will be domestic beer, 38% specialty microbrew beer, and 32% local microbrew beer. The unit prices and direct unit costs were based upon the cost of the same type of beers sold at local bars and the cost of kegs from local distributors. These numbers could drastically shift either way depending upon location, market saturation, and the customer base.

| Sales Forecast | |||
| Year 1 | Year 2 | Year 3 | |
| Unit Sales | |||
| Specialty Microbrewed Beer | 50,381 | 55,419 | 60,961 |
| Normal Microbrewed Beer | 42,426 | 46,668 | 51,335 |
| Domestic Beer | 39,775 | 43,752 | 48,127 |
| Other | 0 | 0 | 0 |
| Total Unit Sales | 132,583 | 145,839 | 160,423 |
| Unit Prices | Year 1 | Year 2 | Year 3 |
| Specialty Microbrewed Beer | $3.25 | $3.25 | $3.50 |
| Normal Microbrewed Beer | $3.00 | $3.00 | $3.25 |
| Domestic Beer | $2.50 | $2.50 | $2.75 |
| Other | $0.00 | $0.00 | $0.00 |
| Sales | |||
| Specialty Microbrewed Beer | $163,739 | $180,112 | $213,364 |
| Normal Microbrewed Beer | $127,279 | $140,004 | $166,839 |
| Domestic Beer | $99,437 | $109,380 | $132,349 |
| Other | $0 | $0 | $0 |
| Total Sales | $390,456 | $429,496 | $512,552 |
| Direct Unit Costs | Year 1 | Year 2 | Year 3 |
| Specialty Microbrewed Beer | $0.81 | $0.81 | $0.86 |
| Normal Microbrewed Beer | $0.65 | $0.65 | $0.70 |
| Domestic Beer | $0.48 | $0.48 | $0.53 |
| Other | $0.00 | $0.00 | $0.00 |
| Direct Cost of Sales | |||
| Specialty Microbrewed Beer | $40,809 | $44,889 | $52,426 |
| Normal Microbrewed Beer | $27,577 | $30,334 | $35,935 |
| Domestic Beer | $19,092 | $21,001 | $25,507 |
| Other | $0 | $0 | $0 |
| Subtotal Direct Cost of Sales | $87,478 | $96,225 | $113,868 |
5.4 Milestones
The Bottlecap’s management team has established some basic milestones to keep the business plan priorities in place. Responsibility for implementation falls on the shoulders of Tyler Vogel and Dashiell Lavine. The Milestones table below will be updated as the year progresses using the actual tables. New milestones will be added as the first year of operations commences.
| Milestones | |||||
| Milestone | Start Date | End Date | Budget | Manager | Department |
| Business Plan | 5/1/2001 | 5/30/2001 | $1,000 | Tyler Vogel and Dashiell Lavine | Admin |
| Secure Start-up Funding | 6/15/2001 | 7/1/2001 | $1,000 | Tyler Vogel and Dashiell Lavine | Admin |
| Site Selection | 7/1/2001 | 7/15/2001 | $1,000 | Tyler Vogel and Dashiell Lavine | Admin |
| Architect Designs | 8/1/2001 | 9/1/2001 | $1,000 | Tyler Vogel and Dashiell Lavine | Admin |
| Designer Proposal | 8/1/2001 | 9/15/2001 | $1,000 | Tyler Vogel and Dashiell Lavine | Admin |
| Technology Design | 8/1/2001 | 9/15/2001 | $1,000 | Tyler Vogel and Dashiell Lavine | Admin |
| Year 1 Plan | 9/1/2001 | 10/5/2001 | $1,000 | Tyler Vogel and Dashiell Lavine | Admin |
| Personnel Plan | 10/1/2001 | 10/10/2001 | $1,000 | Tyler Vogel and Dashiell Lavine | Admin |
| Accounting Plan | 10/1/2001 | 10/5/2001 | $1,000 | Tyler Vogel and Dashiell Lavine | Admin |
| Licensing | 12/1/2001 | 12/15/2001 | $1,000 | Tyler Vogel and Dashiell Lavine | Admin |
| Totals | $10,000 | ||||
Management Summary
The Bottlecap is owned and operated by Dashiell Lavine and Tyler Vogel. The company, being small in nature, requires a simple organizational structure. Implementation of this organizational form calls for the owners and the one manager to make all of the major management decisions in addition to monitoring all other business activities.
6.1 Management Team
Specific details are omitted in this sample plan. Biographies and resumes have not been included for privacy purposes.
6.2 Personnel Plan
The staff will consist of six part-time employees working twenty hours a week at $6.50 per hour. In addition, a manager who oversees daily operations will be employed to work forty hours a week at $10.00 per hour. Dashiell Lavine and Tyler Vogel will help with management decisions and will run the back end of the business, which includes the website and administrative duties. Two of the private investors, Bob Adler and Joe Smith, will not be included in management decisions. This will allow disputes to be solved with less hassle. Because of these characteristics, there are fewer coordination problems seen at The Bottlecap than are common within larger organizational chains. This strategy will enable The Bottlecap to react quickly to changes in the market.
| Personnel Plan | |||
| Year 1 | Year 2 | Year 3 | |
| Production Personnel | |||
| Manager | $19,680 | $19,980 | $20,664 |
| Part-Time Employee 1 | $6,396 | $6,596 | $6,796 |
| Part-Time Employee 2 | $6,396 | $6,596 | $6,796 |
| Part-Time Employee 3 | $6,396 | $6,596 | $6,796 |
| Part-Time Employee 4 | $6,396 | $6,596 | $6,796 |
| Part-Time Employee 5 | $6,396 | $6,596 | $6,796 |
| Part-Time Employee 6 | $6,396 | $6,596 | $6,796 |
| Other | $0 | $6,596 | $6,796 |
| Subtotal | $58,056 | $66,152 | $68,236 |
| Sales and Marketing Personnel | |||
| Name or title | $0 | $0 | $0 |
| Other | $0 | $0 | $0 |
| Subtotal | $0 | $0 | $0 |
| General and Administrative Personnel | |||
| Dashiell Lavine (Part-Owner) | $24,000 | $25,000 | $26,000 |
| Tyler Vogel (Part-Owner) | $24,000 | $25,000 | $26,000 |
| Other | $0 | $0 | $0 |
| Subtotal | $48,000 | $50,000 | $52,000 |
| Other Personnel | |||
| Name or title | $0 | $0 | $0 |
| Other | $0 | $0 | $0 |
| Subtotal | $0 | $0 | $0 |
| Total People | 0 | 0 | 0 |
| Total Payroll | $106,056 | $116,152 | $120,236 |
Financial Plan
The following section will lay out the general financial plan including our break-even analysis, profit and loss, cash flow, general assumptions, the balance sheet, and the business ratios.
7.1 Important Assumptions
The following table summarizes important assumptions necessary for good financial planning.
| General Assumptions | |||
| Year 1 | Year 2 | Year 3 | |
| Plan Month | 1 | 2 | 3 |
| Current Interest Rate | 10.00% | 10.00% | 10.00% |
| Long-term Interest Rate | 10.00% | 10.00% | 10.00% |
| Tax Rate | 25.42% | 25.00% | 25.42% |
| Other | 0 | 0 | 0 |
7.2 Break-even Analysis
The following table and chart summarize our break-even analysis. To break even we must sell at least 5,300 beers based upon the per unit cost. Therefore, customer traffic will become a big factor when it comes to the success of The Bottlecap.

| Break-even Analysis | |
| Monthly Units Break-even | 5,335 |
| Monthly Revenue Break-even | $15,713 |
| Assumptions: | |
| Average Per-Unit Revenue | $2.94 |
| Average Per-Unit Variable Cost | $0.66 |
| Estimated Monthly Fixed Cost | $12,192 |
7.3 Key Financial Indicators
The following chart compares five key indicators in regards to how much they change over the course of the first three years of plan implementation.

7.4 Projected Profit and Loss
One of the keys to success with a beer tavern such as The Bottlecap is the gross margin because of the low cost of buying beer in bulk. The profit-per-unit becomes very important because of the relatively high costs associated with running such an establishment.


| Pro Forma Profit and Loss | |||
| Year 1 | Year 2 | Year 3 | |
| Sales | $390,456 | $429,496 | $512,552 |
| Direct Cost of Sales | $87,478 | $96,225 | $113,868 |
| Production Payroll | $58,056 | $66,152 | $68,236 |
| Other | $24,000 | $30,000 | $40,000 |
| Total Cost of Sales | $169,534 | $192,377 | $222,104 |
| Gross Margin | $220,922 | $237,119 | $290,447 |
| Gross Margin % | 56.58% | 55.21% | 56.67% |
| Operating Expenses | |||
| Sales and Marketing Expenses | |||
| Sales and Marketing Payroll | $0 | $0 | $0 |
| Advertising/Promotion | $39,000 | $50,000 | $75,000 |
| Miscellaneous | $6,000 | $9,000 | $12,000 |
| Total Sales and Marketing Expenses | $45,000 | $59,000 | $87,000 |
| Sales and Marketing % | 11.52% | 13.74% | 16.97% |
| General and Administrative Expenses | |||
| General and Administrative Payroll | $48,000 | $50,000 | $52,000 |
| Sales and Marketing and Other Expenses | $0 | $0 | $0 |
| Depreciation | $0 | $0 | $0 |
| Leased Equipment | $0 | $0 | $0 |
| Utilities | $9,000 | $11,000 | $12,000 |
| Insurance | $8,400 | $9,500 | $11,000 |
| Rent | $18,000 | $12,000 | $12,000 |
| Payroll Taxes | $15,908 | $17,423 | $18,035 |
| Other General and Administrative Expenses | $0 | $0 | $0 |
| Total General and Administrative Expenses | $99,308 | $99,923 | $105,035 |
| General and Administrative % | 25.43% | 23.27% | 20.49% |
| Other Expenses: | |||
| Other Payroll | $0 | $0 | $0 |
| Consultants | $0 | $0 | $0 |
| Contract/Consultants | $2,000 | $0 | $0 |
| Total Other Expenses | $2,000 | $0 | $0 |
| Other % | 0.51% | 0.00% | 0.00% |
| Total Operating Expenses | $146,308 | $158,923 | $192,035 |
| Profit Before Interest and Taxes | $74,613 | $78,196 | $98,412 |
| EBITDA | $74,613 | $78,196 | $98,412 |
| Interest Expense | $75 | $0 | $0 |
| Taxes Incurred | $18,262 | $19,549 | $25,013 |
| Net Profit | $56,276 | $58,647 | $73,399 |
| Net Profit/Sales | 14.41% | 13.65% | 14.32% |
7.5 Projected Cash Flow
The following chart and table explain the key elements of the pro forma cash flow.

| Pro Forma Cash Flow | |||
| Year 1 | Year 2 | Year 3 | |
| Cash Received | |||
| Cash from Operations | |||
| Cash Sales | $390,456 | $429,496 | $512,552 |
| Subtotal Cash from Operations | $390,456 | $429,496 | $512,552 |
| Additional Cash Received | |||
| Sales Tax, VAT, HST/GST Received | $0 | $0 | $0 |
| New Current Borrowing | $2,000 | $0 | $0 |
| New Other Liabilities (interest-free) | $0 | $0 | $0 |
| New Long-term Liabilities | $0 | $0 | $0 |
| Sales of Other Current Assets | $0 | $0 | $0 |
| Sales of Long-term Assets | $0 | $0 | $0 |
| New Investment Received | $3,000 | $0 | $0 |
| Subtotal Cash Received | $395,456 | $429,496 | $512,552 |
| Expenditures | Year 1 | Year 2 | Year 3 |
| Expenditures from Operations | |||
| Cash Spending | $106,056 | $116,152 | $120,236 |
| Bill Payments | $212,551 | $262,072 | $316,120 |
| Subtotal Spent on Operations | $318,607 | $378,224 | $436,356 |
| Additional Cash Spent | |||
| Sales Tax, VAT, HST/GST Paid Out | $0 | $0 | $0 |
| Principal Repayment of Current Borrowing | $2,000 | $0 | $0 |
| Other Liabilities Principal Repayment | $0 | $0 | $0 |
| Long-term Liabilities Principal Repayment | $0 | $0 | $0 |
| Purchase Other Current Assets | $50,000 | $0 | $0 |
| Purchase Long-term Assets | $0 | $0 | $0 |
| Dividends | $0 | $0 | $0 |
| Subtotal Cash Spent | $370,607 | $378,224 | $436,356 |
| Net Cash Flow | $24,849 | $51,272 | $76,195 |
| Cash Balance | $32,769 | $84,040 | $160,236 |
7.6 Projected Balance Sheet
The table below is the complete balance sheet which includes all assets, liabilities, and capital.
| Pro Forma Balance Sheet | |||
| Year 1 | Year 2 | Year 3 | |
| Assets | |||
| Current Assets | |||
| Cash | $32,769 | $84,040 | $160,236 |
| Inventory | $12,839 | $14,122 | $16,712 |
| Other Current Assets | $50,000 | $50,000 | $50,000 |
| Total Current Assets | $95,607 | $148,163 | $226,947 |
| Long-term Assets | |||
| Long-term Assets | $0 | $0 | $0 |
| Accumulated Depreciation | $0 | $0 | $0 |
| Total Long-term Assets | $0 | $0 | $0 |
| Total Assets | $95,607 | $148,163 | $226,947 |
| Liabilities and Capital | Year 1 | Year 2 | Year 3 |
| Current Liabilities | |||
| Accounts Payable | $27,131 | $21,039 | $26,425 |
| Current Borrowing | $0 | $0 | $0 |
| Other Current Liabilities | $0 | $0 | $0 |
| Subtotal Current Liabilities | $27,131 | $21,039 | $26,425 |
| Long-term Liabilities | $0 | $0 | $0 |
| Total Liabilities | $27,131 | $21,039 | $26,425 |
| Paid-in Capital | $78,000 | $78,000 | $78,000 |
| Retained Earnings | ($65,800) | ($9,524) | $49,123 |
| Earnings | $56,276 | $58,647 | $73,399 |
| Total Capital | $68,476 | $127,123 | $200,522 |
| Total Liabilities and Capital | $95,607 | $148,163 | $226,947 |
| Net Worth | $68,476 | $127,123 | $200,522 |
7.7 Business Ratios
The Ratios table shows important ratios for The Bottlecap. These ratios are derived from the Standard Industry Classification (SIC) Index, code 5813.
| Ratio Analysis | ||||
| Year 1 | Year 2 | Year 3 | Industry Profile | |
| Sales Growth | 0.00% | 10.00% | 19.34% | 1.90% |
| Percent of Total Assets | ||||
| Inventory | 13.43% | 9.53% | 7.36% | 3.10% |
| Other Current Assets | 52.30% | 33.75% | 22.03% | 44.60% |
| Total Current Assets | 100.00% | 100.00% | 100.00% | 52.30% |
| Long-term Assets | 0.00% | 0.00% | 0.00% | 47.70% |
| Total Assets | 100.00% | 100.00% | 100.00% | 100.00% |
| Current Liabilities | 28.38% | 14.20% | 11.64% | 28.20% |
| Long-term Liabilities | 0.00% | 0.00% | 0.00% | 23.10% |
| Total Liabilities | 28.38% | 14.20% | 11.64% | 51.30% |
| Net Worth | 71.62% | 85.80% | 88.36% | 48.70% |
| Percent of Sales | ||||
| Sales | 100.00% | 100.00% | 100.00% | 100.00% |
| Gross Margin | 56.58% | 55.21% | 56.67% | 42.30% |
| Selling, General & Administrative Expenses | 42.26% | 41.55% | 42.27% | 23.40% |
| Advertising Expenses | 9.99% | 11.64% | 14.63% | 2.40% |
| Profit Before Interest and Taxes | 19.11% | 18.21% | 19.20% | 2.80% |
| Main Ratios | ||||
| Current | 3.52 | 7.04 | 8.59 | 1.14 |
| Quick | 3.05 | 6.37 | 7.96 | 0.74 |
| Total Debt to Total Assets | 28.38% | 14.20% | 11.64% | 51.30% |
| Pre-tax Return on Net Worth | 108.85% | 61.51% | 49.08% | 5.20% |
| Pre-tax Return on Assets | 77.96% | 52.78% | 43.36% | 10.60% |
| Additional Ratios | Year 1 | Year 2 | Year 3 | |
| Net Profit Margin | 14.41% | 13.65% | 14.32% | n.a |
| Return on Equity | 82.18% | 46.13% | 36.60% | n.a |
| Activity Ratios | ||||
| Inventory Turnover | 10.91 | 7.14 | 7.39 | n.a |
| Accounts Payable Turnover | 8.83 | 12.17 | 12.17 | n.a |
| Payment Days | 27 | 34 | 27 | n.a |
| Total Asset Turnover | 4.08 | 2.90 | 2.26 | n.a |
| Debt Ratios | ||||
| Debt to Net Worth | 0.40 | 0.17 | 0.13 | n.a |
| Current Liab. to Liab. | 1.00 | 1.00 | 1.00 | n.a |
| Liquidity Ratios | ||||
| Net Working Capital | $68,476 | $127,123 | $200,522 | n.a |
| Interest Coverage | 994.84 | 0.00 | 0.00 | n.a |
| Additional Ratios | ||||
| Assets to Sales | 0.24 | 0.34 | 0.44 | n.a |
| Current Debt/Total Assets | 28% | 14% | 12% | n.a |
| Acid Test | 3.05 | 6.37 | 7.96 | n.a |
| Sales/Net Worth | 5.70 | 3.38 | 2.56 | n.a |
| Dividend Payout | 0.00 | 0.00 | 0.00 | n.a |
Appendix
| Sales Forecast | |||||||||||||
| Month 1 | Month 2 | Month 3 | Month 4 | Month 5 | Month 6 | Month 7 | Month 8 | Month 9 | Month 10 | Month 11 | Month 12 | ||
| Unit Sales | |||||||||||||
| Specialty Microbrewed Beer | 0% | 2,356 | 2,592 | 2,851 | 3,136 | 3,449 | 3,794 | 4,174 | 4,591 | 5,050 | 5,555 | 6,111 | 6,722 |
| Normal Microbrewed Beer | 0% | 1,984 | 2,182 | 2,401 | 2,641 | 2,905 | 3,195 | 3,515 | 3,866 | 4,253 | 4,678 | 5,146 | 5,661 |
| Domestic Beer | 0% | 1,860 | 2,046 | 2,251 | 2,476 | 2,723 | 2,996 | 3,295 | 3,625 | 3,987 | 4,386 | 4,824 | 5,307 |
| Other | 0% | 0 | 0 | 0 | 0 | 0 | 0 | 0 | 0 | 0 | 0 | 0 | 0 |
| Total Unit Sales | 6,200 | 6,820 | 7,502 | 8,252 | 9,077 | 9,985 | 10,984 | 12,082 | 13,290 | 14,619 | 16,081 | 17,689 | |
| Unit Prices | Month 1 | Month 2 | Month 3 | Month 4 | Month 5 | Month 6 | Month 7 | Month 8 | Month 9 | Month 10 | Month 11 | Month 12 | |
| Specialty Microbrewed Beer | $3.25 | $3.25 | $3.25 | $3.25 | $3.25 | $3.25 | $3.25 | $3.25 | $3.25 | $3.25 | $3.25 | $3.25 | |
| Normal Microbrewed Beer | $3.00 | $3.00 | $3.00 | $3.00 | $3.00 | $3.00 | $3.00 | $3.00 | $3.00 | $3.00 | $3.00 | $3.00 | |
| Domestic Beer | $2.50 | $2.50 | $2.50 | $2.50 | $2.50 | $2.50 | $2.50 | $2.50 | $2.50 | $2.50 | $2.50 | $2.50 | |
| Other | $0.00 | $0.00 | $0.00 | $0.00 | $0.00 | $0.00 | $0.00 | $0.00 | $0.00 | $0.00 | $0.00 | $0.00 | |
| Sales | |||||||||||||
| Specialty Microbrewed Beer | $7,657 | $8,423 | $9,265 | $10,191 | $11,211 | $12,332 | $13,565 | $14,921 | $16,413 | $18,055 | $19,860 | $21,846 | |
| Normal Microbrewed Beer | $5,952 | $6,547 | $7,202 | $7,922 | $8,714 | $9,586 | $10,544 | $11,599 | $12,759 | $14,035 | $15,438 | $16,982 | |
| Domestic Beer | $4,650 | $5,115 | $5,627 | $6,189 | $6,808 | $7,489 | $8,238 | $9,062 | $9,968 | $10,964 | $12,061 | $13,267 | |
| Other | $0 | $0 | $0 | $0 | $0 | $0 | $0 | $0 | $0 | $0 | $0 | $0 | |
| Total Sales | $18,259 | $20,085 | $22,093 | $24,303 | $26,733 | $29,406 | $32,347 | $35,582 | $39,140 | $43,054 | $47,359 | $52,095 | |
| Direct Unit Costs | Month 1 | Month 2 | Month 3 | Month 4 | Month 5 | Month 6 | Month 7 | Month 8 | Month 9 | Month 10 | Month 11 | Month 12 | |
| Specialty Microbrewed Beer | 0.00% | $0.81 | $0.81 | $0.81 | $0.81 | $0.81 | $0.81 | $0.81 | $0.81 | $0.81 | $0.81 | $0.81 | $0.81 |
| Normal Microbrewed Beer | 0.00% | $0.65 | $0.65 | $0.65 | $0.65 | $0.65 | $0.65 | $0.65 | $0.65 | $0.65 | $0.65 | $0.65 | $0.65 |
| Domestic Beer | 0.00% | $0.48 | $0.48 | $0.48 | $0.48 | $0.48 | $0.48 | $0.48 | $0.48 | $0.48 | $0.48 | $0.48 | $0.48 |
| Other | 0.00% | $0.00 | $0.00 | $0.00 | $0.00 | $0.00 | $0.00 | $0.00 | $0.00 | $0.00 | $0.00 | $0.00 | $0.00 |
| Direct Cost of Sales | |||||||||||||
| Specialty Microbrewed Beer | $1,908 | $2,099 | $2,309 | $2,540 | $2,794 | $3,073 | $3,381 | $3,719 | $4,091 | $4,500 | $4,950 | $5,445 | |
| Normal Microbrewed Beer | $1,290 | $1,419 | $1,560 | $1,716 | $1,888 | $2,077 | $2,285 | $2,513 | $2,764 | $3,041 | $3,345 | $3,679 | |
| Domestic Beer | $893 | $982 | $1,080 | $1,188 | $1,307 | $1,438 | $1,582 | $1,740 | $1,914 | $2,105 | $2,316 | $2,547 | |
| Other | $0 | $0 | $0 | $0 | $0 | $0 | $0 | $0 | $0 | $0 | $0 | $0 | |
| Subtotal Direct Cost of Sales | $4,091 | $4,500 | $4,950 | $5,445 | $5,989 | $6,588 | $7,247 | $7,972 | $8,769 | $9,646 | $10,610 | $11,671 | |
| Personnel Plan | |||||||||||||
| Month 1 | Month 2 | Month 3 | Month 4 | Month 5 | Month 6 | Month 7 | Month 8 | Month 9 | Month 10 | Month 11 | Month 12 | ||
| Production Personnel | |||||||||||||
| Manager | $1,640 | $1,640 | $1,640 | $1,640 | $1,640 | $1,640 | $1,640 | $1,640 | $1,640 | $1,640 | $1,640 | $1,640 | |
| Part-Time Employee 1 | $533 | $533 | $533 | $533 | $533 | $533 | $533 | $533 | $533 | $533 | $533 | $533 | |
| Part-Time Employee 2 | $533 | $533 | $533 | $533 | $533 | $533 | $533 | $533 | $533 | $533 | $533 | $533 | |
| Part-Time Employee 3 | $533 | $533 | $533 | $533 | $533 | $533 | $533 | $533 | $533 | $533 | $533 | $533 | |
| Part-Time Employee 4 | $533 | $533 | $533 | $533 | $533 | $533 | $533 | $533 | $533 | $533 | $533 | $533 | |
| Part-Time Employee 5 | $533 | $533 | $533 | $533 | $533 | $533 | $533 | $533 | $533 | $533 | $533 | $533 | |
| Part-Time Employee 6 | $533 | $533 | $533 | $533 | $533 | $533 | $533 | $533 | $533 | $533 | $533 | $533 | |
| Other | $0 | $0 | $0 | $0 | $0 | $0 | $0 | $0 | $0 | $0 | $0 | $0 | |
| Subtotal | $4,838 | $4,838 | $4,838 | $4,838 | $4,838 | $4,838 | $4,838 | $4,838 | $4,838 | $4,838 | $4,838 | $4,838 | |
| Sales and Marketing Personnel | |||||||||||||
| Name or title | $0 | $0 | $0 | $0 | $0 | $0 | $0 | $0 | $0 | $0 | $0 | $0 | |
| Other | $0 | $0 | $0 | $0 | $0 | $0 | $0 | $0 | $0 | $0 | $0 | $0 | |
| Subtotal | $0 | $0 | $0 | $0 | $0 | $0 | $0 | $0 | $0 | $0 | $0 | $0 | |
| General and Administrative Personnel | |||||||||||||
| Dashiell Lavine (Part-Owner) | $2,000 | $2,000 | $2,000 | $2,000 | $2,000 | $2,000 | $2,000 | $2,000 | $2,000 | $2,000 | $2,000 | $2,000 | |
| Tyler Vogel (Part-Owner) | $2,000 | $2,000 | $2,000 | $2,000 | $2,000 | $2,000 | $2,000 | $2,000 | $2,000 | $2,000 | $2,000 | $2,000 | |
| Other | $0 | $0 | $0 | $0 | $0 | $0 | $0 | $0 | $0 | $0 | $0 | $0 | |
| Subtotal | $4,000 | $4,000 | $4,000 | $4,000 | $4,000 | $4,000 | $4,000 | $4,000 | $4,000 | $4,000 | $4,000 | $4,000 | |
| Other Personnel | |||||||||||||
| Name or title | $0 | $0 | $0 | $0 | $0 | $0 | $0 | $0 | $0 | $0 | $0 | $0 | |
| Other | $0 | $0 | $0 | $0 | $0 | $0 | $0 | $0 | $0 | $0 | $0 | $0 | |
| Subtotal | $0 | $0 | $0 | $0 | $0 | $0 | $0 | $0 | $0 | $0 | $0 | $0 | |
| Total People | 0 | 0 | 0 | 0 | 0 | 0 | 0 | 0 | 0 | 0 | 0 | 0 | |
| Total Payroll | $8,838 | $8,838 | $8,838 | $8,838 | $8,838 | $8,838 | $8,838 | $8,838 | $8,838 | $8,838 | $8,838 | $8,838 | |
| General Assumptions | |||||||||||||
| Month 1 | Month 2 | Month 3 | Month 4 | Month 5 | Month 6 | Month 7 | Month 8 | Month 9 | Month 10 | Month 11 | Month 12 | ||
| Plan Month | 1 | 2 | 3 | 4 | 5 | 6 | 7 | 8 | 9 | 10 | 11 | 12 | |
| Current Interest Rate | 10.00% | 10.00% | 10.00% | 10.00% | 10.00% | 10.00% | 10.00% | 10.00% | 10.00% | 10.00% | 10.00% | 10.00% | |
| Long-term Interest Rate | 10.00% | 10.00% | 10.00% | 10.00% | 10.00% | 10.00% | 10.00% | 10.00% | 10.00% | 10.00% | 10.00% | 10.00% | |
| Tax Rate | 30.00% | 25.00% | 25.00% | 25.00% | 25.00% | 25.00% | 25.00% | 25.00% | 25.00% | 25.00% | 25.00% | 25.00% | |
| Other | 0 | 0 | 0 | 0 | 0 | 0 | 0 | 0 | 0 | 0 | 0 | 0 | |
| Pro Forma Profit and Loss | |||||||||||||
| Month 1 | Month 2 | Month 3 | Month 4 | Month 5 | Month 6 | Month 7 | Month 8 | Month 9 | Month 10 | Month 11 | Month 12 | ||
| Sales | $18,259 | $20,085 | $22,093 | $24,303 | $26,733 | $29,406 | $32,347 | $35,582 | $39,140 | $43,054 | $47,359 | $52,095 | |
| Direct Cost of Sales | $4,091 | $4,500 | $4,950 | $5,445 | $5,989 | $6,588 | $7,247 | $7,972 | $8,769 | $9,646 | $10,610 | $11,671 | |
| Production Payroll | $4,838 | $4,838 | $4,838 | $4,838 | $4,838 | $4,838 | $4,838 | $4,838 | $4,838 | $4,838 | $4,838 | $4,838 | |
| Other | $2,000 | $2,000 | $2,000 | $2,000 | $2,000 | $2,000 | $2,000 | $2,000 | $2,000 | $2,000 | $2,000 | $2,000 | |
| Total Cost of Sales | $10,929 | $11,338 | $11,788 | $12,283 | $12,827 | $13,426 | $14,085 | $14,810 | $15,607 | $16,484 | $17,448 | $18,509 | |
| Gross Margin | $7,330 | $8,747 | $10,306 | $12,020 | $13,906 | $15,980 | $18,262 | $20,772 | $23,533 | $26,570 | $29,911 | $33,586 | |
| Gross Margin % | 40.15% | 43.55% | 46.65% | 49.46% | 52.02% | 54.34% | 56.46% | 58.38% | 60.13% | 61.71% | 63.16% | 64.47% | |
| Operating Expenses | |||||||||||||
| Sales and Marketing Expenses | |||||||||||||
| Sales and Marketing Payroll | $0 | $0 | $0 | $0 | $0 | $0 | $0 | $0 | $0 | $0 | $0 | $0 | |
| Advertising/Promotion | $5,000 | $4,000 | $3,000 | $3,000 | $3,000 | $3,000 | $3,000 | $3,000 | $3,000 | $3,000 | $3,000 | $3,000 | |
| Miscellaneous | $500 | $500 | $500 | $500 | $500 | $500 | $500 | $500 | $500 | $500 | $500 | $500 | |
| Total Sales and Marketing Expenses | $5,500 | $4,500 | $3,500 | $3,500 | $3,500 | $3,500 | $3,500 | $3,500 | $3,500 | $3,500 | $3,500 | $3,500 | |
| Sales and Marketing % | 30.12% | 22.40% | 15.84% | 14.40% | 13.09% | 11.90% | 10.82% | 9.84% | 8.94% | 8.13% | 7.39% | 6.72% | |
| General and Administrative Expenses | |||||||||||||
| General and Administrative Payroll | $4,000 | $4,000 | $4,000 | $4,000 | $4,000 | $4,000 | $4,000 | $4,000 | $4,000 | $4,000 | $4,000 | $4,000 | |
| Sales and Marketing and Other Expenses | $0 | $0 | $0 | $0 | $0 | $0 | $0 | $0 | $0 | $0 | $0 | $0 | |
| Depreciation | $0 | $0 | $0 | $0 | $0 | $0 | $0 | $0 | $0 | $0 | $0 | $0 | |
| Leased Equipment | $0 | $0 | $0 | $0 | $0 | $0 | $0 | $0 | $0 | $0 | $0 | $0 | |
| Utilities | $750 | $750 | $750 | $750 | $750 | $750 | $750 | $750 | $750 | $750 | $750 | $750 | |
| Insurance | $700 | $700 | $700 | $700 | $700 | $700 | $700 | $700 | $700 | $700 | $700 | $700 | |
| Rent | $1,500 | $1,500 | $1,500 | $1,500 | $1,500 | $1,500 | $1,500 | $1,500 | $1,500 | $1,500 | $1,500 | $1,500 | |
| Payroll Taxes | 15% | $1,326 | $1,326 | $1,326 | $1,326 | $1,326 | $1,326 | $1,326 | $1,326 | $1,326 | $1,326 | $1,326 | $1,326 |
| Other General and Administrative Expenses | $0 | $0 | $0 | $0 | $0 | $0 | $0 | $0 | $0 | $0 | $0 | $0 | |
| Total General and Administrative Expenses | $8,276 | $8,276 | $8,276 | $8,276 | $8,276 | $8,276 | $8,276 | $8,276 | $8,276 | $8,276 | $8,276 | $8,276 | |
| General and Administrative % | 45.32% | 41.20% | 37.46% | 34.05% | 30.96% | 28.14% | 25.58% | 23.26% | 21.14% | 19.22% | 17.47% | 15.89% | |
| Other Expenses: | |||||||||||||
| Other Payroll | $0 | $0 | $0 | $0 | $0 | $0 | $0 | $0 | $0 | $0 | $0 | $0 | |
| Consultants | $0 | $0 | $0 | $0 | $0 | $0 | $0 | $0 | $0 | $0 | $0 | $0 | |
| Contract/Consultants | $1,000 | $1,000 | $0 | $0 | $0 | $0 | $0 | $0 | $0 | $0 | $0 | $0 | |
| Total Other Expenses | $1,000 | $1,000 | $0 | $0 | $0 | $0 | $0 | $0 | $0 | $0 | $0 | $0 | |
| Other % | 5.48% | 4.98% | 0.00% | 0.00% | 0.00% | 0.00% | 0.00% | 0.00% | 0.00% | 0.00% | 0.00% | 0.00% | |
| Total Operating Expenses | $14,776 | $13,776 | $11,776 | $11,776 | $11,776 | $11,776 | $11,776 | $11,776 | $11,776 | $11,776 | $11,776 | $11,776 | |
| Profit Before Interest and Taxes | ($7,445) | ($5,029) | ($1,470) | $244 | $2,130 | $4,204 | $6,486 | $8,996 | $11,757 | $14,794 | $18,135 | $21,810 | |
| EBITDA | ($7,445) | ($5,029) | ($1,470) | $244 | $2,130 | $4,204 | $6,486 | $8,996 | $11,757 | $14,794 | $18,135 | $21,810 | |
| Interest Expense | $0 | $0 | $0 | $0 | $17 | $17 | $17 | $8 | $8 | $8 | $0 | $0 | |
| Taxes Incurred | ($2,234) | ($1,257) | ($368) | $61 | $528 | $1,047 | $1,617 | $2,247 | $2,937 | $3,696 | $4,534 | $5,452 | |
| Net Profit | ($5,212) | ($3,771) | ($1,103) | $183 | $1,585 | $3,141 | $4,852 | $6,741 | $8,812 | $11,089 | $13,601 | $16,357 | |
| Net Profit/Sales | -28.54% | -18.78% | -4.99% | 0.75% | 5.93% | 10.68% | 15.00% | 18.94% | 22.51% | 25.76% | 28.72% | 31.40% | |
| Pro Forma Cash Flow | |||||||||||||
| Month 1 | Month 2 | Month 3 | Month 4 | Month 5 | Month 6 | Month 7 | Month 8 | Month 9 | Month 10 | Month 11 | Month 12 | ||
| Cash Received | |||||||||||||
| Cash from Operations | |||||||||||||
| Cash Sales | $18,259 | $20,085 | $22,093 | $24,303 | $26,733 | $29,406 | $32,347 | $35,582 | $39,140 | $43,054 | $47,359 | $52,095 | |
| Subtotal Cash from Operations | $18,259 | $20,085 | $22,093 | $24,303 | $26,733 | $29,406 | $32,347 | $35,582 | $39,140 | $43,054 | $47,359 | $52,095 | |
| Additional Cash Received | |||||||||||||
| Sales Tax, VAT, HST/GST Received | 0.00% | $0 | $0 | $0 | $0 | $0 | $0 | $0 | $0 | $0 | $0 | $0 | $0 |
| New Current Borrowing | $0 | $0 | $0 | $0 | $2,000 | $0 | $0 | $0 | $0 | $0 | $0 | $0 | |
| New Other Liabilities (interest-free) | $0 | $0 | $0 | $0 | $0 | $0 | $0 | $0 | $0 | $0 | $0 | $0 | |
| New Long-term Liabilities | $0 | $0 | $0 | $0 | $0 | $0 | $0 | $0 | $0 | $0 | $0 | $0 | |
| Sales of Other Current Assets | $0 | $0 | $0 | $0 | $0 | $0 | $0 | $0 | $0 | $0 | $0 | $0 | |
| Sales of Long-term Assets | $0 | $0 | $0 | $0 | $0 | $0 | $0 | $0 | $0 | $0 | $0 | $0 | |
| New Investment Received | $0 | $0 | $0 | $3,000 | $0 | $0 | $0 | $0 | $0 | $0 | $0 | $0 | |
| Subtotal Cash Received | $18,259 | $20,085 | $22,093 | $27,303 | $28,733 | $29,406 | $32,347 | $35,582 | $39,140 | $43,054 | $47,359 | $52,095 | |
| Expenditures | Month 1 | Month 2 | Month 3 | Month 4 | Month 5 | Month 6 | Month 7 | Month 8 | Month 9 | Month 10 | Month 11 | Month 12 | |
| Expenditures from Operations | |||||||||||||
| Cash Spending | $8,838 | $8,838 | $8,838 | $8,838 | $8,838 | $8,838 | $8,838 | $8,838 | $8,838 | $8,838 | $8,838 | $8,838 | |
| Bill Payments | $595 | $17,773 | $15,448 | $14,885 | $15,862 | $16,948 | $18,130 | $19,429 | $20,852 | $22,425 | $24,154 | $26,050 | |
| Subtotal Spent on Operations | $9,433 | $26,611 | $24,286 | $23,723 | $24,700 | $25,786 | $26,968 | $28,267 | $29,690 | $31,263 | $32,992 | $34,888 | |
| Additional Cash Spent | |||||||||||||
| Sales Tax, VAT, HST/GST Paid Out | $0 | $0 | $0 | $0 | $0 | $0 | $0 | $0 | $0 | $0 | $0 | $0 | |
| Principal Repayment of Current Borrowing | $0 | $0 | $0 | $0 | $0 | $0 | $0 | $1,000 | $0 | $0 | $1,000 | $0 | |
| Other Liabilities Principal Repayment | $0 | $0 | $0 | $0 | $0 | $0 | $0 | $0 | $0 | $0 | $0 | $0 | |
| Long-term Liabilities Principal Repayment | $0 | $0 | $0 | $0 | $0 | $0 | $0 | $0 | $0 | $0 | $0 | $0 | |
| Purchase Other Current Assets | $5,000 | $0 | $0 | $5,000 | $0 | $0 | $0 | $20,000 | $0 | $0 | $20,000 | $0 | |
| Purchase Long-term Assets | $0 | $0 | $0 | $0 | $0 | $0 | $0 | $0 | $0 | $0 | $0 | $0 | |
| Dividends | $0 | $0 | $0 | $0 | $0 | $0 | $0 | $0 | $0 | $0 | $0 | $0 | |
| Subtotal Cash Spent | $14,433 | $26,611 | $24,286 | $28,723 | $24,700 | $25,786 | $26,968 | $49,267 | $29,690 | $31,263 | $53,992 | $34,888 | |
| Net Cash Flow | $3,826 | ($6,526) | ($2,192) | ($1,421) | $4,033 | $3,620 | $5,379 | ($13,685) | $9,450 | $11,791 | ($6,633) | $17,207 | |
| Cash Balance | $11,746 | $5,220 | $3,027 | $1,606 | $5,639 | $9,260 | $14,639 | $954 | $10,403 | $22,195 | $15,562 | $32,769 | |
| Pro Forma Balance Sheet | |||||||||||||
| Month 1 | Month 2 | Month 3 | Month 4 | Month 5 | Month 6 | Month 7 | Month 8 | Month 9 | Month 10 | Month 11 | Month 12 | ||
| Assets | Starting Balances | ||||||||||||
| Current Assets | |||||||||||||
| Cash | $7,920 | $11,746 | $5,220 | $3,027 | $1,606 | $5,639 | $9,260 | $14,639 | $954 | $10,403 | $22,195 | $15,562 | $32,769 |
| Inventory | $1,280 | $4,500 | $4,950 | $5,445 | $5,989 | $6,588 | $7,247 | $7,972 | $8,769 | $9,646 | $10,610 | $11,671 | $12,839 |
| Other Current Assets | $0 | $5,000 | $5,000 | $5,000 | $10,000 | $10,000 | $10,000 | $10,000 | $30,000 | $30,000 | $30,000 | $50,000 | $50,000 |
| Total Current Assets | $9,200 | $21,246 | $15,169 | $13,472 | $17,596 | $22,228 | $26,507 | $32,611 | $39,723 | $50,049 | $62,805 | $77,233 | $95,607 |
| Long-term Assets | |||||||||||||
| Long-term Assets | $0 | $0 | $0 | $0 | $0 | $0 | $0 | $0 | $0 | $0 | $0 | $0 | $0 |
| Accumulated Depreciation | $0 | $0 | $0 | $0 | $0 | $0 | $0 | $0 | $0 | $0 | $0 | $0 | $0 |
| Total Long-term Assets | $0 | $0 | $0 | $0 | $0 | $0 | $0 | $0 | $0 | $0 | $0 | $0 | $0 |
| Total Assets | $9,200 | $21,246 | $15,169 | $13,472 | $17,596 | $22,228 | $26,507 | $32,611 | $39,723 | $50,049 | $62,805 | $77,233 | $95,607 |
| Liabilities and Capital | Month 1 | Month 2 | Month 3 | Month 4 | Month 5 | Month 6 | Month 7 | Month 8 | Month 9 | Month 10 | Month 11 | Month 12 | |
| Current Liabilities | |||||||||||||
| Accounts Payable | $0 | $17,258 | $14,953 | $14,358 | $15,299 | $16,345 | $17,483 | $18,735 | $20,107 | $21,621 | $23,288 | $25,115 | $27,131 |
| Current Borrowing | $0 | $0 | $0 | $0 | $0 | $2,000 | $2,000 | $2,000 | $1,000 | $1,000 | $1,000 | $0 | $0 |
| Other Current Liabilities | $0 | $0 | $0 | $0 | $0 | $0 | $0 | $0 | $0 | $0 | $0 | $0 | $0 |
| Subtotal Current Liabilities | $0 | $17,258 | $14,953 | $14,358 | $15,299 | $18,345 | $19,483 | $20,735 | $21,107 | $22,621 | $24,288 | $25,115 | $27,131 |
| Long-term Liabilities | $0 | $0 | $0 | $0 | $0 | $0 | $0 | $0 | $0 | $0 | $0 | $0 | $0 |
| Total Liabilities | $0 | $17,258 | $14,953 | $14,358 | $15,299 | $18,345 | $19,483 | $20,735 | $21,107 | $22,621 | $24,288 | $25,115 | $27,131 |
| Paid-in Capital | $75,000 | $75,000 | $75,000 | $75,000 | $78,000 | $78,000 | $78,000 | $78,000 | $78,000 | $78,000 | $78,000 | $78,000 | $78,000 |
| Retained Earnings | ($65,800) | ($65,800) | ($65,800) | ($65,800) | ($65,800) | ($65,800) | ($65,800) | ($65,800) | ($65,800) | ($65,800) | ($65,800) | ($65,800) | ($65,800) |
| Earnings | $0 | ($5,212) | ($8,983) | ($10,086) | ($9,903) | ($8,318) | ($5,177) | ($325) | $6,416 | $15,228 | $26,317 | $39,919 | $56,276 |
| Total Capital | $9,200 | $3,988 | $217 | ($886) | $2,297 | $3,882 | $7,023 | $11,875 | $18,616 | $27,428 | $38,517 | $52,119 | $68,476 |
| Total Liabilities and Capital | $9,200 | $21,246 | $15,169 | $13,472 | $17,596 | $22,228 | $26,507 | $32,611 | $39,723 | $50,049 | $62,805 | $77,233 | $95,607 |
| Net Worth | $9,200 | $3,988 | $217 | ($886) | $2,297 | $3,882 | $7,023 | $11,875 | $18,616 | $27,428 | $38,517 | $52,119 | $68,476 |

