
La Salsa Fresh Mexican Grill
Executive Summary
This business plan was created to secure investors. La Salsa Fresh Mexican Grill is one of the hottest franchises to team up with and offers enormous potential in Oregon. Currently, La Salsa is in all of the neighboring states of Oregon and is still expanding. The Santa Barbara Restaurant Group (SBRG) franchises the La Salsa chain.
There are two main reasons that La Salsa will succeed in Eugene: first is the lack of direct competition (nothing like it in town), the second is the high demand for a product like this in Eugene. Eugene is in preparation for a large population growth period, the current population of the greater Eugene/ Springfield metro area is over 300,000 according to Census 2000 and expanding.
The creation of a Limited Liability Corporation (LLC) will shield owners and investors from personal liability. Over the next three years Benjamin D. Strock plans to expand La Salsa in Oregon, developing between 3 to 10 restaurants under the LLC. This business plan only includes the first store plans which will help create more concrete goals. Per store revenues for La Salsa range between $400,000 to $1,000,000 depending heavily on location. Estimated start-up costs from SBRG are between $300,000 and $400,000, and require an initial investment of around $600,000. Half of this money will be financed by a small business loan, and the other half will come from private investors. Net profits will be high, yielding an estimated $85,000 a year per store (possibly much more).
The franchisor, SBRG will control most of pricing, training, building and advertising in exchange for between 8% and 10% of gross sales. Hopefully, the first La Salsa in Oregon will be built and running within three months of the initial financing assuming that a location has been agreed upon by franchisor, franchisee and investors.
1.1 Mission
La Salsa Fresh Mexican Grill will establish itself as the premier casual Mexican dining restaurant in Eugene while maintaining uncompromising principles as we grow to more than three restaurants. The six following guiding principles will help us measure the appropriateness of our decisions.
- Provide a great work environment and treat employees with dignity and respect.
- Embrace diversity as an essential component in the way that we do business.
- Apply the highest standards of excellence to the food production, preparation, and service to our customers.
- Build lasting relationships with the guests.
- Contribute positively to communities and our environment.
- Recognize that profitability is essential to our future success.

1.2 Objectives
- Set up a LLC to limit investor and personal liability.
- Complete construction less than three months after financing.
- Reach positive net profit in first quarter.
- Become a market leader in Eugene.
- Average $60,000 plus in revenues monthly.
- Increase annual sales between 3-7%.
1.3 Keys to Success
- Location, Location, Location.
- Obtaining bank financing at reasonable interest rates, and securing individual investors.
- Finding and hiring qualified motivated employees.
- Controlling the effective use of marketing dollars to stimulate sales.
- Providing extraordinary food with unparalleled taste.
Company Summary
The parent company claims that,
“La Salsa is one of the fastest growing fresh Mexican chains nationwide. The hallmark to our fresh style is our unique open-display kitchen, where customers can enjoy seeing their food prepared right in front of their eyes.
We are also famous for our one-of-a-kind fresh Salsa Bar, where we encourage guests to customize their salsa…selecting a range of flavors from hot and wild to robust, yet mild. We never use microwaves, can openers, or lard. And signature to La Salsa’s superior taste is charbroiled cooking with skinless, all white-meat chicken, tender steak, big succulent shrimp and flavorful Mahi Mahi. Popular menu items include gourmet burritos, handcrafted tacos and veggie specialties. It’s a high-quality menu with a fresh attitude that’s made La Salsa a West Coast favorite since 1979.”
2.1 Company Ownership
A Limited Liability Corporation (LLC) will be formed to limit personal liability of the owner and investors in La Salsa. Once the LLC is formed its first holding will be in franchising La Salsa. It is Benjamin D. Strock’s intention to offer limited outside ownership in the LLC on an equity, debt, or combination basis in order to facilitate a more rapid expansion of the La Salsa concept. A 12% priority return will be offered to all shareholders on their investment. Benjamin D. Strock will be the managing shareholder of the corporation.
2.2 Start-up Summary
The Santa Barbara Restaurant Group, owners of the La Salsa chain, have estimated overall start-up costs between $300,000 to $400,000. The numbers in the start-up cost table are meant to reflect these estimates. The allocation into each category may not be exact, but the approximate costs have been estimated slightly higher than those of the Santa Barbara Restaurant Group. Overestimated costs will leave room for miscalculations, so that funding will be available and will ensure that everything runs smoothly.

| Start-up | |
| Requirements | |
| Start-up Expenses | |
| Legal | $5,000 |
| Stationery etc. | $2,000 |
| Brochures | $1,000 |
| Franchise Fee | $20,000 |
| Insurance | $1,000 |
| Rent | $5,000 |
| Development Fee | $10,000 |
| Expensed Equipment | $17,000 |
| Other | $100,000 |
| Total Start-up Expenses | $161,000 |
| Start-up Assets | |
| Cash Required | $102,000 |
| Start-up Inventory | $50,000 |
| Other Current Assets | $0 |
| Long-term Assets | $287,000 |
| Total Assets | $439,000 |
| Total Requirements | $600,000 |
| Start-up Funding | |
| Start-up Expenses to Fund | $161,000 |
| Start-up Assets to Fund | $439,000 |
| Total Funding Required | $600,000 |
| Assets | |
| Non-cash Assets from Start-up | $337,000 |
| Cash Requirements from Start-up | $102,000 |
| Additional Cash Raised | $0 |
| Cash Balance on Starting Date | $102,000 |
| Total Assets | $439,000 |
| Liabilities and Capital | |
| Liabilities | |
| Current Borrowing | $0 |
| Long-term Liabilities | $300,000 |
| Accounts Payable (Outstanding Bills) | $0 |
| Other Current Liabilities (interest-free) | $0 |
| Total Liabilities | $300,000 |
| Capital | |
| Planned Investment | |
| Richard & Ginny Strock | $100,000 |
| Benjamin D. Strock | $20,000 |
| Investor 3 | $80,000 |
| Investor 4 | $100,000 |
| Additional Investment Requirement | $0 |
| Total Planned Investment | $300,000 |
| Loss at Start-up (Start-up Expenses) | ($161,000) |
| Total Capital | $139,000 |
| Total Capital and Liabilities | $439,000 |
| Total Funding | $600,000 |
2.3 Company Locations and Facilities
The first option for location is close to Sacred Heart Hospital on 13th Avenue in Eugene, Oregon. This location will be important because the University of Oregon campus is close, as is the hospital. Students and hospital employees will have a new lunch spot which is much needed. The best location currently available is next to the Napoli Restaurant & Bakery, but it is only 800 square feet. In order to make this location feasible a partial/full buyout of Napoli Bakery is desirable. The bakery is not overly successful and will hopefully be cooperative in this process.
If the first restaurant is not located on 13th Ave. there are a few high traffic strip mall locations available. Located on the corner of 18th Ave. and Willamette Street, next to a mini-mall, Blockbuster Video, Little Caesar’s Pizza, and Hong Kong Chinese restaurant. South Eugene High School (open campus) is also very close by. There are 1367 square feet available, plenty of parking, high traffic and high visibility. This location rents for $970 a month, and appears to have excellent profit potential. Traffic counts from 1997 were approximately 15,000 for each direction on 18th Ave., and 11,000 one way on Willamette St. Overall revenues would most likely stay consistent with 13th Ave. location, but it is conceivable that without the effect of demand decline during the summer months next to University of Oregon, overall revenues could be substantially higher in this location.
As the company gains community recognition La Salsa will expand to one or both of the neighboring shopping malls (Valley River Center or Gateway). Once the Eugene/ Springfield market is developed expansion to other Oregon cities-on-the-rise such as Corvallis, Bend, Medford, or Ashland is anticipated. Portland is not a strong candidate considering competition is already fierce in that region.

Market Analysis Summary
Market segmentation is described in the next section.
3.1 Market Segmentation
The 2000 Census of Eugene/ Springfield says there are currently over 300,000 people populating this metropolitan area. Using basic demographic characteristics of age, gender, income, location, food preferences, ethnicity, an estimate of 150,000 potential customers was used in developing this plan.
The University of Oregon was established in 1876, and currently has over 20,000 students. It is expected to gradually increase in size as it has over the previous years.
Across the street from the University is Sacred Heart Hospital, which currently employs over 3,500 people (according to a hospital information representative) though it is likely moving to North Eugene in the near future. If this happens the current hospital will remain open only as an emergency room. This move and change will take time, hence the growth rate is listed as -50%.
Both of the proposed initial locations are close to university student residential areas. At the 18th Ave. and Willamette St. location high school students might be substituted for Sacred Heart Hospital employees as a source of mid-day customers. South Eugene High School has over 1,500 students.

| Market Analysis | |||||||
| Year 1 | Year 2 | Year 3 | Year 4 | Year 5 | |||
| Potential Customers | Growth | CAGR | |||||
| Eugene/ Springfield | 3% | 150,000 | 154,500 | 159,135 | 163,909 | 168,826 | 3.00% |
| University of Oregon | 3% | 20,000 | 20,600 | 21,218 | 21,855 | 22,511 | 3.00% |
| Sacred Heart Hospital | -50% | 3,500 | 1,750 | 875 | 438 | 219 | -49.99% |
| South Eugene High School | 2% | 1,500 | 1,523 | 1,546 | 1,569 | 1,593 | 1.52% |
| Total | 2.50% | 175,000 | 178,373 | 182,774 | 187,771 | 193,149 | 2.50% |
3.2 Target Market Segment Strategy
The target market for the quick casual dining industry is very broad and should incorporate most demographic regions. Almost all ages, genders, races, and incomes should be considered potential customers.
3.2.1 Market Trends
Eugene is a rapidly developing city and is building the infrastructure for a larger metropolitan area. Currently, in this expansionary effort, Eugene is working on the following projects….
- Building a new public library near the city center.
- Broadway St. is being renovated and reopened to traffic.
- A new Federal Courthouse in is being built adjacent to downtown.
- Low-income housing covering five square city blocks in downtown has been recently funded by St. Vincent DePaul.
- The highway off-ramps to Eugene have recently been earmarked to be renovated at an estimated $88 million.
- The University of Oregon is spending between $80 and $100 million on additions to the football stadium.
Projects such as these are promising for the future of Eugene and show that the city is preparing for expansionary times.
3.2.2 Market Needs
In Eugene there are no high-quality, quick food Mexican restaurants. Most local Mexican restaurants use canned foods, lard, and shredded meats. Our food will be 100% fresh prepared in front of our customers’ eyes. Our salsa bar will allow customers to customize their food to their specific tastes.
3.3 Main Competitors
Quick Service Mexican-
Burrito Boy– This is probably the most popular quick Mexican restaurant in town. We will offer much higher food quality and service. The atmosphere will be much cleaner and more comfortable. The food will be prepared in front of the customer, with no lard, canned food or shredded meats. Menu prices will be very similar, though the final products will not be.
Santa Fe Burrito– Located on Willamette St. between 25th and 26th Avenues, Santa Fe Burrito is another low quality quick Mexican restaurant in Eugene. This store is very dirty and is an old Taco Bell. Using canned foods and some lard products, this restaurant provides a far-from-fresh feeling. They have a decent location that might be negotiable for buyout, thereby eliminating a weak competitor and picking up a pretty good location.
Burrito Amigos– Not located near the university campus, this chain has been trying to expand. Currently, they have three or more stores. They create, almost, the taco stand feeling. Again there would be no comparison in quality of food. Though they will probably continue to attract the traditional style Mexican food consumer. Alternatively, La Salsa’s food could almost be considered “gringo” Mexican food.
Ritta’s Burritos– These folks started out with one mobile stand and did some catering business, then opened a full-time store in Eugene, but this Mama and Papa business could not cover costs. Currently they set up a stand on the University of Oregon campus once a week, and during the summer they are located at the Saturday Market and do very well. They always have a really long line, but one is left to wonder if that is because there is no real competition in this area. Once again using shredded meats and some canned foods.
Las Brasas– Las Brasas is located on Blair Street a few miles away from campus. From the outside Las Brasas looks really small and could be confused as a taco stand. People like their food, but due to location and size, they are not likely to be a competitive threat to La Salsa.
Other Quick Service Mexican-
La Salsa will most likely not be a direct competitor with drive-thru fast-food Mexican restaurants like Taco Bell and Taco Time. The chicken, steak, shrimp, and Mahi Mahi will all be prepared fresh in front of the customers. Quality of produce will be much higher as will the atmosphere, so consequently the menu price range will be higher than fast-food, matching the dietary needs and gastronomical expectations of the potential customer. We will offer a completely different menu and should not be compared to traditional fast-food Mexican.
Sit-Down Mexican-
La Salsa with its fresh and extraordinary taste will offer menu items at a fraction of the cost of sit-down dining (perhaps 20%-50% cheaper). There will also be no charge for service that usually comes with being waited on. Another important difference is the quick service without compromising high quality food.
Strategy and Implementation Summary
4.1 Marketing Strategy
Advertising costs can overwhelm a new business, so keeping marketing simple and creative will be challenging. Cost effective marketing is one of our keys to success, and fortunately a large portion of it will be taken care of by Santa Barbara Restaurant Group.
A combination of local media and event marketing will be utilized at each location. Radio is most effective, followed by local print media. When the La Salsa construction in Eugene is finished, broader media will be employed. Print media, radio and college events advertising will be the most effective way of generating publicity.
The following are a list of possible places to advertise with:
Qwest Eugene/ Springfield Yellow Pages Pricing-
Customer Service
1/8 page-$258.50/ month Black/ White and $402/ month Color
1/4 page-$507/ month Black/ White and $740/ month Color
1/2 page-$986/ month Black/ White and $1501/ month Color
Register-Guard Newspaper-
Contact: Dave
An advertisement 2 columns wide once a week runs for $57.02 on weekdays and $62.44 each weekend day.
They offer a “Restaurant Special”- 13 weeks with one ad per week, including ad on Register-Guard website, directory listing, voice message listing, and is included in the non-subscriber paper touching nearly all of Eugene/ Springfield.
AT&T Cable Television Advertising-
Contact: Kristi
A wide variety of pricing options are available, cable advertising is a proven good way to reach potential customers.
Clear Channel Broadcasting KPNW-KODZ-KDUK
Contact: Kim
Clear Channel Broadcasting owns news radio, oldies, and new rock stations in Eugene/ Springfield and offers many advertising plans. The price range seems to be between $850-$1500 per month for between 40 and 80 time slots.
4.1.1 Pricing Strategy
All menu items are moderately priced. An typical customer will spend between $5-8 including food and drink. The menu prices are dictated by the Santa Barbara Restaurant Group and there is little room for modification. A student discount might be offered.
4.1.2 Promotion Strategy
If the site location ends up being near 13th Ave. next to the University of Oregon campus, advertising close to and on campus would be very appropriate. This is an area with limited parking where most of the traffic will come by foot. It will be very important to gain recognition from students and hospital employees. Promotional events close to campus, at sporting events, in the dormitories, and through the campus newspaper will tremendously increase sales.
On the other hand, if the store has a high traffic location with ample parking more traditional forms of restaurant promotion and advertising will be used.
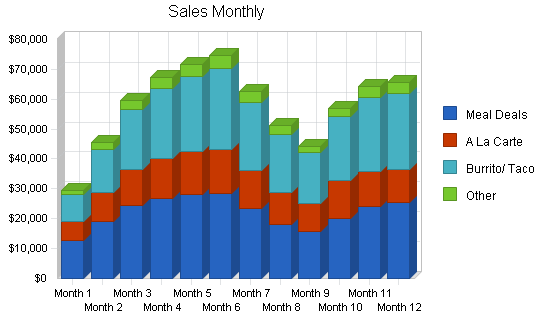
4.2 Sales Forecast
Supplies in the restaurant industry, particularly fresh produce and meats and seafood, are constantly subject to changes in the prices, so, while we attempt to maintain consistency, menu prices are also subject to change. The sales forecasts start out at a moderate level and build until the end of the school year where we hope to have the strongest sales. Due to location (by campus) it is probable that sales will see a sharp decline during the summer months (off months). As students begin to come back to school again in the middle of September the sales will pick up again. If the proper location is found the sales may not decrease as much as expected, because if parking is available we could appeal to a larger market. If it is not located near campus the sales might be more consistent, but it would yield close to the same in revenues.
The location next to Blockbuster Video Rental and Little Caesar’s Pizza would offer a chance of more consistent sales and rental costs could also be considerably cut. This is a high traffic location next to a wealthy residential neighborhood. It would be nice to compensate for the sales decline during the summer months next to campus. This location offers a lot of possibilities.
Two La Salsa franchisees who have provided helpful information on their sales revenues. One, located in Phoenix, Arizona, said that he has a lot competition in town (Quedoba, Chipotle’s, Baja Fresh, etc.). His rough sales were at a very similar level as predicted in the Sales Forecast table. The numbers used seem to be consistent with experience in this industry.
In Eugene, the strongest competitors have not arrived in town yet. If La Salsa is established first it will gain the loyalty of the community, and sales could be considerably higher than those predicted in the Sales Forecast Table.

| Sales Forecast | |||
| Year 1 | Year 2 | Year 3 | |
| Sales | |||
| Meal Deals | $266,169 | $284,801 | $304,737 |
| A La Carte | $139,720 | $149,500 | $159,965 |
| Burrito/ Taco | $249,068 | $266,503 | $285,158 |
| Other | $37,151 | $39,752 | $42,534 |
| Total Sales | $692,108 | $740,556 | $792,394 |
| Direct Cost of Sales | Year 1 | Year 2 | Year 3 |
| Meal Deals | $69,204 | $74,048 | $79,232 |
| A La Carte | $29,341 | $31,395 | $33,593 |
| Burrito/ Taco | $77,211 | $82,616 | $88,399 |
| Other | $6,316 | $6,758 | $7,231 |
| Subtotal Direct Cost of Sales | $182,072 | $194,817 | $208,454 |
Management Summary
Benjamin D. Strock will run all business operations for La Salsa Fresh Mexican Grill, except for the final accounting which will be reviewed by an accounting professional monthly.
Other key personnel are the day to day manager and cooks. There is not expected to be any shortage of qualified and available staff and management from local labor pools in each market area.
5.1 Organizational Structure
Benjamin D. Strock will be in charge of store operations. Each store will have a general manager who oversees the day to day operation of their store. They will be rewarded by incremental profit sharing. It will be in their best interest to see that things run properly.
Future organizational structure may include a director of store operations when store locations exceed three and/or we expand to other Oregon cities. This will provide a supervisory level between the executive level and the store management level.
At that juncture, a full-time accountant will need to be added. Also, a sales/marketing director will be added to oversee the expansion effort both to support the growth of existing business and to execute the franchise expansion strategy.
5.2 Management Team
BENJAMIN D. STROCK
[Personal and Confidential information removed.]
5.3 Personnel Plan
When you walk into the typical La Salsa, there is one cashier (usually the manager) and two or three cooks working at all times. Depending on the volume of sales more cooks might be needed. This is estimated into the personnel plan under Other.
At first there will not be a marketing manager, and Benjamin D. Strock will take care of this. As we grow the need for a marketing representative will be higher.
Benjamin D. Strock will receive $3,000 dollars a month for management of the first restaurants. When profits begin to rise, as owner and recipient of a percentage of profits, he may no longer be included on the payroll.
| Personnel Plan | |||
| Year 1 | Year 2 | Year 3 | |
| Production Personnel | |||
| Manager | $36,417 | $37,508 | $38,633 |
| Cooks (3) | $58,264 | $60,013 | $61,813 |
| Other | $34,417 | $35,448 | $36,512 |
| Subtotal | $129,098 | $132,969 | $136,958 |
| Sales and Marketing Personnel | |||
| Marketing | $12,168 | $12,531 | $12,907 |
| Other | $0 | $0 | $0 |
| Subtotal | $12,168 | $12,531 | $12,907 |
| General and Administrative Personnel | |||
| Benjamin Strock | $36,501 | $37,594 | $38,722 |
| Accountant | $12,140 | $12,503 | $12,878 |
| Other | $0 | $0 | $0 |
| Subtotal | $48,641 | $50,097 | $51,600 |
| Other Personnel | |||
| Name or Title | $0 | $0 | $0 |
| Other | $0 | $0 | $0 |
| Subtotal | $0 | $0 | $0 |
| Total People | 0 | 0 | 0 |
| Total Payroll | $189,907 | $195,597 | $201,465 |
Financial Plan
6.1 Important Assumptions
The financial plan depends on important assumptions, most of which are shown in the following table. The key underlying assumptions are:
- We assume that the economy gets back on its feet and returns to ‘normal’, after the current recession.
- We assume access to equity capital and financing sufficient to maintain our financial plan as shown in the tables.
| General Assumptions | |||
| Year 1 | Year 2 | Year 3 | |
| Plan Month | 1 | 2 | 3 |
| Current Interest Rate | 10.00% | 10.00% | 10.00% |
| Long-term Interest Rate | 7.00% | 7.00% | 7.00% |
| Tax Rate | 30.00% | 30.00% | 30.00% |
| Other | 0 | 0 | 0 |
6.2 Break-even Analysis
The break-even analysis is based on planned fixed costs estimates.

| Break-even Analysis | |
| Monthly Revenue Break-even | $20,895 |
| Assumptions: | |
| Average Percent Variable Cost | 26% |
| Estimated Monthly Fixed Cost | $15,398 |
6.3 Projected Profit and Loss
In order not to underestimate costs, costs listed are considerably higher than what will most likely be experienced. This makes the profits and margins appear less attractive, but realize there are many ways to cut costs.
The Santa Barbara Restaurant Group requires royalties of 4% of gross sales to cover national and local advertising costs. This is included in the Profit/Loss table under Corporate Marketing Fee. The Franchise Fee is 6% of gross sales and is labeled Franchise Fee on the Profit/Loss table.


| Pro Forma Profit and Loss | |||
| Year 1 | Year 2 | Year 3 | |
| Sales | $692,108 | $740,556 | $792,394 |
| Direct Cost of Sales | $182,072 | $194,817 | $208,454 |
| Production Payroll | $129,098 | $132,969 | $136,958 |
| SBRG Franchise Fee | $41,526 | $44,433 | $47,544 |
| Other Production Expenses | $12,000 | $12,000 | $12,000 |
| Total Cost of Sales | $364,696 | $384,219 | $404,956 |
| Gross Margin | $327,412 | $356,336 | $387,439 |
| Gross Margin % | 47.31% | 48.12% | 48.89% |
| Operating Expenses | |||
| Sales and Marketing Expenses | |||
| Sales and Marketing Payroll | $12,168 | $12,531 | $12,907 |
| Advertising/ Promotion | $12,000 | $12,000 | $12,000 |
| SBRG Corporate Marketing Fee | $27,684 | $29,622 | $31,696 |
| Travel | $1,800 | $1,800 | $1,800 |
| Miscellaneous | $1,200 | $1,200 | $1,200 |
| Total Sales and Marketing Expenses | $54,852 | $57,153 | $59,603 |
| Sales and Marketing % | 7.93% | 7.72% | 7.52% |
| General and Administrative Expenses | |||
| General and Administrative Payroll | $48,641 | $50,097 | $51,600 |
| Sales and Marketing and Other Expenses | $0 | $0 | $0 |
| Depreciation | $12,000 | $12,000 | $12,000 |
| Leased Equipment | $0 | $0 | $0 |
| Utilities | $2,400 | $2,400 | $2,400 |
| Insurance | $2,400 | $2,400 | $2,400 |
| Rent | $36,000 | $36,000 | $36,000 |
| Payroll Taxes | $28,486 | $29,340 | $30,220 |
| Other General and Administrative Expenses | $0 | $0 | $0 |
| Total General and Administrative Expenses | $129,927 | $132,237 | $134,620 |
| General and Administrative % | 18.77% | 17.86% | 16.99% |
| Other Expenses: | |||
| Other Payroll | $0 | $0 | $0 |
| Consultants | $0 | $0 | $0 |
| Contract/Consultants | $0 | $0 | $0 |
| Total Other Expenses | $0 | $0 | $0 |
| Other % | 0.00% | 0.00% | 0.00% |
| Total Operating Expenses | $184,779 | $189,390 | $194,223 |
| Profit Before Interest and Taxes | $142,632 | $166,947 | $193,216 |
| EBITDA | $154,632 | $178,947 | $205,216 |
| Interest Expense | $20,194 | $18,690 | $17,020 |
| Taxes Incurred | $36,731 | $44,477 | $52,859 |
| Net Profit | $85,707 | $103,779 | $123,337 |
| Net Profit/Sales | 12.38% | 14.01% | 15.57% |
6.4 Projected Cash Flow
In the following chart and table it is imperative to realize the importance of having cash on hand. If the company were to run into any problems the cash on hand will ensure that the business stays running.

| Pro Forma Cash Flow | |||
| Year 1 | Year 2 | Year 3 | |
| Cash Received | |||
| Cash from Operations | |||
| Cash Sales | $692,108 | $740,556 | $792,394 |
| Subtotal Cash from Operations | $692,108 | $740,556 | $792,394 |
| Additional Cash Received | |||
| Sales Tax, VAT, HST/GST Received | $0 | $0 | $0 |
| New Current Borrowing | $0 | $0 | $0 |
| New Other Liabilities (interest-free) | $0 | $0 | $0 |
| New Long-term Liabilities | $0 | $0 | $0 |
| Sales of Other Current Assets | $0 | $0 | $0 |
| Sales of Long-term Assets | $0 | $0 | $0 |
| New Investment Received | $0 | $0 | $0 |
| Subtotal Cash Received | $692,108 | $740,556 | $792,394 |
| Expenditures | Year 1 | Year 2 | Year 3 |
| Expenditures from Operations | |||
| Cash Spending | $189,907 | $195,597 | $201,465 |
| Bill Payments | $336,482 | $432,352 | $454,852 |
| Subtotal Spent on Operations | $526,389 | $627,949 | $656,317 |
| Additional Cash Spent | |||
| Sales Tax, VAT, HST/GST Paid Out | $0 | $0 | $0 |
| Principal Repayment of Current Borrowing | $0 | $0 | $0 |
| Other Liabilities Principal Repayment | $0 | $0 | $0 |
| Long-term Liabilities Principal Repayment | $21,479 | $23,032 | $24,697 |
| Purchase Other Current Assets | $0 | $0 | $0 |
| Purchase Long-term Assets | $0 | $0 | $0 |
| Dividends | $0 | $36,000 | $36,000 |
| Subtotal Cash Spent | $547,868 | $686,981 | $717,014 |
| Net Cash Flow | $144,240 | $53,574 | $75,381 |
| Cash Balance | $246,240 | $299,814 | $375,195 |
6.5 Projected Balance Sheet
The projected balance sheet is shown below.
| Pro Forma Balance Sheet | |||
| Year 1 | Year 2 | Year 3 | |
| Assets | |||
| Current Assets | |||
| Cash | $246,240 | $299,814 | $375,195 |
| Inventory | $19,201 | $20,545 | $21,984 |
| Other Current Assets | $0 | $0 | $0 |
| Total Current Assets | $265,441 | $320,360 | $397,179 |
| Long-term Assets | |||
| Long-term Assets | $287,000 | $287,000 | $287,000 |
| Accumulated Depreciation | $12,000 | $24,000 | $36,000 |
| Total Long-term Assets | $275,000 | $263,000 | $251,000 |
| Total Assets | $540,441 | $583,360 | $648,179 |
| Liabilities and Capital | Year 1 | Year 2 | Year 3 |
| Current Liabilities | |||
| Accounts Payable | $37,214 | $35,385 | $37,564 |
| Current Borrowing | $0 | $0 | $0 |
| Other Current Liabilities | $0 | $0 | $0 |
| Subtotal Current Liabilities | $37,214 | $35,385 | $37,564 |
| Long-term Liabilities | $278,521 | $255,488 | $230,791 |
| Total Liabilities | $315,735 | $290,874 | $268,355 |
| Paid-in Capital | $300,000 | $300,000 | $300,000 |
| Retained Earnings | ($161,000) | ($111,293) | ($43,514) |
| Earnings | $85,707 | $103,779 | $123,337 |
| Total Capital | $224,707 | $292,486 | $379,823 |
| Total Liabilities and Capital | $540,441 | $583,360 | $648,179 |
| Net Worth | $224,707 | $292,486 | $379,823 |
6.6 Business Ratios
The following table outlines some of the more important ratios from the Restaurant/ Eating Places industry. The final column, Industry Profile, details specific ratios based on the industry as it is classified by the Standard Industry Classification (SIC) code, 5812.
| Ratio Analysis | ||||
| Year 1 | Year 2 | Year 3 | Industry Profile | |
| Sales Growth | 0.00% | 7.00% | 7.00% | 7.60% |
| Percent of Total Assets | ||||
| Inventory | 3.55% | 3.52% | 3.39% | 3.60% |
| Other Current Assets | 0.00% | 0.00% | 0.00% | 35.60% |
| Total Current Assets | 49.12% | 54.92% | 61.28% | 43.70% |
| Long-term Assets | 50.88% | 45.08% | 38.72% | 56.30% |
| Total Assets | 100.00% | 100.00% | 100.00% | 100.00% |
| Current Liabilities | 6.89% | 6.07% | 5.80% | 32.70% |
| Long-term Liabilities | 51.54% | 43.80% | 35.61% | 28.50% |
| Total Liabilities | 58.42% | 49.86% | 41.40% | 61.20% |
| Net Worth | 41.58% | 50.14% | 58.60% | 38.80% |
| Percent of Sales | ||||
| Sales | 100.00% | 100.00% | 100.00% | 100.00% |
| Gross Margin | 47.31% | 48.12% | 48.89% | 60.50% |
| Selling, General & Administrative Expenses | 34.92% | 34.10% | 33.33% | 39.80% |
| Advertising Expenses | 1.73% | 1.62% | 1.51% | 3.20% |
| Profit Before Interest and Taxes | 20.61% | 22.54% | 24.38% | 0.70% |
| Main Ratios | ||||
| Current | 7.13 | 9.05 | 10.57 | 0.98 |
| Quick | 6.62 | 8.47 | 9.99 | 0.65 |
| Total Debt to Total Assets | 58.42% | 49.86% | 41.40% | 61.20% |
| Pre-tax Return on Net Worth | 54.49% | 50.69% | 46.39% | 1.70% |
| Pre-tax Return on Assets | 22.66% | 25.41% | 27.18% | 4.30% |
| Additional Ratios | Year 1 | Year 2 | Year 3 | |
| Net Profit Margin | 12.38% | 14.01% | 15.57% | n.a |
| Return on Equity | 38.14% | 35.48% | 32.47% | n.a |
| Activity Ratios | ||||
| Inventory Turnover | 8.68 | 9.80 | 9.80 | n.a |
| Accounts Payable Turnover | 10.04 | 12.17 | 12.17 | n.a |
| Payment Days | 27 | 31 | 29 | n.a |
| Total Asset Turnover | 1.28 | 1.27 | 1.22 | n.a |
| Debt Ratios | ||||
| Debt to Net Worth | 1.41 | 0.99 | 0.71 | n.a |
| Current Liab. to Liab. | 0.12 | 0.12 | 0.14 | n.a |
| Liquidity Ratios | ||||
| Net Working Capital | $228,227 | $284,974 | $359,614 | n.a |
| Interest Coverage | 7.06 | 8.93 | 11.35 | n.a |
| Additional Ratios | ||||
| Assets to Sales | 0.78 | 0.79 | 0.82 | n.a |
| Current Debt/Total Assets | 7% | 6% | 6% | n.a |
| Acid Test | 6.62 | 8.47 | 9.99 | n.a |
| Sales/Net Worth | 3.08 | 2.53 | 2.09 | n.a |
| Dividend Payout | 0.00 | 0.35 | 0.29 | n.a |
Appendix
| Sales Forecast | |||||||||||||
| Month 1 | Month 2 | Month 3 | Month 4 | Month 5 | Month 6 | Month 7 | Month 8 | Month 9 | Month 10 | Month 11 | Month 12 | ||
| Sales | |||||||||||||
| Meal Deals | 0% | $12,588 | $19,188 | $24,319 | $26,688 | $28,044 | $28,428 | $23,302 | $18,116 | $15,604 | $20,116 | $24,240 | $25,536 |
| A La Carte | 0% | $6,582 | $9,534 | $12,048 | $13,560 | $14,431 | $14,880 | $12,910 | $10,796 | $9,658 | $12,796 | $11,622 | $10,903 |
| Burrito/ Taco | 0% | $8,844 | $14,592 | $20,100 | $23,244 | $25,104 | $26,832 | $22,792 | $19,268 | $16,804 | $21,268 | $24,672 | $25,548 |
| Other | 0% | $1,378 | $2,192 | $3,015 | $3,752 | $4,042 | $4,352 | $3,490 | $2,932 | $2,072 | $2,746 | $3,610 | $3,570 |
| Total Sales | $29,392 | $45,506 | $59,482 | $67,244 | $71,621 | $74,492 | $62,494 | $51,112 | $44,138 | $56,926 | $64,144 | $65,557 | |
| Direct Cost of Sales | Month 1 | Month 2 | Month 3 | Month 4 | Month 5 | Month 6 | Month 7 | Month 8 | Month 9 | Month 10 | Month 11 | Month 12 | |
| Meal Deals | 26% | $3,273 | $4,989 | $6,323 | $6,939 | $7,291 | $7,391 | $6,059 | $4,710 | $4,057 | $5,230 | $6,302 | $6,639 |
| A La Carte | 21% | $1,382 | $2,002 | $2,530 | $2,848 | $3,031 | $3,125 | $2,711 | $2,267 | $2,028 | $2,687 | $2,441 | $2,290 |
| Burrito/ Taco | 31% | $2,742 | $4,524 | $6,231 | $7,206 | $7,782 | $8,318 | $7,066 | $5,973 | $5,209 | $6,593 | $7,648 | $7,920 |
| Other | 17% | $234 | $373 | $513 | $638 | $687 | $740 | $593 | $498 | $352 | $467 | $614 | $607 |
| Subtotal Direct Cost of Sales | $7,631 | $11,887 | $15,597 | $17,630 | $18,791 | $19,574 | $16,428 | $13,449 | $11,647 | $14,977 | $17,005 | $17,456 | |
| Personnel Plan | |||||||||||||
| Month 1 | Month 2 | Month 3 | Month 4 | Month 5 | Month 6 | Month 7 | Month 8 | Month 9 | Month 10 | Month 11 | Month 12 | ||
| Production Personnel | |||||||||||||
| Manager | $3,000 | $3,000 | $3,008 | $3,015 | $3,023 | $3,030 | $3,038 | $3,045 | $3,053 | $3,061 | $3,068 | $3,076 | |
| Cooks (3) | $4,800 | $4,800 | $4,812 | $4,824 | $4,836 | $4,848 | $4,860 | $4,872 | $4,885 | $4,897 | $4,909 | $4,921 | |
| Other | $2,000 | $2,000 | $3,008 | $3,015 | $3,023 | $3,030 | $3,038 | $3,045 | $3,053 | $3,061 | $3,068 | $3,076 | |
| Subtotal | $9,800 | $9,800 | $10,828 | $10,854 | $10,882 | $10,908 | $10,936 | $10,962 | $10,991 | $11,019 | $11,045 | $11,073 | |
| Sales and Marketing Personnel | |||||||||||||
| Marketing | $1,000 | $1,003 | $1,005 | $1,008 | $1,010 | $1,013 | $1,015 | $1,018 | $1,020 | $1,023 | $1,025 | $1,028 | |
| Other | $0 | $0 | $0 | $0 | $0 | $0 | $0 | $0 | $0 | $0 | $0 | $0 | |
| Subtotal | $1,000 | $1,003 | $1,005 | $1,008 | $1,010 | $1,013 | $1,015 | $1,018 | $1,020 | $1,023 | $1,025 | $1,028 | |
| General and Administrative Personnel | |||||||||||||
| Benjamin Strock | $3,000 | $3,008 | $3,015 | $3,023 | $3,030 | $3,038 | $3,045 | $3,053 | $3,061 | $3,068 | $3,076 | $3,084 | |
| Accountant | $1,000 | $1,000 | $1,003 | $1,005 | $1,008 | $1,010 | $1,013 | $1,015 | $1,018 | $1,020 | $1,023 | $1,025 | |
| Other | $0 | $0 | $0 | $0 | $0 | $0 | $0 | $0 | $0 | $0 | $0 | $0 | |
| Subtotal | $4,000 | $4,008 | $4,018 | $4,028 | $4,038 | $4,048 | $4,058 | $4,068 | $4,079 | $4,088 | $4,099 | $4,109 | |
| Other Personnel | |||||||||||||
| Name or Title | $0 | $0 | $0 | $0 | $0 | $0 | $0 | $0 | $0 | $0 | $0 | $0 | |
| Other | $0 | $0 | $0 | $0 | $0 | $0 | $0 | $0 | $0 | $0 | $0 | $0 | |
| Subtotal | $0 | $0 | $0 | $0 | $0 | $0 | $0 | $0 | $0 | $0 | $0 | $0 | |
| Total People | 0 | 0 | 0 | 0 | 0 | 0 | 0 | 0 | 0 | 0 | 0 | 0 | |
| Total Payroll | $14,800 | $14,811 | $15,851 | $15,890 | $15,930 | $15,969 | $16,009 | $16,048 | $16,090 | $16,130 | $16,169 | $16,210 | |
| General Assumptions | |||||||||||||
| Month 1 | Month 2 | Month 3 | Month 4 | Month 5 | Month 6 | Month 7 | Month 8 | Month 9 | Month 10 | Month 11 | Month 12 | ||
| Plan Month | 1 | 2 | 3 | 4 | 5 | 6 | 7 | 8 | 9 | 10 | 11 | 12 | |
| Current Interest Rate | 10.00% | 10.00% | 10.00% | 10.00% | 10.00% | 10.00% | 10.00% | 10.00% | 10.00% | 10.00% | 10.00% | 10.00% | |
| Long-term Interest Rate | 7.00% | 7.00% | 7.00% | 7.00% | 7.00% | 7.00% | 7.00% | 7.00% | 7.00% | 7.00% | 7.00% | 7.00% | |
| Tax Rate | 30.00% | 30.00% | 30.00% | 30.00% | 30.00% | 30.00% | 30.00% | 30.00% | 30.00% | 30.00% | 30.00% | 30.00% | |
| Other | 0 | 0 | 0 | 0 | 0 | 0 | 0 | 0 | 0 | 0 | 0 | 0 | |
| Pro Forma Profit and Loss | |||||||||||||
| Month 1 | Month 2 | Month 3 | Month 4 | Month 5 | Month 6 | Month 7 | Month 8 | Month 9 | Month 10 | Month 11 | Month 12 | ||
| Sales | $29,392 | $45,506 | $59,482 | $67,244 | $71,621 | $74,492 | $62,494 | $51,112 | $44,138 | $56,926 | $64,144 | $65,557 | |
| Direct Cost of Sales | $7,631 | $11,887 | $15,597 | $17,630 | $18,791 | $19,574 | $16,428 | $13,449 | $11,647 | $14,977 | $17,005 | $17,456 | |
| Production Payroll | $9,800 | $9,800 | $10,828 | $10,854 | $10,882 | $10,908 | $10,936 | $10,962 | $10,991 | $11,019 | $11,045 | $11,073 | |
| SBRG Franchise Fee | 6% | $1,764 | $2,730 | $3,569 | $4,035 | $4,297 | $4,470 | $3,750 | $3,067 | $2,648 | $3,416 | $3,849 | $3,933 |
| Other Production Expenses | $1,000 | $1,000 | $1,000 | $1,000 | $1,000 | $1,000 | $1,000 | $1,000 | $1,000 | $1,000 | $1,000 | $1,000 | |
| Total Cost of Sales | $20,195 | $25,418 | $30,993 | $33,519 | $34,971 | $35,951 | $32,114 | $28,478 | $26,286 | $30,412 | $32,899 | $33,462 | |
| Gross Margin | $9,197 | $20,088 | $28,489 | $33,725 | $36,650 | $38,541 | $30,380 | $22,634 | $17,852 | $26,514 | $31,245 | $32,095 | |
| Gross Margin % | 31.29% | 44.14% | 47.89% | 50.15% | 51.17% | 51.74% | 48.61% | 44.28% | 40.45% | 46.58% | 48.71% | 48.96% | |
| Operating Expenses | |||||||||||||
| Sales and Marketing Expenses | |||||||||||||
| Sales and Marketing Payroll | $1,000 | $1,003 | $1,005 | $1,008 | $1,010 | $1,013 | $1,015 | $1,018 | $1,020 | $1,023 | $1,025 | $1,028 | |
| Advertising/ Promotion | $1,000 | $1,000 | $1,000 | $1,000 | $1,000 | $1,000 | $1,000 | $1,000 | $1,000 | $1,000 | $1,000 | $1,000 | |
| SBRG Corporate Marketing Fee | 4% | $1,176 | $1,820 | $2,379 | $2,690 | $2,865 | $2,980 | $2,500 | $2,044 | $1,766 | $2,277 | $2,566 | $2,622 |
| Travel | $600 | $600 | $600 | $0 | $0 | $0 | $0 | $0 | $0 | $0 | $0 | $0 | |
| Miscellaneous | $100 | $100 | $100 | $100 | $100 | $100 | $100 | $100 | $100 | $100 | $100 | $100 | |
| Total Sales and Marketing Expenses | $3,876 | $4,523 | $5,084 | $4,798 | $4,975 | $5,093 | $4,615 | $4,162 | $3,886 | $4,400 | $4,691 | $4,750 | |
| Sales and Marketing % | 13.19% | 9.94% | 8.55% | 7.13% | 6.95% | 6.84% | 7.38% | 8.14% | 8.80% | 7.73% | 7.31% | 7.25% | |
| General and Administrative Expenses | |||||||||||||
| General and Administrative Payroll | $4,000 | $4,008 | $4,018 | $4,028 | $4,038 | $4,048 | $4,058 | $4,068 | $4,079 | $4,088 | $4,099 | $4,109 | |
| Sales and Marketing and Other Expenses | $0 | $0 | $0 | $0 | $0 | $0 | $0 | $0 | $0 | $0 | $0 | $0 | |
| Depreciation | $1,000 | $1,000 | $1,000 | $1,000 | $1,000 | $1,000 | $1,000 | $1,000 | $1,000 | $1,000 | $1,000 | $1,000 | |
| Leased Equipment | $0 | $0 | $0 | $0 | $0 | $0 | $0 | $0 | $0 | $0 | $0 | $0 | |
| Utilities | $200 | $200 | $200 | $200 | $200 | $200 | $200 | $200 | $200 | $200 | $200 | $200 | |
| Insurance | $200 | $200 | $200 | $200 | $200 | $200 | $200 | $200 | $200 | $200 | $200 | $200 | |
| Rent | $3,000 | $3,000 | $3,000 | $3,000 | $3,000 | $3,000 | $3,000 | $3,000 | $3,000 | $3,000 | $3,000 | $3,000 | |
| Payroll Taxes | 15% | $2,220 | $2,222 | $2,378 | $2,384 | $2,390 | $2,395 | $2,401 | $2,407 | $2,414 | $2,420 | $2,425 | $2,432 |
| Other General and Administrative Expenses | $0 | $0 | $0 | $0 | $0 | $0 | $0 | $0 | $0 | $0 | $0 | $0 | |
| Total General and Administrative Expenses | $10,620 | $10,630 | $10,796 | $10,812 | $10,828 | $10,843 | $10,859 | $10,875 | $10,893 | $10,908 | $10,924 | $10,941 | |
| General and Administrative % | 36.13% | 23.36% | 18.15% | 16.08% | 15.12% | 14.56% | 17.38% | 21.28% | 24.68% | 19.16% | 17.03% | 16.69% | |
| Other Expenses: | |||||||||||||
| Other Payroll | $0 | $0 | $0 | $0 | $0 | $0 | $0 | $0 | $0 | $0 | $0 | $0 | |
| Consultants | $0 | $0 | $0 | $0 | $0 | $0 | $0 | $0 | $0 | $0 | $0 | $0 | |
| Contract/Consultants | $0 | $0 | $0 | $0 | $0 | $0 | $0 | $0 | $0 | $0 | $0 | $0 | |
| Total Other Expenses | $0 | $0 | $0 | $0 | $0 | $0 | $0 | $0 | $0 | $0 | $0 | $0 | |
| Other % | 0.00% | 0.00% | 0.00% | 0.00% | 0.00% | 0.00% | 0.00% | 0.00% | 0.00% | 0.00% | 0.00% | 0.00% | |
| Total Operating Expenses | $14,496 | $15,153 | $15,880 | $15,609 | $15,802 | $15,936 | $15,474 | $15,038 | $14,778 | $15,308 | $15,615 | $15,691 | |
| Profit Before Interest and Taxes | ($5,298) | $4,936 | $12,609 | $18,116 | $20,848 | $22,605 | $14,906 | $7,597 | $3,074 | $11,207 | $15,630 | $16,404 | |
| EBITDA | ($4,298) | $5,936 | $13,609 | $19,116 | $21,848 | $23,605 | $15,906 | $8,597 | $4,074 | $12,207 | $16,630 | $17,404 | |
| Interest Expense | $1,740 | $1,730 | $1,719 | $1,709 | $1,699 | $1,688 | $1,678 | $1,667 | $1,657 | $1,646 | $1,635 | $1,625 | |
| Taxes Incurred | ($2,111) | $962 | $3,267 | $4,922 | $5,745 | $6,275 | $3,968 | $1,779 | $425 | $2,868 | $4,198 | $4,434 | |
| Net Profit | ($4,927) | $2,244 | $7,622 | $11,485 | $13,404 | $14,641 | $9,259 | $4,151 | $992 | $6,692 | $9,796 | $10,346 | |
| Net Profit/Sales | -16.76% | 4.93% | 12.81% | 17.08% | 18.72% | 19.65% | 14.82% | 8.12% | 2.25% | 11.76% | 15.27% | 15.78% | |
| Pro Forma Cash Flow | |||||||||||||
| Month 1 | Month 2 | Month 3 | Month 4 | Month 5 | Month 6 | Month 7 | Month 8 | Month 9 | Month 10 | Month 11 | Month 12 | ||
| Cash Received | |||||||||||||
| Cash from Operations | |||||||||||||
| Cash Sales | $29,392 | $45,506 | $59,482 | $67,244 | $71,621 | $74,492 | $62,494 | $51,112 | $44,138 | $56,926 | $64,144 | $65,557 | |
| Subtotal Cash from Operations | $29,392 | $45,506 | $59,482 | $67,244 | $71,621 | $74,492 | $62,494 | $51,112 | $44,138 | $56,926 | $64,144 | $65,557 | |
| Additional Cash Received | |||||||||||||
| Sales Tax, VAT, HST/GST Received | 0.00% | $0 | $0 | $0 | $0 | $0 | $0 | $0 | $0 | $0 | $0 | $0 | $0 |
| New Current Borrowing | $0 | $0 | $0 | $0 | $0 | $0 | $0 | $0 | $0 | $0 | $0 | $0 | |
| New Other Liabilities (interest-free) | $0 | $0 | $0 | $0 | $0 | $0 | $0 | $0 | $0 | $0 | $0 | $0 | |
| New Long-term Liabilities | $0 | $0 | $0 | $0 | $0 | $0 | $0 | $0 | $0 | $0 | $0 | $0 | |
| Sales of Other Current Assets | $0 | $0 | $0 | $0 | $0 | $0 | $0 | $0 | $0 | $0 | $0 | $0 | |
| Sales of Long-term Assets | $0 | $0 | $0 | $0 | $0 | $0 | $0 | $0 | $0 | $0 | $0 | $0 | |
| New Investment Received | $0 | $0 | $0 | $0 | $0 | $0 | $0 | $0 | $0 | $0 | $0 | $0 | |
| Subtotal Cash Received | $29,392 | $45,506 | $59,482 | $67,244 | $71,621 | $74,492 | $62,494 | $51,112 | $44,138 | $56,926 | $64,144 | $65,557 | |
| Expenditures | Month 1 | Month 2 | Month 3 | Month 4 | Month 5 | Month 6 | Month 7 | Month 8 | Month 9 | Month 10 | Month 11 | Month 12 | |
| Expenditures from Operations | |||||||||||||
| Cash Spending | $14,800 | $14,811 | $15,851 | $15,890 | $15,930 | $15,969 | $16,009 | $16,048 | $16,090 | $16,130 | $16,169 | $16,210 | |
| Bill Payments | $363 | $11,044 | $15,768 | $22,330 | $41,154 | $42,603 | $43,377 | $32,561 | $26,551 | $24,497 | $36,855 | $39,379 | |
| Subtotal Spent on Operations | $15,163 | $25,855 | $31,619 | $38,220 | $57,084 | $58,572 | $59,386 | $48,609 | $42,641 | $40,627 | $53,024 | $55,589 | |
| Additional Cash Spent | |||||||||||||
| Sales Tax, VAT, HST/GST Paid Out | $0 | $0 | $0 | $0 | $0 | $0 | $0 | $0 | $0 | $0 | $0 | $0 | |
| Principal Repayment of Current Borrowing | $0 | $0 | $0 | $0 | $0 | $0 | $0 | $0 | $0 | $0 | $0 | $0 | |
| Other Liabilities Principal Repayment | $0 | $0 | $0 | $0 | $0 | $0 | $0 | $0 | $0 | $0 | $0 | $0 | |
| Long-term Liabilities Principal Repayment | $1,733 | $1,743 | $1,754 | $1,764 | $1,774 | $1,784 | $1,795 | $1,805 | $1,816 | $1,826 | $1,837 | $1,848 | |
| Purchase Other Current Assets | $0 | $0 | $0 | $0 | $0 | $0 | $0 | $0 | $0 | $0 | $0 | $0 | |
| Purchase Long-term Assets | $0 | $0 | $0 | $0 | $0 | $0 | $0 | $0 | $0 | $0 | $0 | $0 | |
| Dividends | $0 | $0 | $0 | $0 | $0 | $0 | $0 | $0 | $0 | $0 | $0 | $0 | |
| Subtotal Cash Spent | $16,896 | $27,598 | $33,372 | $39,984 | $58,859 | $60,357 | $61,180 | $50,415 | $44,456 | $42,453 | $54,861 | $57,437 | |
| Net Cash Flow | $12,496 | $17,908 | $26,110 | $27,260 | $12,762 | $14,135 | $1,314 | $697 | ($318) | $14,473 | $9,283 | $8,120 | |
| Cash Balance | $114,496 | $132,404 | $158,514 | $185,773 | $198,536 | $212,671 | $213,985 | $214,682 | $214,364 | $228,837 | $238,119 | $246,240 | |
| Pro Forma Balance Sheet | |||||||||||||
| Month 1 | Month 2 | Month 3 | Month 4 | Month 5 | Month 6 | Month 7 | Month 8 | Month 9 | Month 10 | Month 11 | Month 12 | ||
| Assets | Starting Balances | ||||||||||||
| Current Assets | |||||||||||||
| Cash | $102,000 | $114,496 | $132,404 | $158,514 | $185,773 | $198,536 | $212,671 | $213,985 | $214,682 | $214,364 | $228,837 | $238,119 | $246,240 |
| Inventory | $50,000 | $42,369 | $30,482 | $17,156 | $19,393 | $20,670 | $21,531 | $18,071 | $14,794 | $12,811 | $16,475 | $18,706 | $19,201 |
| Other Current Assets | $0 | $0 | $0 | $0 | $0 | $0 | $0 | $0 | $0 | $0 | $0 | $0 | $0 |
| Total Current Assets | $152,000 | $156,865 | $162,886 | $175,670 | $205,166 | $219,206 | $234,202 | $232,056 | $229,476 | $227,175 | $245,312 | $256,825 | $265,441 |
| Long-term Assets | |||||||||||||
| Long-term Assets | $287,000 | $287,000 | $287,000 | $287,000 | $287,000 | $287,000 | $287,000 | $287,000 | $287,000 | $287,000 | $287,000 | $287,000 | $287,000 |
| Accumulated Depreciation | $0 | $1,000 | $2,000 | $3,000 | $4,000 | $5,000 | $6,000 | $7,000 | $8,000 | $9,000 | $10,000 | $11,000 | $12,000 |
| Total Long-term Assets | $287,000 | $286,000 | $285,000 | $284,000 | $283,000 | $282,000 | $281,000 | $280,000 | $279,000 | $278,000 | $277,000 | $276,000 | $275,000 |
| Total Assets | $439,000 | $442,865 | $447,886 | $459,670 | $488,166 | $501,206 | $515,202 | $512,056 | $508,476 | $505,175 | $522,312 | $532,825 | $540,441 |
| Liabilities and Capital | Month 1 | Month 2 | Month 3 | Month 4 | Month 5 | Month 6 | Month 7 | Month 8 | Month 9 | Month 10 | Month 11 | Month 12 | |
| Current Liabilities | |||||||||||||
| Accounts Payable | $0 | $10,525 | $15,045 | $20,960 | $39,736 | $41,145 | $42,284 | $31,673 | $25,748 | $23,271 | $35,542 | $38,096 | $37,214 |
| Current Borrowing | $0 | $0 | $0 | $0 | $0 | $0 | $0 | $0 | $0 | $0 | $0 | $0 | $0 |
| Other Current Liabilities | $0 | $0 | $0 | $0 | $0 | $0 | $0 | $0 | $0 | $0 | $0 | $0 | $0 |
| Subtotal Current Liabilities | $0 | $10,525 | $15,045 | $20,960 | $39,736 | $41,145 | $42,284 | $31,673 | $25,748 | $23,271 | $35,542 | $38,096 | $37,214 |
| Long-term Liabilities | $300,000 | $298,267 | $296,523 | $294,770 | $293,006 | $291,232 | $289,448 | $287,653 | $285,848 | $284,032 | $282,205 | $280,368 | $278,521 |
| Total Liabilities | $300,000 | $308,791 | $311,568 | $315,730 | $332,742 | $332,377 | $331,732 | $319,326 | $311,596 | $307,303 | $317,747 | $318,464 | $315,735 |
| Paid-in Capital | $300,000 | $300,000 | $300,000 | $300,000 | $300,000 | $300,000 | $300,000 | $300,000 | $300,000 | $300,000 | $300,000 | $300,000 | $300,000 |
| Retained Earnings | ($161,000) | ($161,000) | ($161,000) | ($161,000) | ($161,000) | ($161,000) | ($161,000) | ($161,000) | ($161,000) | ($161,000) | ($161,000) | ($161,000) | ($161,000) |
| Earnings | $0 | ($4,927) | ($2,683) | $4,940 | $16,425 | $29,829 | $44,470 | $53,730 | $57,880 | $58,872 | $65,565 | $75,361 | $85,707 |
| Total Capital | $139,000 | $134,073 | $136,317 | $143,940 | $155,425 | $168,829 | $183,470 | $192,730 | $196,880 | $197,872 | $204,565 | $214,361 | $224,707 |
| Total Liabilities and Capital | $439,000 | $442,865 | $447,886 | $459,670 | $488,166 | $501,206 | $515,202 | $512,056 | $508,476 | $505,175 | $522,312 | $532,825 | $540,441 |
| Net Worth | $139,000 | $134,073 | $136,317 | $143,940 | $155,425 | $168,829 | $183,470 | $192,730 | $196,880 | $197,872 | $204,565 | $214,361 | $224,707 |


