
Jonpaul's
Executive Summary
Jonpaul’s is an upscale old-world gentleman’s barber shop that offers today’s progressive gentlemen a haven where he can sit back, relax and experience the “World Class” art of grooming and services in a gentleman’s club atmosphere, which is masculine and therapeutic. Jonpaul’s is aimed at an exclusive market and a discerning customer base, and will add tremendous value to our community while offering a combination of “World Class Services” not currently being offered by any competitor in the greater Gigaburb area. We intend to be profitable by increasing our client base through becoming a highly sought after destination.
Our goal, beyond becoming a profitable business, is becoming a trusted destination whereby the clients in our community can come to refresh their minds and bodies, replenish their energies, and network with their colleagues and friends!
1.1 Mission
Jonpaul’s will provide a comforting, yet stimulating, old world gentleman’s club atmosphere in which customers will be able to relax both their body and mind, through a wide range of services. Jonpaul’s will establish itself as a world class service provider to which clients can always come to escape the stresses of life, and rejuvenate their energies, enjoy the camaraderie of their colleagues and friends.
1.2 Keys to Success
The keys to success in our business are:
- Location: Providing an easily accessible location for clients.
- Environment: Providing an environment conducive to giving relaxing and professional service.
- Convenience: Offering clients a wide range of services in one setting, and extended business hours.
- Reputation: Reputation of the owner and staff as providing superior personal service.
- Effective advertising: Advertising in the corporate environment.
1.3 Objectives
The objectives for Jonpaul’s are outlined below:
- To create a service-base company whose goal is to exceed customer’s expectations.
- Sales increase substantially by end of Year 2 and nearly double year one revenue by the end of Year 3.
- To increase the number of clients services by at least 20% per year through superior performance and word-of mouth referrals.
- Have a clientele return rate of 90% by end of Year 1.
- Become an established community destination by end of Year 1.
Company Summary
Jonpaul’s is a full-service gentleman’s barber shop dedicated to consistently providing world class men’s grooming services to our clients, high quality products while furnishing an enjoyable relaxing atmosphere at an acceptable price/value relationship.
Our Motto: “World Class Service Begins Here”
The timing is right for this venture. Patiently searching for the last few years for a similar highly recognized existing business in a prime location, was unsuccessful. We therefore decided to build one from the ground up.
2.1 Start-up Summary
After spending several months searching for a high-end exclusive gentleman’s barber shop to purchase, the owners decided to start an exclusive barber shop – men’s grooming services from the ground up. The start-up capital will be used for the design, leasehold improvements, and equipment for the shop. The start-up cash has been marked for the estimated amount needed to cover operational expenses for the first two months.

| Start-up | |
| Requirements | |
| Start-up Expenses | |
| Legal | $2,500 |
| Stationery etc. | $1,000 |
| Brochures, Logo, and Design | $3,000 |
| Consultants-Interior Design | $2,000 |
| Insurance | $3,000 |
| Rent | $14,000 |
| Leasehold Improvement construction | $115,000 |
| Expensed Equipment – $38000 in S-Assets | $17,000 |
| Other | $5,000 |
| Total Start-up Expenses | $162,500 |
| Start-up Assets | |
| Cash Required | $40,000 |
| Start-up Inventory | $10,000 |
| Other Current Assets | $38,000 |
| Long-term Assets | $0 |
| Total Assets | $88,000 |
| Total Requirements | $250,500 |
| Start-up Funding | |
| Start-up Expenses to Fund | $162,500 |
| Start-up Assets to Fund | $88,000 |
| Total Funding Required | $250,500 |
| Assets | |
| Non-cash Assets from Start-up | $48,000 |
| Cash Requirements from Start-up | $40,000 |
| Additional Cash Raised | $0 |
| Cash Balance on Starting Date | $40,000 |
| Total Assets | $88,000 |
| Liabilities and Capital | |
| Liabilities | |
| Current Borrowing | $0 |
| Long-term Liabilities | $225,000 |
| Accounts Payable (Outstanding Bills) | $0 |
| Other Current Liabilities (interest-free) | $25,500 |
| Total Liabilities | $250,500 |
| Capital | |
| Planned Investment | |
| Investor 1 | $0 |
| Investor 2 | $0 |
| Other | $0 |
| Additional Investment Requirement | $0 |
| Total Planned Investment | $0 |
| Loss at Start-up (Start-up Expenses) | ($162,500) |
| Total Capital | ($162,500) |
| Total Capital and Liabilities | $88,000 |
| Total Funding | $250,500 |
2.2 Company Locations and Facilities
Jonpaul’s is located in The Mall, a 160,000 foot shopping and entertainment center in Gigaburb. The suite is 1,950 sq. ft at $24.50/sq. ft. with a 3-year lease. This site is a very high profile area with easy access and ample parking.
The Mall is anchored by Regal Cinema, the largest theater chain in the Gigaburb market with a 16-screen, state of the art complex. In addition to specialty retail and service shops within the center, there is a food pavilion anchored by Starbucks, Macaroni Grill, Garrison’s, and Rio Bravo. Other tenants include Ben & Jerry’s, Las Vegas Golf, specialty furniture, boutiques, antiques, and specialty children shops.
The Mall is located on the corner of a highly traveled State Highway and a Metro Road in the high growth, affluent area of Gigaburb. The Mall’s primary trade area will serve the burgeoning country club communities and exclusive neighborhoods located within a fifteen-minute drive from the site. According to Equifax National Decision Systems, the primary trade area in 2000 had a population of 317,931 that is projected to reach 358,716 by 2005.
2.3 Company Ownership
Jonpaul’s is a privately held S corporation co-owned by Cathy Leskie and her husband Dr. Jonpaul Leskie. Cathy Leskie has 10 years experience in the hair and spa industry. She studied in the U.S. and Europe and continues to stay on top of the latest styles, trends and products. Cathy has worked as a stylist, then as a manager – managing 16 stylist in a prestigious upscale salon.
Dr. Jonpaul Leskie – is President/CEO of Jp Leskie & Associates, a Technology Consulting Firm. Dr. Leskie is a pioneer and innovator with over 30 years experience in the computer, e-business and telecommunications industry. Dr. Leskie has a proven track record of success in launching new business and directing operations for Fortune 500 companies worldwide.
To achieve our objectives, Jonpaul’s is seeking loan financing. This loan will be paid from the cash flow from the business, and will be secured by the assets of the company, and backed by the character, experience and personal guarantees of the owners.
Products and Services
Jonpaul’s is considered an upscale full-service barber shop – services exclusively for men. We offer our clients a gentleman’s club atmosphere, with a complimenting wide range of services and products that include:
Services:
- Hair: Cut and style, one step hair color, highlights, toner, corrective color, hair and scalp treatments
- Shaves: Traditional straight razor shaves, hot towels, and balm treatment
- Nails: Manicures, pedicures
- Waxing Services: Eyebrow shaping
- Men’s Services: Essential facials and peels, sports massage, deep tissue massage
- Hair Laser Removal: Hair removal on neck, back, ears, etc.
- Shoe Shine: Shoe shine service in the waiting room or while services are being performed.
Products:
- London: Shave creams, soap, bath oils, shaving accessories exclusively for men
- United States: Shave creams, skin care, shaving accessories exclusively for men.
Explanations and/or consultations will be provided on all services and products if needed.
3.1 Product and Service Description
| Men’s Services | |
| Shampoo, Cut, Style, Blow-dry | $ 38 |
| Hair and Scalp Treatments | $ 20 |
| Colour Blending or Highlights | $ 40 and Up |
| Moustache and Beard Trim | $ 7 |
| Moustache Trim | $ 5 |
| Stately Shave (Hot towels, Balm) | $ 30 (30 minutes) |
| Hair Style and Stately Shave | $ 60 |
| Eyebrow Shaping | $ 12 |
| Natural Nail Grooming | $ 15 |
| Royal Pedicure | $ 38 |
| Essential Facial | $ 65 |
| Deep Tissue Massage | $ 75 (1 hour) |
|
Laser Hair Removal |
$ 85 and Up |
| Shoe Shine | $ 5 and Up |
| Products – Men’s Shave Creams, Oils, Soaps, Accessories | |
| London | $ 20 and Up |
| United States | $ 18 and Up |
3.2 Competitive Comparison
There are many salons in The Mall’s area, but no direct competitors. There is no one place in the greater Gigaburb area that offers a high-end gentleman’s barber shop exclusively for men, where a gentleman can sit back, relax in a gentleman’s club atmosphere and experience the art of traditional grooming services in an environment that is masculine and therapeutic.

3.3 Sales Literature
Service brochure, logo/slogan with advertising to be included, and a planned website.
3.4 Fulfillment
Jonpaul’s services sell themselves. World Class Service performed in an upscale environment will attract clientele. Our prices are very reasonable for the quality of services provided. We have an agreement with a U.S. based importer of our London products, which keeps our product price at its lowest price point.
3.5 Technology
Jonpaul’s will sell complimenting products of the highest quality, and latest scientific development.
Our gentleman’s shop computer system, incorporates the latest hardware and software to manage appointments, client database, point of sale, email capabilities, Web-enabled networking, inventory, bar code reading, historical data, employee records, transaction history, accounts receivable/payable and payroll. Back-up of the system is performed daily.
Clients will be emailed appointment confirmation messages two days prior to appointment. In addition they will also receive a personal phone call one day prior to appointment to confirm appointment. A thank you note will be emailed automatically after services have been performed.
Our gentleman’s shop will incorporate a wireless network within the facilities. It will serve as an internal network and provide a service for our clients that need to access the Internet while visiting our facilities.
3.6 Future Products and Services
Jonpaul’s will be considering branding its own product line in the future. In addition it may offer chiropractic services and acupuncture services on an as needed basis. Jonpaul’s will always remain involved with the best men’s hair styling and health techniques offered, and will implement them if deemed appropriate and feasible for Jonpaul’s clientele.
Market Analysis Summary
Jonpaul’s will focus on the professional male. An Internet study revealed that 85% of professional men had personal hair grooming services performed during the workday. The space at The Mall fits the demographics for our business. Applied Geographic Solutions estimates that 59,251 people live within a three-mile radius of our facility and 42,759 work there. They estimate 161,848 live within a five-mile radius and 109,867 work there. There are 15 business parks totaling 6,206 businesses located within a seven-mile radius.
4.1 Market Segmentation
Our target market will be barber shop services for the professional male. Based on our Internet survey, 80% of our services will be associated with hair, hair color, shaves, shoe shine; 15% will come from facial, massage, nail, and tanning services; and 5% will come from products. Thus, our target market will be male professionals and retirees, from the age of 25, with individual and household incomes greater than $75,000.
The following table and chart depict our potential customers with a conservative annual growth rate of 4%. The annual growth rate for the area has been 7.5% since 1990.

| Market Analysis | |||||||
| Year 1 | Year 2 | Year 3 | Year 4 | Year 5 | |||
| Potential Customers | Growth | CAGR | |||||
| $75K to $100K 1mi. Radius of Facility | 4% | 3,816 | 3,969 | 4,128 | 4,293 | 4,465 | 4.00% |
| $75K to $100K 3 mi. Radius of Facility | 4% | 10,403 | 10,819 | 11,252 | 11,702 | 12,170 | 4.00% |
| $75K to $100K 5 mi. Radius of Facility | 4% | 18,140 | 18,866 | 19,621 | 20,406 | 21,222 | 4.00% |
| $100K to $150K 1mi. Radius of Facility | 4% | 9,352 | 9,726 | 10,115 | 10,520 | 10,941 | 4.00% |
| $100K to $150K 3 mi. Radius of Facility | 4% | 10,224 | 10,633 | 11,058 | 11,500 | 11,960 | 4.00% |
| $100K to $150K 5 mi.Radius of Facility | 4% | 20,540 | 21,362 | 22,216 | 23,105 | 24,029 | 4.00% |
| $150K + 1 mi. Radius of Facility | 4% | 19,432 | 20,209 | 21,017 | 21,858 | 22,732 | 4.00% |
| $150K + 3 mi. Radius of Facility | 4% | 10,045 | 10,447 | 10,865 | 11,300 | 11,752 | 4.00% |
| $150K + 5 mi. Radius of Facility | 4% | 20,229 | 21,038 | 21,880 | 22,755 | 23,665 | 4.00% |
| Total | 4.00% | 122,181 | 127,069 | 132,152 | 137,439 | 142,936 | 4.00% |
4.2 Target Market Segment Strategy
The members of these market segments have luxury money on hand, and lead professional lives filled with very busy schedules. All persons usually need hairstyling regardless of income level, and make the effort to find money available to style their “look.”
4.2.1 Market Trends
In spite of the massive growth in residential and corporate complexes and substantial employment within 7 miles of The Mall, a gap currently exists in the retail trade and entertainment area. The shopping center is strategically located between two major malls, each occupying more than 1.2 million square feet. Virtually no high-end restaurants or commercial support services existed in the Gigaburb vicinity until The Mall was developed. Our facility will be located in this center, which provides a huge competitive advantage.
A population of nearly 205,000 people, consisting of young, upper-class families with an average household income of $92,247, exists within a seven-mile radius of the center. The immediate area surrounding The Mall has impressive demographics as well, with an average household income of $119,423 within a three-mile radius. The average new house sale price in The Mall area in 1998 was $377,249, up from $227,000 in 1990. It is also important to note that many companies are locating their corporate headquarters in the Gigaburb vicinity, not just administrative offices. Another plus is that several office buildings, and hotels, are located within a short drive of our gentleman’s shop.
4.2.2 Market Growth
Our gentleman’s shop’s trade area’s best growth potential is in terms of daytime employment. The total daytime business population in a three-mile radius is 42,759 with the residential population at 59,251. The total daytime business population in a five-mile radius is 109,867 with the residential population at 161,848. The nearby business parks also have an ample supply of land for future office development. An even more predictable source of daytime employment growth is the planned expansion of existing companies.
The Mall is the only shopping and entertainment center site within an 8 mile radius. Jonpaul’s is the only gentleman’s shop exclusively for men at The Mall. The future look very promising for a thriving business with a continual presence of clients.
4.2.3 Market Needs
The traditional barbershop of years past have been traditionally been replaced by unisex salon’s and spa’s which focused mainly on women. Professional men are more health and style conscious, especially men who have achieved a modicum level of professional success. They are willing pay for products and services that are geared specifically toward men. They are looking for an environment that consistently offers quality service, products and camaraderie. They look for a gathering place where they can openly discuss politics, watch sports or stock market news on TV, read the newspaper, network, get a cup of gourmet coffee, buy an imported cigar, and get a shoe shine.
The surrounding area of The Mall and Country County has become a bastion for the successful, having consistently been the fastest growing areas in our state. This has created a community of wealth, mobility, and growth. State Highway is a major north/south highway that connects the northern suburbs to midtown Gigaburb. The section of State Highway near our site is two lanes in each direction and includes an interchange at Metro Road. In 1998, the State DOT recorded an ADT volume on State Highway of 46,082 vehicles per day up from the 1997 traffic count of 38,375. This number is expected to continue to increase substantially over the next few years.
4.3 Service Business Analysis
We are part of the retail health and beauty industry which has four major types:
- Salons: Stores with only hair styling services and products.
- Day Spas: Stores specializing in body health maintenance through a variety of services and products.
- Day Spa & Salon: Stores combining the services of the two aforementioned.
- Health & Beauty Products: Stores selling only merchandise product covering the wide range of products available but not inclusive of those sold by salons and spas.
The industry is now starting to realize that the traditional barber shop needs to be added to their list of major types. The European market has catered to men since their first barber shop in 1805. The traditional barber shop in Europe is starting to expand its services to include massage, facials, manicures and pedicures based on the suggestions of the “progressive gentleman”. High standards of grooming has always been a tradition in Europe. U.S. professionals who travel abroad have experienced these services and are looking for similar services here in the U.S.
4.3.1 Main Competitors
The main competitor is VanAstorBilts located across town. Strengths of VanAstorBilts are its wide array of spa services. The weaknesses of VanAstorBilts are the limited number of services dedicated specifically to male clients, i.e. hair grooming, shaves, shoe shines. VanAstorBilts services and products cater more toward the female professional. We feel the presence of Jonpaul’s is not a direct competitor to VanAstorBilts and visa versa.
Our market advantage is wide open, and will give us the opportunity to service a large population base of professional males that is not currently being well served.
4.3.2 Competition and Buying Patterns
Clients choose men’s grooming services based on proximity to their daily travels from home and work, reputation for high quality service, and good pricing. With our combined services and catering to the male professional, we don’t feel we have competition. Any competition will mainly be from unisex salons or combination unisex spa-salons.
4.3.3 Business Participants
Industry participants are those whose services include salon and spa offerings. Salon services concern hair styling, while spa services concern body relaxing and rejuvenating offerings such as massage, nail, and face works.
No one industry participant has focused specifically toward men only.
Strategy and Implementation Summary
- Emphasize quality, originality, and “World Class Service”. We will differentiate ourselves from our competitors by offering a staff of practitioners who are not only certified in their professions, but will be trained in understanding the dynamics of customer service so as to maximize the connection to their clients and more easily meet their clients expectations.
- We will provide a unique atmosphere. From our professional staff to our ambience of our barber shop, Jonpaul’s will distinguish itself as a completely trustworthy and soothing setting where clients can enjoy being pampered, escape the stress of their everyday lives and enjoy the camaraderie of friends and colleagues.
- Build a community/corporate relationship-oriented business. We will focus on strengthening the trust of our customer base, and providing not only services, but information that will aid everyone in the progression of obtaining a balanced and healthy lifestyle.
5.1 Value Proposition
Our value proposition is that we will bring a unique mode of relaxation and fulfillment to the discerning gentleman. When people are relaxed, comfortable, and happy they have the ability to work harder, concentrate better, feel physically, emotionally, and mentally balanced, and give that happiness back into their homes, workplace, and community. Simply put, our value proposition is that we help our community become a better place to live and work.
5.2 Competitive Edge
Our competitive edge is a combination of our unique services, outstanding location, and our interaction with our clients. By providing our clients a gentleman’s club atmosphere and provide world class services, we build relationships of trust and satisfaction. Our clients will come to depend on our unique services and fulfilling environment.
5.3 Marketing Strategy
Our marketing strategy is the key to our success:
- Emphasize our name and unique services and environment through advertising.
- Focus on the convenience of our location.
- Build community relationships and corporate relationships through unique and quality service, a friendly caring atmosphere, and delivering world class service.
5.3.1 Promotion Strategy
Our promotional strategy will be two-fold: first phase promotion will advertising before, during, and six months following our opening; the second phase advertising will deal with long-term advertising.
- First Phase Promotions
- Advertising
- We will utilize local newspaper, local social magazines, local radio, mail-outs to all households within the immediate 10-mile radius, and mail-outs to all local business within a five-mile radius.
- Internet
- We will have a comprehensive website.
- Alliances
- We will place our brochure within the offices of our corporate referral clients.
- Second Phase Promotions
- Advertising
- We will continue to place ads in the local social magazines year around. Mail-outs will be done again within a 10-mile radius one year after takeoff, then again only every three to five years. Radio and television ads will be done only when we have sale promotions during the most stressful time of the year – the holiday season; television ads are not certain, we will evaluate their effectiveness before further implementation.
- Internet
- We will continue to have a comprehensive website. After the first six months, and certainly after the first year, we will evaluate the viability of having target clients advertise on our site, and conversely, we will evaluate viability of advertising on our target client website (if applicable).
- Alliances
- This type of advertising will be implemented once we have grown beyond our revenue objective. We will also form advertising alliances with any business with whom we share common business goals. We will also implement mutual perks with our business and restaurant neighbors which will aid in local visibility.
5.3.2 Marketing Programs
Owner Cathy Leskie and Jonpaul Leskie will be responsible for marketing Jonpaul’s through the advertising channels. The general manager will be responsible for assisting with the implementation of alliance advertising partnerships. Our advertising budget is $10,000 for the first year. Advertising will begin two weeks prior to opening.
5.3.3 Positioning Statement
We will automatically position ourselves as the top, exclusive gentlemen’s grooming shop in the greater Gigaburb area. Considering that none of the other competitors will offer the range of men’s services that we will, nor that their staffs will be trained like ours, and that there are not any barbershops of our type in our target locations, we will be able to provide services to The Mall populace not currently being tapped.
5.3.4 Pricing Strategy
Our pricing strategy will be similar to that of our competitors. We will not charge over, nor substantially under, standard prices for our services. We will be paying our employees a straight percentage of their total individual client sales plus a bonus–that’s more than our competitors. This will allow us to hire the best employees, and have a built-in motivational factor that will keep them empowered to enhance their opportunity.
5.4 Sales Strategy
- Our umbrella sales strategy is to sell Jonpaul’s to the male professional as a uniquely desirable destination that will enhance their lives.
- We will sell Jonpaul’s through each employee’s skill, courtesy, and warmth, creating a trusting impression on all clients, and establishing loyalty and return visits. We will ensure each visit to Jonpaul’s is a relaxing and memorable experience, so that clients can always depend on our brand of service when they arrive.
5.4.1 Sales Programs
- Our comprehensive brochure will explain the nature of our services, and how this benefits our clients.
- Our website will be comprehensively informative of our services, environment and their benefits.
5.4.2 Sales Forecast
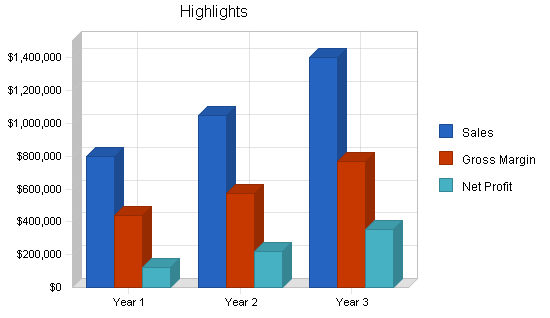
The important elements of the Sales Forecasts are shown in the chart and table below. Initial sales forecast indicate first year revenue of $799,000 increasing to $1.0 million by the end of the second year, then $1.4 million by the end of the third year. These figures are based on revenue from minimum average estimates from barber shop hair styles and additional services, with sales costs reflective of the 45% commission earnings to each barber/therapist.

| Sales Forecast | |||
| Year 1 | Year 2 | Year 3 | |
| Sales | |||
| Barber Shop Hair Only Revenue | $572,880 | $775,680 | $1,080,000 |
| Misc. Service i.e. Shave, Shine, Color etc. | $156,518 | $187,821 | $225,385 |
| Product | $69,726 | $83,671 | $100,040 |
| Total Sales | $799,124 | $1,047,172 | $1,405,425 |
| Direct Cost of Sales | Year 1 | Year 2 | Year 3 |
| Barber Shop Hair Only Revenue | $255,794 | $349,056 | $486,000 |
| Misc. Service i.e. Shave, Shine, Color etc. | $70,429 | $84,519 | $101,423 |
| Product | $34,868 | $41,835 | $50,020 |
| Subtotal Direct Cost of Sales | $361,091 | $475,410 | $637,443 |
5.5 Strategic Alliances
We will form alliances with our referral clients, local restaurants, offices, and businesses who will be strategically beneficial for generating new clients. We will also form alliances with local barber schools and local spas.
5.6 Milestones
The following table lists important store milestones, with dates, implementation duty, and budgets for each. The milestone schedule emphasizes the timeliness for implementation per the sales and marketing targets listed in the detail in the previous topics.

| Milestones | |||||
| Milestone | Start Date | End Date | Budget | Manager | Department |
| Business Plan | 1/1/2002 | 3/1/2002 | $0 | Jp Leskie | Owners |
| Financial Lending | 2/1/2002 | 3/15/2001 | $0 | Jp Leskie | Owners |
| Incorporation | 3/15/2002 | 4/1/2002 | $350 | Jp Leskie | Owners |
| Lease Agreement/Settlement | 3/25/2002 | 4/5/2002 | $0 | Jp Leskie | Owners |
| Leasehold Improvements | 4/5/2002 | 5/30/2002 | $105,000 | Cathy/Jp Leskie | Owners |
| Equipment Order/Installed | 4/15/2002 | 5/30/2002 | $45,000 | Cathy Leskie | Owners |
| Inventory | 5/1/2002 | 5/30/2002 | $10,000 | Cathy Leskie | Owners |
| Logo Design | 3/15/2002 | 5/1/2002 | $1,000 | Cathy/Jp Leskie | Owners |
| Business Cards | 5/1/2002 | 5/15/2002 | $500 | Cathy/Jp Leskie | Owners |
| Brochures | 5/1/2002 | 5/15/2002 | $3,000 | Cathy/Jp Leskie | Owners |
| Staff Hiring/Training | 5/1/2002 | 5/30/2002 | $1,000 | Cathy Leskie | Owners |
| Jonpaul’s Grand Opening | 6/15/2002 | 1/15/2003 | $0 | Cathy/Jp Leskie | Owners |
| Totals | $165,850 | ||||
Management Summary
6.1 Organizational Structure
Our initial team will consist of the owner and 10 employees. On the shop floor, there will be six barbers, one nail specialist, one shoe shine person and one receptionist. Initially there will be one full time combination aesthetician/massage therapist. As our client base grows we will add additional barbers, which then will be working two shifts per day per station. We expect to have 12 employees by the end of the first year and 14 employees in years two and three.
6.2 Management Team
Cathy Leskie, co-owner, president: has 10 years experience in the hair and spa industry. She studied in the U.S. and Europe and continues to stay on top of the latest styles, trends and products. Cathy has worked as a stylist (six years) then as a manager (four years) – managing 16 stylist in a prestigious upscale salon.
Dr. Jonpaul Leskie, co-owner: will not be directly involved in daily operations, but will assist Cathy in general organizational/business planning and operations implementation. Currently Jonpaul is President/CEO of Jp Leskie & Associates, a Technology Consulting Firm. Dr. Leskie is a pioneer and innovator with over 30 years experience in the computer, e-business and telecommunications industry. Dr. Leskie has a proven track record of success in launching new businesses and directing operations for Fortune 500 companies worldwide.
6.3 Management Team Gaps
We believe the experience of our team covers the needs to make the business plan for Jonpaul’s a very successful reality. We will review the current talent of the salon and re-engineer accordingly. We plan on outsourcing payroll and benefits.
6.4 Personnel Plan
The Personnel Plan below reflects our projected need at opening, and carries through the second year expansions.
| Personnel Plan | |||
| Year 1 | Year 2 | Year 3 | |
| Cathy Leskie | $72,000 | $72,000 | $72,000 |
| 100% Commissioned Employees | $150 | $165 | $175 |
| Assistant | $15,360 | $16,500 | $17,500 |
| Receptionist | $15,360 | $16,500 | $17,500 |
| Total People | 12 | 14 | 14 |
| Total Payroll | $102,870 | $105,165 | $107,175 |
Financial Plan
The premier element in our financial plan is initiating, maintaining, and improving the factors that create, stabilize, and increase our cash flow:
- We must create visibility so as to create customer flow.
- We must maintain a dependable, cheerful employee force so as to minimize turnover.
- Create a brisk turnaround on our retail products, always maintaining viable stock levels.
7.1 Important Assumptions
The key underlying assumptions of our financial plan shown in the following general assumption table are:
- We assume access to equity capital and financing to support our financial plan.
- We assume our financial progress based on realistic sales to minimum sales against highest expenses.
- We assume there will not be an economic crash that would greatly hinder our target market’s access to their personal luxury finds.
| General Assumptions | |||
| Year 1 | Year 2 | Year 3 | |
| Plan Month | 1 | 2 | 3 |
| Current Interest Rate | 10.00% | 10.00% | 10.00% |
| Long-term Interest Rate | 8.50% | 8.50% | 8.50% |
| Tax Rate | 30.00% | 30.00% | 30.00% |
| Other | 0 | 0 | 0 |
7.2 Key Financial Indicators
Our most important Key Financial Indicator is when each barber averages seven clients per day and each specialist averages three clients per day.

7.3 Break-even Analysis
For our Break-even Analysis we assume monthly estimated operational costs which include payroll, rent, utilities and other running costs (not including employee draw fund considerations). Payroll alone is only estimated at $9,800 per month, including taxes.
The analysis shows that we need to generate monthly revenues, as shown below, to break even. This total is less than estimated monthly gross. This estimation does not include revenue from any other sources and is based on a barber shop client average of $35 and miscellaneous services average of $50. Our yearly average per client is estimated at $48. Considering our minimal assumptions show a monthly total client average of 1,063, we therefore believe our break-even figures can be readily maintained.

| Break-even Analysis | |
| Monthly Revenue Break-even | $36,989 |
| Assumptions: | |
| Average Percent Variable Cost | 45% |
| Estimated Monthly Fixed Cost | $20,275 |
7.4 Projected Profit and Loss
There are two important assumptions with our Projected Profit and Loss statement:
- Our revenue is based on minimum estimated averages against highest expense expectations.
- Our major expense of rent and utilities is fixed for the next five years.


| Pro Forma Profit and Loss | |||
| Year 1 | Year 2 | Year 3 | |
| Sales | $799,124 | $1,047,172 | $1,405,425 |
| Direct Cost of Sales | $361,091 | $475,410 | $637,443 |
| Other Costs of Goods | $0 | $0 | $0 |
| Total Cost of Sales | $361,091 | $475,410 | $637,443 |
| Gross Margin | $438,033 | $571,762 | $767,982 |
| Gross Margin % | 54.81% | 54.60% | 54.64% |
| Expenses | |||
| Payroll | $102,870 | $105,165 | $107,175 |
| Sales and Marketing and Other Expenses | $20,000 | $15,000 | $20,000 |
| Depreciation | $0 | $0 | $0 |
| Leased Equipment | $0 | $0 | $0 |
| Utilities | $9,000 | $9,000 | $9,000 |
| Insurance | $12,000 | $12,000 | $12,000 |
| Rent | $84,000 | $84,000 | $84,000 |
| Payroll Taxes | $15,431 | $15,775 | $16,076 |
| Other | $0 | $0 | $0 |
| Total Operating Expenses | $243,301 | $240,940 | $248,251 |
| Profit Before Interest and Taxes | $194,733 | $330,822 | $519,731 |
| EBITDA | $194,733 | $330,822 | $519,731 |
| Interest Expense | $18,464 | $17,215 | $15,773 |
| Taxes Incurred | $52,880 | $94,082 | $151,187 |
| Net Profit | $123,388 | $219,525 | $352,770 |
| Net Profit/Sales | 15.44% | 20.96% | 25.10% |
7.5 Projected Cash Flow
Our business is a luxury, retail-oriented business with clients who will pay primarily with credit cards.

| Pro Forma Cash Flow | |||
| Year 1 | Year 2 | Year 3 | |
| Cash Received | |||
| Cash from Operations | |||
| Cash Sales | $799,124 | $1,047,172 | $1,405,425 |
| Subtotal Cash from Operations | $799,124 | $1,047,172 | $1,405,425 |
| Additional Cash Received | |||
| Sales Tax, VAT, HST/GST Received | $0 | $0 | $0 |
| New Current Borrowing | $0 | $0 | $0 |
| New Other Liabilities (interest-free) | $0 | $0 | $0 |
| New Long-term Liabilities | $0 | $0 | $0 |
| Sales of Other Current Assets | $0 | $0 | $0 |
| Sales of Long-term Assets | $0 | $0 | $0 |
| New Investment Received | $10,000 | $0 | $0 |
| Subtotal Cash Received | $809,124 | $1,047,172 | $1,405,425 |
| Expenditures | Year 1 | Year 2 | Year 3 |
| Expenditures from Operations | |||
| Cash Spending | $102,870 | $105,165 | $107,175 |
| Bill Payments | $548,021 | $728,194 | $944,200 |
| Subtotal Spent on Operations | $650,891 | $833,359 | $1,051,375 |
| Additional Cash Spent | |||
| Sales Tax, VAT, HST/GST Paid Out | $0 | $0 | $0 |
| Principal Repayment of Current Borrowing | $0 | $0 | $0 |
| Other Liabilities Principal Repayment | $0 | $0 | $0 |
| Long-term Liabilities Principal Repayment | $14,351 | $16,242 | $17,678 |
| Purchase Other Current Assets | $0 | $0 | $0 |
| Purchase Long-term Assets | $0 | $0 | $0 |
| Dividends | $0 | $0 | $0 |
| Subtotal Cash Spent | $665,242 | $849,601 | $1,069,053 |
| Net Cash Flow | $143,882 | $197,571 | $336,372 |
| Cash Balance | $183,882 | $381,453 | $717,825 |
7.6 Projected Balance Sheet
Our Projected Balance Sheet shows we will not have any difficulty meeting our debt obligations as long as our revenue projections are met.
| Pro Forma Balance Sheet | |||
| Year 1 | Year 2 | Year 3 | |
| Assets | |||
| Current Assets | |||
| Cash | $183,882 | $381,453 | $717,825 |
| Inventory | $38,936 | $51,262 | $68,734 |
| Other Current Assets | $38,000 | $38,000 | $38,000 |
| Total Current Assets | $260,817 | $470,715 | $824,559 |
| Long-term Assets | |||
| Long-term Assets | $0 | $0 | $0 |
| Accumulated Depreciation | $0 | $0 | $0 |
| Total Long-term Assets | $0 | $0 | $0 |
| Total Assets | $260,817 | $470,715 | $824,559 |
| Liabilities and Capital | Year 1 | Year 2 | Year 3 |
| Current Liabilities | |||
| Accounts Payable | $53,781 | $60,395 | $79,147 |
| Current Borrowing | $0 | $0 | $0 |
| Other Current Liabilities | $25,500 | $25,500 | $25,500 |
| Subtotal Current Liabilities | $79,281 | $85,895 | $104,647 |
| Long-term Liabilities | $210,649 | $194,407 | $176,729 |
| Total Liabilities | $289,930 | $280,302 | $281,376 |
| Paid-in Capital | $10,000 | $10,000 | $10,000 |
| Retained Earnings | ($162,500) | ($39,112) | $180,413 |
| Earnings | $123,388 | $219,525 | $352,770 |
| Total Capital | ($29,112) | $190,413 | $543,183 |
| Total Liabilities and Capital | $260,817 | $470,715 | $824,559 |
| Net Worth | ($29,112) | $190,413 | $543,183 |
7.7 Business Ratios
The following table contains important business ratios for the barber shop industry, as determined by the Standard Industry Classification (SIC) code, 7241.
| Ratio Analysis | ||||
| Year 1 | Year 2 | Year 3 | Industry Profile | |
| Sales Growth | 0.00% | 31.04% | 34.21% | 10.40% |
| Percent of Total Assets | ||||
| Inventory | 14.93% | 10.89% | 8.34% | 4.60% |
| Other Current Assets | 14.57% | 8.07% | 4.61% | 36.80% |
| Total Current Assets | 100.00% | 100.00% | 100.00% | 53.10% |
| Long-term Assets | 0.00% | 0.00% | 0.00% | 46.90% |
| Total Assets | 100.00% | 100.00% | 100.00% | 100.00% |
| Current Liabilities | 30.40% | 18.25% | 12.69% | 29.70% |
| Long-term Liabilities | 80.76% | 41.30% | 21.43% | 24.70% |
| Total Liabilities | 111.16% | 59.55% | 34.12% | 54.40% |
| Net Worth | -11.16% | 40.45% | 65.88% | 45.60% |
| Percent of Sales | ||||
| Sales | 100.00% | 100.00% | 100.00% | 100.00% |
| Gross Margin | 54.81% | 54.60% | 54.64% | 0.00% |
| Selling, General & Administrative Expenses | 39.37% | 33.64% | 29.54% | 69.20% |
| Advertising Expenses | 1.00% | 0.00% | 0.00% | 2.50% |
| Profit Before Interest and Taxes | 24.37% | 31.59% | 36.98% | 4.30% |
| Main Ratios | ||||
| Current | 3.29 | 5.48 | 7.88 | 2.08 |
| Quick | 2.80 | 4.88 | 7.22 | 1.55 |
| Total Debt to Total Assets | 111.16% | 59.55% | 34.12% | 54.40% |
| Pre-tax Return on Net Worth | -605.48% | 164.70% | 92.78% | 6.90% |
| Pre-tax Return on Assets | 67.58% | 66.62% | 61.12% | 15.20% |
| Additional Ratios | Year 1 | Year 2 | Year 3 | |
| Net Profit Margin | 15.44% | 20.96% | 25.10% | n.a |
| Return on Equity | 0.00% | 115.29% | 64.94% | n.a |
| Activity Ratios | ||||
| Inventory Turnover | 10.91 | 10.54 | 10.62 | n.a |
| Accounts Payable Turnover | 11.19 | 12.17 | 12.17 | n.a |
| Payment Days | 27 | 28 | 26 | n.a |
| Total Asset Turnover | 3.06 | 2.22 | 1.70 | n.a |
| Debt Ratios | ||||
| Debt to Net Worth | 0.00 | 1.47 | 0.52 | n.a |
| Current Liab. to Liab. | 0.27 | 0.31 | 0.37 | n.a |
| Liquidity Ratios | ||||
| Net Working Capital | $181,537 | $384,820 | $719,912 | n.a |
| Interest Coverage | 10.55 | 19.22 | 32.95 | n.a |
| Additional Ratios | ||||
| Assets to Sales | 0.33 | 0.45 | 0.59 | n.a |
| Current Debt/Total Assets | 30% | 18% | 13% | n.a |
| Acid Test | 2.80 | 4.88 | 7.22 | n.a |
| Sales/Net Worth | 0.00 | 5.50 | 2.59 | n.a |
| Dividend Payout | 0.00 | 0.00 | 0.00 | n.a |
Appendix
| Sales Forecast | |||||||||||||
| Month 1 | Month 2 | Month 3 | Month 4 | Month 5 | Month 6 | Month 7 | Month 8 | Month 9 | Month 10 | Month 11 | Month 12 | ||
| Sales | |||||||||||||
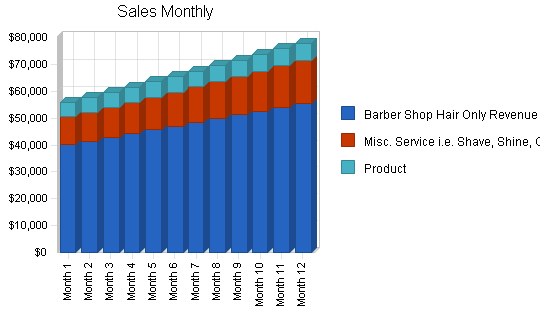
| Barber Shop Hair Only Revenue | 0% | $40,040 | $41,440 | $42,840 | $44,240 | $45,640 | $47,040 | $48,440 | $49,840 | $51,240 | $52,640 | $54,040 | $55,440 |
| Misc. Service i.e. Shave, Shine, Color etc. | 0% | $10,417 | $10,833 | $11,267 | $11,717 | $12,186 | $12,673 | $13,180 | $13,708 | $14,256 | $14,826 | $15,419 | $16,036 |
| Product | 0% | $5,200 | $5,304 | $5,410 | $5,518 | $5,628 | $5,728 | $5,856 | $5,973 | $6,092 | $6,214 | $6,338 | $6,465 |
| Total Sales | $55,657 | $57,577 | $59,517 | $61,475 | $63,454 | $65,441 | $67,476 | $69,521 | $71,588 | $73,680 | $75,797 | $77,941 | |
| Direct Cost of Sales | Month 1 | Month 2 | Month 3 | Month 4 | Month 5 | Month 6 | Month 7 | Month 8 | Month 9 | Month 10 | Month 11 | Month 12 | |
| Barber Shop Hair Only Revenue | $16,016 | $18,648 | $19,278 | $19,908 | $20,538 | $21,168 | $21,798 | $22,428 | $23,058 | $23,688 | $24,318 | $24,948 | |
| Misc. Service i.e. Shave, Shine, Color etc. | $4,687 | $4,875 | $5,070 | $5,272 | $5,483 | $5,703 | $5,931 | $6,168 | $6,415 | $6,671 | $6,938 | $7,216 | |
| Product | $2,600 | $2,652 | $2,705 | $2,759 | $2,814 | $2,870 | $2,928 | $2,986 | $3,046 | $3,107 | $3,169 | $3,232 | |
| Subtotal Direct Cost of Sales | $23,303 | $26,175 | $27,053 | $27,939 | $28,835 | $29,741 | $30,657 | $31,582 | $32,519 | $33,466 | $34,425 | $35,396 | |
| Personnel Plan | |||||||||||||
| Month 1 | Month 2 | Month 3 | Month 4 | Month 5 | Month 6 | Month 7 | Month 8 | Month 9 | Month 10 | Month 11 | Month 12 | ||
| Cathy Leskie | 0% | $6,000 | $6,000 | $6,000 | $6,000 | $6,000 | $6,000 | $6,000 | $6,000 | $6,000 | $6,000 | $6,000 | $6,000 |
| 100% Commissioned Employees | 0% | $10 | $10 | $13 | $13 | $13 | $13 | $13 | $13 | $13 | $13 | $13 | $13 |
| Assistant | 0% | $1,280 | $1,280 | $1,280 | $1,280 | $1,280 | $1,280 | $1,280 | $1,280 | $1,280 | $1,280 | $1,280 | $1,280 |
| Receptionist | 0% | $1,280 | $1,280 | $1,280 | $1,280 | $1,280 | $1,280 | $1,280 | $1,280 | $1,280 | $1,280 | $1,280 | $1,280 |
| Total People | 11 | 11 | 11 | 11 | 11 | 12 | 12 | 12 | 12 | 12 | 12 | 12 | |
| Total Payroll | $8,570 | $8,570 | $8,573 | $8,573 | $8,573 | $8,573 | $8,573 | $8,573 | $8,573 | $8,573 | $8,573 | $8,573 | |
| General Assumptions | |||||||||||||
| Month 1 | Month 2 | Month 3 | Month 4 | Month 5 | Month 6 | Month 7 | Month 8 | Month 9 | Month 10 | Month 11 | Month 12 | ||
| Plan Month | 1 | 2 | 3 | 4 | 5 | 6 | 7 | 8 | 9 | 10 | 11 | 12 | |
| Current Interest Rate | 10.00% | 10.00% | 10.00% | 10.00% | 10.00% | 10.00% | 10.00% | 10.00% | 10.00% | 10.00% | 10.00% | 10.00% | |
| Long-term Interest Rate | 8.50% | 8.50% | 8.50% | 8.50% | 8.50% | 8.50% | 8.50% | 8.50% | 8.50% | 8.50% | 8.50% | 8.50% | |
| Tax Rate | 30.00% | 30.00% | 30.00% | 30.00% | 30.00% | 30.00% | 30.00% | 30.00% | 30.00% | 30.00% | 30.00% | 30.00% | |
| Other | 0 | 0 | 0 | 0 | 0 | 0 | 0 | 0 | 0 | 0 | 0 | 0 | |
| Pro Forma Profit and Loss | |||||||||||||
| Month 1 | Month 2 | Month 3 | Month 4 | Month 5 | Month 6 | Month 7 | Month 8 | Month 9 | Month 10 | Month 11 | Month 12 | ||
| Sales | $55,657 | $57,577 | $59,517 | $61,475 | $63,454 | $65,441 | $67,476 | $69,521 | $71,588 | $73,680 | $75,797 | $77,941 | |
| Direct Cost of Sales | $23,303 | $26,175 | $27,053 | $27,939 | $28,835 | $29,741 | $30,657 | $31,582 | $32,519 | $33,466 | $34,425 | $35,396 | |
| Other Costs of Goods | $0 | $0 | $0 | $0 | $0 | $0 | $0 | $0 | $0 | $0 | $0 | $0 | |
| Total Cost of Sales | $23,303 | $26,175 | $27,053 | $27,939 | $28,835 | $29,741 | $30,657 | $31,582 | $32,519 | $33,466 | $34,425 | $35,396 | |
| Gross Margin | $32,354 | $31,402 | $32,464 | $33,536 | $34,619 | $35,700 | $36,819 | $37,939 | $39,069 | $40,214 | $41,372 | $42,545 | |
| Gross Margin % | 58.13% | 54.54% | 54.55% | 54.55% | 54.56% | 54.55% | 54.57% | 54.57% | 54.57% | 54.58% | 54.58% | 54.59% | |
| Expenses | |||||||||||||
| Payroll | $8,570 | $8,570 | $8,573 | $8,573 | $8,573 | $8,573 | $8,573 | $8,573 | $8,573 | $8,573 | $8,573 | $8,573 | |
| Sales and Marketing and Other Expenses | $4,000 | $1,300 | $1,300 | $1,300 | $1,300 | $1,300 | $1,300 | $1,300 | $3,000 | $1,300 | $1,300 | $1,300 | |
| Depreciation | $0 | $0 | $0 | $0 | $0 | $0 | $0 | $0 | $0 | $0 | $0 | $0 | |
| Leased Equipment | $0 | $0 | $0 | $0 | $0 | $0 | $0 | $0 | $0 | $0 | $0 | $0 | |
| Utilities | $750 | $750 | $750 | $750 | $750 | $750 | $750 | $750 | $750 | $750 | $750 | $750 | |
| Insurance | $1,000 | $1,000 | $1,000 | $1,000 | $1,000 | $1,000 | $1,000 | $1,000 | $1,000 | $1,000 | $1,000 | $1,000 | |
| Rent | $7,000 | $7,000 | $7,000 | $7,000 | $7,000 | $7,000 | $7,000 | $7,000 | $7,000 | $7,000 | $7,000 | $7,000 | |
| Payroll Taxes | 15% | $1,286 | $1,286 | $1,286 | $1,286 | $1,286 | $1,286 | $1,286 | $1,286 | $1,286 | $1,286 | $1,286 | $1,286 |
| Other | $0 | $0 | $0 | $0 | $0 | $0 | $0 | $0 | $0 | $0 | $0 | $0 | |
| Total Operating Expenses | $22,606 | $19,906 | $19,909 | $19,909 | $19,909 | $19,909 | $19,909 | $19,909 | $21,609 | $19,909 | $19,909 | $19,909 | |
| Profit Before Interest and Taxes | $9,749 | $11,497 | $12,555 | $13,627 | $14,710 | $15,791 | $16,910 | $18,030 | $17,460 | $20,305 | $21,463 | $22,636 | |
| EBITDA | $9,749 | $11,497 | $12,555 | $13,627 | $14,710 | $15,791 | $16,910 | $18,030 | $17,460 | $20,305 | $21,463 | $22,636 | |
| Interest Expense | $1,585 | $1,577 | $1,568 | $1,560 | $1,551 | $1,543 | $1,534 | $1,526 | $1,518 | $1,509 | $1,501 | $1,492 | |
| Taxes Incurred | $2,449 | $2,976 | $3,296 | $3,620 | $3,948 | $4,274 | $4,613 | $4,951 | $4,783 | $5,639 | $5,989 | $6,343 | |
| Net Profit | $5,714 | $6,944 | $7,691 | $8,447 | $9,211 | $9,974 | $10,763 | $11,553 | $11,160 | $13,157 | $13,974 | $14,801 | |
| Net Profit/Sales | 10.27% | 12.06% | 12.92% | 13.74% | 14.52% | 15.24% | 15.95% | 16.62% | 15.59% | 17.86% | 18.44% | 18.99% | |
| Pro Forma Cash Flow | |||||||||||||
| Month 1 | Month 2 | Month 3 | Month 4 | Month 5 | Month 6 | Month 7 | Month 8 | Month 9 | Month 10 | Month 11 | Month 12 | ||
| Cash Received | |||||||||||||
| Cash from Operations | |||||||||||||
| Cash Sales | $55,657 | $57,577 | $59,517 | $61,475 | $63,454 | $65,441 | $67,476 | $69,521 | $71,588 | $73,680 | $75,797 | $77,941 | |
| Subtotal Cash from Operations | $55,657 | $57,577 | $59,517 | $61,475 | $63,454 | $65,441 | $67,476 | $69,521 | $71,588 | $73,680 | $75,797 | $77,941 | |
| Additional Cash Received | |||||||||||||
| Sales Tax, VAT, HST/GST Received | 0.00% | $0 | $0 | $0 | $0 | $0 | $0 | $0 | $0 | $0 | $0 | $0 | $0 |
| New Current Borrowing | $0 | $0 | $0 | $0 | $0 | $0 | $0 | $0 | $0 | $0 | $0 | $0 | |
| New Other Liabilities (interest-free) | $0 | $0 | $0 | $0 | $0 | $0 | $0 | $0 | $0 | $0 | $0 | $0 | |
| New Long-term Liabilities | $0 | $0 | $0 | $0 | $0 | $0 | $0 | $0 | $0 | $0 | $0 | $0 | |
| Sales of Other Current Assets | $0 | $0 | $0 | $0 | $0 | $0 | $0 | $0 | $0 | $0 | $0 | $0 | |
| Sales of Long-term Assets | $0 | $0 | $0 | $0 | $0 | $0 | $0 | $0 | $0 | $0 | $0 | $0 | |
| New Investment Received | $0 | $10,000 | $0 | $0 | $0 | $0 | $0 | $0 | $0 | $0 | $0 | $0 | |
| Subtotal Cash Received | $55,657 | $67,577 | $59,517 | $61,475 | $63,454 | $65,441 | $67,476 | $69,521 | $71,588 | $73,680 | $75,797 | $77,941 | |
| Expenditures | Month 1 | Month 2 | Month 3 | Month 4 | Month 5 | Month 6 | Month 7 | Month 8 | Month 9 | Month 10 | Month 11 | Month 12 | |
| Expenditures from Operations | |||||||||||||
| Cash Spending | $8,570 | $8,570 | $8,573 | $8,573 | $8,573 | $8,573 | $8,573 | $8,573 | $8,573 | $8,573 | $8,573 | $8,573 | |
| Bill Payments | $1,900 | $56,613 | $45,189 | $44,259 | $45,470 | $46,697 | $47,933 | $49,190 | $50,495 | $52,889 | $53,035 | $54,350 | |
| Subtotal Spent on Operations | $10,470 | $65,183 | $53,762 | $52,832 | $54,043 | $55,270 | $56,506 | $57,763 | $59,068 | $61,462 | $61,608 | $62,923 | |
| Additional Cash Spent | |||||||||||||
| Sales Tax, VAT, HST/GST Paid Out | $0 | $0 | $0 | $0 | $0 | $0 | $0 | $0 | $0 | $0 | $0 | $0 | |
| Principal Repayment of Current Borrowing | $0 | $0 | $0 | $0 | $0 | $0 | $0 | $0 | $0 | $0 | $0 | $0 | |
| Other Liabilities Principal Repayment | $0 | $0 | $0 | $0 | $0 | $0 | $0 | $0 | $0 | $0 | $0 | $0 | |
| Long-term Liabilities Principal Repayment | $1,196 | $1,196 | $1,196 | $1,196 | $1,196 | $1,196 | $1,196 | $1,196 | $1,196 | $1,196 | $1,196 | $1,196 | |
| Purchase Other Current Assets | $0 | $0 | $0 | $0 | $0 | $0 | $0 | $0 | $0 | $0 | $0 | $0 | |
| Purchase Long-term Assets | $0 | $0 | $0 | $0 | $0 | $0 | $0 | $0 | $0 | $0 | $0 | $0 | |
| Dividends | $0 | $0 | $0 | $0 | $0 | $0 | $0 | $0 | $0 | $0 | $0 | $0 | |
| Subtotal Cash Spent | $11,666 | $66,379 | $54,958 | $54,028 | $55,239 | $56,466 | $57,702 | $58,959 | $60,264 | $62,658 | $62,804 | $64,118 | |
| Net Cash Flow | $43,991 | $1,198 | $4,559 | $7,447 | $8,215 | $8,975 | $9,774 | $10,562 | $11,324 | $11,022 | $12,993 | $13,823 | |
| Cash Balance | $83,991 | $85,189 | $89,748 | $97,194 | $105,409 | $114,384 | $124,159 | $134,721 | $146,045 | $157,066 | $170,059 | $183,882 | |
| Pro Forma Balance Sheet | |||||||||||||
| Month 1 | Month 2 | Month 3 | Month 4 | Month 5 | Month 6 | Month 7 | Month 8 | Month 9 | Month 10 | Month 11 | Month 12 | ||
| Assets | Starting Balances | ||||||||||||
| Current Assets | |||||||||||||
| Cash | $40,000 | $83,991 | $85,189 | $89,748 | $97,194 | $105,409 | $114,384 | $124,159 | $134,721 | $146,045 | $157,066 | $170,059 | $183,882 |
| Inventory | $10,000 | $25,633 | $28,793 | $29,758 | $30,733 | $31,719 | $32,715 | $33,723 | $34,740 | $35,771 | $36,813 | $37,868 | $38,936 |
| Other Current Assets | $38,000 | $38,000 | $38,000 | $38,000 | $38,000 | $38,000 | $38,000 | $38,000 | $38,000 | $38,000 | $38,000 | $38,000 | $38,000 |
| Total Current Assets | $88,000 | $147,624 | $151,981 | $157,506 | $165,927 | $175,128 | $185,099 | $195,881 | $207,461 | $219,816 | $231,879 | $245,927 | $260,817 |
| Long-term Assets | |||||||||||||
| Long-term Assets | $0 | $0 | $0 | $0 | $0 | $0 | $0 | $0 | $0 | $0 | $0 | $0 | $0 |
| Accumulated Depreciation | $0 | $0 | $0 | $0 | $0 | $0 | $0 | $0 | $0 | $0 | $0 | $0 | $0 |
| Total Long-term Assets | $0 | $0 | $0 | $0 | $0 | $0 | $0 | $0 | $0 | $0 | $0 | $0 | $0 |
| Total Assets | $88,000 | $147,624 | $151,981 | $157,506 | $165,927 | $175,128 | $185,099 | $195,881 | $207,461 | $219,816 | $231,879 | $245,927 | $260,817 |
| Liabilities and Capital | Month 1 | Month 2 | Month 3 | Month 4 | Month 5 | Month 6 | Month 7 | Month 8 | Month 9 | Month 10 | Month 11 | Month 12 | |
| Current Liabilities | |||||||||||||
| Accounts Payable | $0 | $55,106 | $43,715 | $42,745 | $43,915 | $45,100 | $46,295 | $47,509 | $48,732 | $51,123 | $51,225 | $52,495 | $53,781 |
| Current Borrowing | $0 | $0 | $0 | $0 | $0 | $0 | $0 | $0 | $0 | $0 | $0 | $0 | $0 |
| Other Current Liabilities | $25,500 | $25,500 | $25,500 | $25,500 | $25,500 | $25,500 | $25,500 | $25,500 | $25,500 | $25,500 | $25,500 | $25,500 | $25,500 |
| Subtotal Current Liabilities | $25,500 | $80,606 | $69,215 | $68,245 | $69,415 | $70,600 | $71,795 | $73,009 | $74,232 | $76,623 | $76,725 | $77,995 | $79,281 |
| Long-term Liabilities | $225,000 | $223,804 | $222,608 | $221,412 | $220,216 | $219,020 | $217,824 | $216,628 | $215,433 | $214,237 | $213,041 | $211,845 | $210,649 |
| Total Liabilities | $250,500 | $304,410 | $291,823 | $289,657 | $289,632 | $289,621 | $289,619 | $289,638 | $289,665 | $290,860 | $289,766 | $289,840 | $289,930 |
| Paid-in Capital | $0 | $0 | $10,000 | $10,000 | $10,000 | $10,000 | $10,000 | $10,000 | $10,000 | $10,000 | $10,000 | $10,000 | $10,000 |
| Retained Earnings | ($162,500) | ($162,500) | ($162,500) | ($162,500) | ($162,500) | ($162,500) | ($162,500) | ($162,500) | ($162,500) | ($162,500) | ($162,500) | ($162,500) | ($162,500) |
| Earnings | $0 | $5,714 | $12,658 | $20,349 | $28,796 | $38,007 | $47,981 | $58,743 | $70,296 | $81,456 | $94,613 | $108,587 | $123,388 |
| Total Capital | ($162,500) | ($156,786) | ($139,842) | ($132,151) | ($123,704) | ($114,493) | ($104,519) | ($93,757) | ($82,204) | ($71,044) | ($57,887) | ($43,913) | ($29,112) |
| Total Liabilities and Capital | $88,000 | $147,624 | $151,981 | $157,506 | $165,927 | $175,128 | $185,099 | $195,881 | $207,461 | $219,816 | $231,879 | $245,927 | $260,817 |
| Net Worth | ($162,500) | ($156,786) | ($139,842) | ($132,151) | ($123,704) | ($114,493) | ($104,519) | ($93,757) | ($82,204) | ($71,044) | ($57,887) | ($43,913) | ($29,112) |

