
Sunapto
Executive Summary
Sunapto will manufacture and market an automated pill dispensing unit, the MedCabinet and a companion monitoring service to fill the medication compliance problem in the United States. The elderly often have multiple disease states and/or chronic conditions and consume an average of four to five prescription drugs and two over-the-counter drugs per day. Nearly 67% of all elderly patients fail to follow important dosage instructions for their medications. The risk of hospitalization due to adverse medication outcomes in elderly patients is almost 6 times greater than that for the general population.
Sunapto’s mission is to provide people the opportunity to live better and healthier lives though the use of technology. They will provide medical systems for the home that will use patentable technology to ensure safety, ease of use and a continuous partnership with healthcare providers. Their target market is the 65 and over age group. Thirty-five million Americans are in this group and the group is growing at 1% per year. They intend to grow the business and to establish their brand as a product leader and innovator in home healthcare devices.
Sunapto’s marketing strategy will follow from industry/trade and physician/pharmacist awareness campaigns to specific executions directed at specific customer segments. Sunapto’s initial sales strategy is to sell the MedCabinet directly to consumers. The MedCabinet is projected to sell for $700 and will provide medication users with the right pill at the right time.
Sunapto faces competition in the medication compliance market from reminder devices, automated medication dispensers and compliance services. The closest competitor to be considered is a similar product in the automated medication dispenser and compliance service market. Its weaknesses are its cost, limited dosing events and its weak marketing and distribution channels. This makes it vulnerable to a new, improved entry.
Sunapto is in the pre-start-up stage. Sunapto will be formed as a start-up LLC in MidWest, USA. The management team has experience in growth-oriented technology, business unit development, finance, and team leadership and development. Having witnessed the problems of medication compliance in their families, the management team is committed to being part of the solution that addresses the compliance issue that plagues the elderly. Sunapto is looking to add sales, marketing and medical device product development experience to its management team.
The MedCabinet is in the concept development stage. Sunapto anticipates having a working prototype five months after plan initiation and for sales to begin 12 months after plan initiation. Initial sales projections are 11,077 units during Year 2 and 13,419 units during Year 3.
Sunapto needs substantial investment to bring the MedCabinet to market. They anticipate two rounds of financing. The founders have pledged personal financial contribution for Round 1. Sunapto is seeking additional outside investors before launching the company. These funds will be used for management team gaps, prototype development and initial product marketing expenses. They anticipate Round 1 outside investors to realize a healthy return per annum over three years. Round 2 funding will be needed during the seventh month of operations. Round 2 funds will be used for management team gaps, prototype to product development, product marketing and for their contract manufacturing production expenses. Sunapto anticipates Round 2 outside investors to realize a respectable return per annum over three years.
1.1 Mission
Sunapto is a home healthcare technology company dedicated to enhancing peoples’ lives by bringing healthcare home. Sunapto provides home medical systems. These systems use technology to ensure safety, ease of use, an independent lifestyle and a continuous partnership with healthcare providers. Sunapto intends to seek a fair, yet aggressive profit, which will allow the company to be financially healthy for the long term as well as provide compensation to both owners and investors for their money and risk. They intend to grow the business and to establish their brand as a product leader and innovator in home healthcare devices. They intend to finance continued growth through a combination of equity investment and internally generated cash flow. Sunapto will continue to develop new product extensions once their marketing platform is established. Sunapto will maintain a strong and cohesive work environment with a shared ethos and a passion to grow with the intensity that only comes from belief.
1.2 Keys to Success
The keys to success for Sunapto are:
- Product Quality: A safe, reliable, easy to use product consisting of a well engineered design, quality workmanship, easy to follow programming, accurate dispensing and uncomplicated use.
- Marketing: Once a quality product is available, the success of Sunapto rests in the marketing venue. The MedCabinet is a new product and consumers must be educated to gain market penetration in a market comprised of people that often have a harder time accepting new technology.
- Partnerships: Sunapto is a management/marketing/technology company, not a manufacturing company. They will rely on partners to produce and deliver the product. The establishment and maintenance of partnerships will be crucial.
- Philosophy: Sunapto is in business to earn a higher than normal return for its business partners. In order to achieve this they will take a balanced approach in guiding the company. Sunapto will not be driven blindly from the financial perspective, but will be guided by four perspectives: Financial, Customer, Internal Process, and Learning & Growth.
1.3 Objectives
- Increase sales to more than 24,000 MedCabinet units by Year 3.
- Seven percent of units subscribed to monitoring and notification service by Year 3.
Company Summary
Sunapto will be a start-up Limited Liability Company (LLC) located in MidWest, USA. Sunapto will manufacture and market the MedCabinet automatic pill dispenser, targeting the 65 and over market segments. Initial market research has been completed and this business plan will serve as the framework for bringing their product to market.
Sunapto is in the development stage and its proposed operations are subject to all the risks inherent in the establishment of a new business enterprise, including the absence of an operating history. The likelihood of Sunapto’s success must be considered in light of the problems, expenses, difficulties, complications and delays frequently encountered in connection with the formation of a new business, and the competitive and regulatory environment in which Sunapto will operate. Although forecast revenues and expenses are set forth in this Plan, the actual amounts may vary substantially from those projected and no assurance can be made that the results forecasted in this Plan will be achieved.
2.1 Start-up Summary
Sunapto’s start-up costs are expected to be minimal. They will be mostly stationery, legal costs, and expenses associated with opening their first office. The start-up costs are to be financed by direct owner investment. The assumptions are shown in the Start-up Table.

| Start-up | |
| Requirements | |
| Start-up Expenses | |
| Legal | $2,000 |
| Stationery etc. | $500 |
| Brochures | $0 |
| Consultants | $0 |
| Insurance | $0 |
| Rent | $0 |
| Research and Development | $0 |
| Expensed Equipment | $0 |
| Other | $213 |
| Total Start-up Expenses | $2,713 |
| Start-up Assets | |
| Cash Required | $470,000 |
| Start-up Inventory | $0 |
| Other Current Assets | $0 |
| Long-term Assets | $0 |
| Total Assets | $470,000 |
| Total Requirements | $472,713 |
| Start-up Funding | |
| Start-up Expenses to Fund | $2,713 |
| Start-up Assets to Fund | $470,000 |
| Total Funding Required | $472,713 |
| Assets | |
| Non-cash Assets from Start-up | $0 |
| Cash Requirements from Start-up | $470,000 |
| Additional Cash Raised | $0 |
| Cash Balance on Starting Date | $470,000 |
| Total Assets | $470,000 |
| Liabilities and Capital | |
| Liabilities | |
| Current Borrowing | $0 |
| Long-term Liabilities | $0 |
| Accounts Payable (Outstanding Bills) | $0 |
| Other Current Liabilities (interest-free) | $0 |
| Total Liabilities | $0 |
| Capital | |
| Planned Investment | |
| John P. Brush | $2,713 |
| Founders | $50,000 |
| Round 1 Investors | $420,000 |
| Other | $0 |
| Additional Investment Requirement | $0 |
| Total Planned Investment | $472,713 |
| Loss at Start-up (Start-up Expenses) | ($2,713) |
| Total Capital | $470,000 |
| Total Capital and Liabilities | $470,000 |
| Total Funding | $472,713 |

2.2 Company Ownership
It is anticipated that Sunapto will be structured as an LLC in MidWest, USA. Ownership will be distributed amongst the founding partners. The founders intend to sell limited ownership to outside private investors in external financing rounds.
2.3 Company Locations and Facilities
Sunapto is presently operated out of the home of the founder. Relocation to office space in the greater MidWest, USA area is anticipated at the realization of this business plan. Initially, the office space will be small to serve management of marketing functions, sales/ordering processing and technical development. As Sunapto adds employees, they will take on additional office space. Sunapto expects that space will be available in the future location.
Sunapto will conduct a search for a contract manufacturer for the MedCabinet. The contract manufacturer will initially handle distribution. Orders will be drop shipped from the plant. This eliminates the need to invest in distribution space at the outset.
Products and Services
Sunapto will initially develop and market one product and two companion services to enhance the product.
- MedCabinet, an automatic pill dispensing system. Its purpose is to facilitate medication compliance/adherence and alleviate other common problems with medication usage in the home, such as double dosing, losing pills and forgetting to take pills. The MedCabinet will dispense the correct medication at the right time, and will notify the user.
- MedCabinet Monitoring Service provides secure website access to details about the MedCabinet’s dispensing activities.
- MedCabinet Notification Service provides caregiver notification of events that may disrupt the MedCabinet’s dispensing activity or the user’s medication compliance.
The technology used in the MedCabinet will contain items subject to patent protection.
3.1 Product and Service Description
A detailed and technical description of Sunapto’s initial product and service line follows:
MedCabinet
The MedCabinet is an automatic pill dispensing system. The MedCabinet will dispense the correct medication at the right time, and will notify the user of the medication’s availability. The MedCabinet provides protection against both serious and minor complications caused by drug-related problems, especially in the elderly. The MedCabinet is a single user product and is not intended to dispense medications to multiple users.
The MedCabinet has some specific safety features. The medications in the MedCabinet are secured under lock and key. In the case of a caregiver, this protects the medications from tampering by the person under care. In all instances, this protects the medications from unauthorized access from others. The MedCabinet has a battery backup system to ensure proper dispensing during a power outage.
The U.S. Food and Drug Administration (FDA) – Center for Devices and Radiological Health (CDRH) monitors and controls medical devices. It is expected that the FDA will classify the MedCabinet as a class I device. The FDA requires a manufacturer to register its class I device but it does not require a premarket notification application or a clearance from the FDA before marketing the device. As required by the FDA, the MedCabinet will be registered 30 days before manufacturing starts.
MedCabinet Monitor Service
The MedCabinet monitor service allows third parties to monitor the product’s dispensing activity. The monitoring activity is accessible by secure Web access.
MedCabinet Notification Service
The MedCabinet notification service allows third parties to be notified if a significant event occurs in the product’s dispensing activity. The notification service supports notifications by e-mail, telephone, fax or pager. This service can be configured to contact the user in addition to third parties.
3.2 Competitive Comparison
There are two options for organizing daily medications: the traditional weekly plastic pillbox and an electronic version of the weekly pillbox. Both options rely on someone manually separating the pills into the proper location and do not account for multiple medications that are consumed at different intervals.
If someone is having trouble remembering to take their medications, a number of compliance aids are available; ranging from simple pillboxes to services that will call to remind them to take their pills.
- Daily or weekly pillboxes permit distribution of medications into individual compartments based on the time of day the pills are to be taken. These can be obtained from a pharmacist – sometimes free.
- Various electronic devices are available, including stands and caps that fit on the bottle and clocks or watches that can be set to alert a user when it is time to take their medicine.
- Automated dispensers will meter out pills and alert a user to take them.
- Computer programs and pagers are available to remind a user of medication times.
- Some pharmacies and home health agencies offer telephone reminder services.
The cost varies widely – from zero for free pillboxes to several hundred dollars for automated dispensers and reminder services.
The closest product to the MedCabinet is the MED-Pharmacy II, or MP.2, developed by Home Medical Services LLC.
3.3 Fulfillment
Sunapto is a technology company that develops product concepts, and supplies the intelligence to these products in the form of software development. The establishment and maintenance of a partnership to manufacture their products will be crucial. There are multiple contract manufacturers in the marketplace. Sunapto will look to form a partnership with one of these manufacturers to develop and produce the MedCabinet. Some of the essential attributes that the partner Sunapto selects will have are listed below.
- Experience in the medical device field.
- Experience dealing with the FDA.
- Product development capabilities from product design/engineering to design for manufacturability.
- Manufacturing.
- Order Fulfillment.
- Distribution.
- Depot and Repair.
3.4 Technology
Technology affects Sunapto, its manufacturing partner and the MedCabinet in a variety of ways. As mentioned in the Fulfillment section, the contract manufacturer plays a crucial role in Sunapto’s success. A part of the evaluation of their contract manufacturer will be how the manufacturer monitors and implements changes in manufacturing technology.
The MedCabinet will use both hardware and software technology to perform its function. The technology chosen in these areas will be carefully selected to match a determined price and performance point. The technology in the MedCabinet will be updated as needed to keep a competitive price and performance point, but it is not anticipated to change as rapidly as today’s technology market.
The companion monitoring and notification service for the MedCabinet relies on Internet and database technologies. As changes occur in these technologies, Sunapto will incorporate these changes to benefit their customers.
The MedCabinet will contain patentable items that will require proper filings by a registered patent attorney once created. Utility patents currently provide owners of the patent a 20-year window from the time of filing to exclude others from using the technology.
3.5 Sales Literature
Sales literature for Sunapto and the MedCabinet remains to be developed.
3.6 Future Products and Services
Plans for future development by Sunapto include additional capabilities and enhancements to the MedCabinet product line. It is the objective of Sunapto to both innovate and market its products. Once an industry reputation has been achieved and marketing channels opened, expansion into other healthcare and medical device areas becomes potentially rewarding.
Market Analysis Summary
Sunapto intends to target the 65 and over age group. Growth in this age category is expected to be high over the next several years, as baby boomers approach and exceed age 65. U.S. Census Bureau population projections estimate a 13.3% overall growth from 2001-2010 in the 65 and over age group.
Medication compliance in home settings to insure proper drug administration is a major unsatisfied need. As medication usage and life expectancy increase, and the shift towards more in-home healthcare proliferates, this need will only be accentuated. The MedCabinet will surpass the challenges imposed by this unsatisfied need and serve as a major asset to the target market.
4.1 Market Segmentation
The potential customers of Sunapto are both domestic and foreign. This plan focuses on Sunapto’s potential domestic customers. Once established, the expansion into foreign customers becomes potentially rewarding.
Individuals 65 and over residing in the U.S. that are using medications in an independent living situation are the main customer group for the MedCabinet. About two-thirds of the 65 and over age group use prescription and over-the-counter (OTC) medications, and account for about one-third of all prescription drug use. At any time, an average elderly person uses four to five prescription drugs and two OTC drugs and fills 12 to 17 prescriptions a year.
Secondary customer groups for the MedCabinet are those under the age of 65 that need assistance in medication compliance. This group includes individuals ranging from those taking multiple medications to those needing help remembering when to take their medication. Some of these individuals would include patients recovering from brain surgery, patients taking a drug cocktail to combat HIV/AIDS, or Parkinson’s Disease.
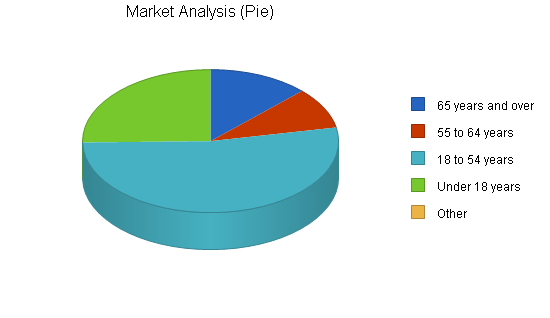
The following chart illustrates projected U.S. populations for various age segments; the numbers in the table are in thousands. Many are potential buyers of the MedCabinet, but Sunapto will initially concentrate on the 65 and over age group.
| Market Analysis | |||||||
| Year 1 | Year 2 | Year 3 | Year 4 | Year 5 | |||
| Potential Customers | Growth | CAGR | |||||
| 65 years and over | 1% | 35,303 | 35,676 | 36,052 | 36,432 | 36,816 | 1.05% |
| 55 to 64 years | 4% | 26,113 | 27,229 | 28,393 | 29,607 | 30,872 | 4.27% |
| 18 to 54 years | 0% | 147,955 | 148,625 | 149,298 | 149,975 | 150,655 | 0.45% |
| Under 18 years | 0% | 70,935 | 71,153 | 71,371 | 71,590 | 71,810 | 0.31% |
| Other | 0% | 0 | 0 | 0 | 0 | 0 | 0.00% |
| Total | 0.87% | 280,306 | 282,683 | 285,114 | 287,604 | 290,153 | 0.87% |
4.2 Target Market Segment Strategy
Sunapto’s choice of target markets is strategic. The 65 and over market have difficulty with memory and in dealing with complicated dosage instructions for multiple medications. They have a large unsatisfied medical compliance need. This is an expanding age group. The U.S. Census Bureau estimates the 65 and over segment of the population will grow 3.7% from 2001-2005 and 9.2% from 2005-2010.
4.2.1 Market Needs
The elderly often have multiple disease states and/or chronic conditions. They consume over one-third of the prescription medications in the United States. The average individual in Sunapto’s target market consumes four to five prescription drugs and two OTC drugs per day. The risk of hospitalization due to adverse medication outcomes in elderly patients is estimated at 17%, almost six times greater than that for the general population.
Cognitive impairment may play a major role in drug-related problems in the elderly, making it difficult or impossible to correctly follow directions of appropriately prescribed medications. Other factors include the lack of primary care provider help with medication management; financial considerations that affect the purchase and regular use of medications; and decline in vision that impairs the ability to correctly read directions. Nearly 67% of all patients fail to follow important dosage instructions for their medications. Thirty-three percent of patients take all their medicine, 33% take some and 33% do not take their medication at all. Some of the negative outcomes resulting from drug-related problems are:
- Additional healthcare encounter.
- Additional medication.
- Emergency department or Urgent Care visits.
- Allied health professional visit (e.g. dietitian, physical therapist).
- Additional laboratory or radiology procedure.
- No treatment.
- Death.
The main customer need is medication compliance. In order for compliance to occur, medication needs to be more easily organized and administered. The MedCabinet will address this need.
4.2.2 Market Trends
The population in the United States is generally becoming older and is projected to continue to do so. The reason for this is three fold. First, improvements in medication (both numbers and types) and general healthcare has extended the average life-span of Americans to 79.5 years for women and 74.1 years for men according to a 2001 report by the National Center for Health Statistics. The United State’s average life span has increased by approximately eight years over the past half-century, and it is expected to continue to increase in the future (at a lower rate). Second, people have taken more self-interest in their health, and thus found ways to prolong and enhance their lives. Finally, the baby boomer generation, the largest single group in the U.S., is approaching 65 years of age.
4.2.3 Market Growth
There is little doubt that the population in the United States is aging. The U.S. Census Bureau estimates that the mean age of the population will increase from 36 to 36.7 years during the period of 2001-2005. This increase can be partially attributed to their estimates that the 65 and over segment of the population will grow approximately 1% each year from 2001-2005. This amounts to approximately 350,000 individuals per year entering this age group, all potential MedCabinet users.
Although the population is aging, more of the population is leading independent lives. Merck & Co., Inc. reports in their Manual of Geriatrics that the percentage of elderly persons residing in nursing homes has decreased to 5.2%
4.2.4 Market Concept Test
Sunapto’s preliminary concept test showed a market penetration potential of 10%. While they realize that this cannot be translated into actual market share, it does provide solid evidence that their product would be viewed favorably. Sunapto estimates an initial market penetration of 2%. This market penetration rate was estimated using the following formula.
Market Penetration = Market Share1 x Awareness2 x ACV3
1 Market Share is determined using the top two box method. It is the percentage of people who indicated in a product concept test that they “definitely would buy” or “probably would buy” the product under concept testing. In Sunapto’s case, this number was 10%.
2 Awareness is the percentage of the target market that is aware of your product. This number is a measure of the effectiveness of your advertising and product recall by a consumer. Sunapto used a conservative 45%.
3 ACV (All Commodity Volume) is a measure of distribution reach. 70% ACV, for example, means that a product is distributed in stores which represent 70% of sales volume of all products in the same category in that area. Sunapto used a conservative 45%.
4.3 Service Business Analysis
The medication compliance industry is extremely fragmented. The market consists of small companies selling both electronic and traditional pill dispensers and organizers. There are no major medical device companies making or distributing devices similar to the MedCabinet. The consumer is generally unaware of available options, especially electronic products. These consumers rely on expert advice from their physicians and pharmacists when making a purchasing decision.
4.3.1 Distributing a Service
The majority of electronic devices in this industry are sold over the Internet with a few also being listed in medical order guides. Non-electronic devices are sold in major retail outlets, pharmacies, and through mail order. In general, distribution patterns in the healthcare industry are such that the large buying and influencing groups dictate what products are used throughout their sphere of influence. Thus, Sunapto’s products could be mandated or forced out for thousands of patients due to their health plan or hospital group. Other buying and influencing groups recommend several alternatives that require physician and pharmacist education and intervention, similar to pharmaceuticals.
4.3.2 Competition and Buying Patterns
In the home medical device market, buyers rely on expert advice when making a purchasing decision. These experts are their primary care physicians, their pharmacist and their healthcare insurance provider. Buyers are concerned about cost outlays and whether their medical insurance carrier will bear any of the cost of products purchased.
Consumer awareness of automated pill dispensers is very low. Sixty-seven percent of the respondents in Sunapto’s market research indicated that the MedCabinet was unique. Consumer awareness of the plastic pill holders (the seven compartment ones marked Sunday through Saturday) is high. These holders are sold through a variety of means including mass retail outlets like Wal-Mart.
4.3.3 Main Competitors
Sunapto faces competition on three main fronts in the medication compliance market. These fronts are reminder devices, automated medication dispensers and compliance services. The most important competitor to be considered is Home Medical Services LLC. Its strength is that it has a similar product in the automated medication dispenser and compliance service market. Its weaknesses are its cost, limited dosage days, and its weak marketing and distribution channels. This makes it vulnerable to a new, improved entry.
4.3.4 Business Participants
Currently, there are no major medical device companies making or distributing devices similar to the MedCabinet. The market is very fragmented and is made up of smaller companies selling both electronic and traditional (non-electronic) pill dispensers and organizers. Many of the companies compete in the electronic compliance/reminder device arena; few compete in the automated medication dispensers and compliance reminder service arena.
Strategy and Implementation Summary
Sunapto will pursue specific, definable, market segments with a multi-tiered, multi-channel approach. Marketing will follow from broad awareness campaigns to specific target customer campaigns. Sunapto will sell directly to customers directed to them from their marketing campaigns.
5.1 Value Proposition
Sunapto’s value proposition is quite different from others. The MedCabinet is the only product that will allow for prescription dosage and timing to avoid common compliance problems prevalent in the primary target market. The companion services for the MedCabinet offer third parties (e.g. healthcare providers, caregivers and/or family members) secure access to vital information to help ensure proper medication compliance.
5.2 Marketing Strategy
Marketing will follow from industry/trade, and physician/pharmacist awareness campaigns to specific executions directed at specific customer segments. Once the product has gained acceptance by individuals and care providers, Sunapto will initiate the second phase of their marketing strategy. Stage 2 will comprise three steps.
- Cast wider sales net over healthcare providers.
- Begin advertising campaign focusing on the elderly.
- Facilitate and rely on a strong word-of-mouth campaign.
5.2.1 Distribution Strategy
MedCabinet production will be outsourced to a contract manufacturer. Once an order is placed with Sunapto, their order-taking system will automatically notify the production company regarding shipping details. Software using Internet technology will provide an efficient mechanism for streamlining the ordering, production and delivery process.
Their product will initially be shipped directly from the contract manufacturer at the customer’s expense. The MedCabinet manufacturer will include receipts, instructions and other Sunapto literature.
Once the MedCabinet requires distribution to a wider array of buyers, Sunapto will consider a separate distribution center(s) to handle additional demand.
5.2.2 Marketing Programs
Specific marketing programs for Sunapto and the MedCabinet remain to be developed.
5.2.3 Pricing Strategy
Sunapto plans to price the MedCabinet at $700 in order to encourage both medically insured as well as non-insured consumers to buy the product. It is their intention to lobby insurance providers to help cover some or all of the cost of the MedCabinet.
The MedCabinet Monitor and Notification Service is priced at $19.95 per month.
5.2.4 Promotion Strategy
Public relations and industry media will help in Sunapto’s over-all industry awareness plans. Feature articles and product reviews will help launch awareness. Direct mail to buying and influencing groups and ads in trade and consumer target publications will help with buyer impressions.
Sunapto will work closely with physicians and home nursing professionals to design its product and services. The importance of working with physicians is well known. As an outgrowth of their Physician, Pharmacist and Home Nursing Advisory Board, Sunapto will actively recruit physicians, pharmacists and home nursing professionals with sponsored events and seminars.
5.3 Competitive Edge
Sunapto has a competitive edge in three areas: technology, marketing/distribution and their management team and advisory boards.
Technology: The MedCabinet will employ technology to enhance as much of the medication process as possible. This will reduce the amount of human error in using the product. The more user-friendly the product is, the more likely the user will maintain the proper medication practices and thus avoid the need to see the doctor due to drug non-compliance.
Marketing and distribution: Sunapto believes that it is essential for the target market to be exposed to the product via live demonstrations, doctor office visits or a friend in order to remove the possible apprehension of technology. In order to get this desired exposure; they need to get a large number of MedCabinets out in the market quickly, which means that the pricing needs to be reasonable. Once the product has become established, Sunapto would look to find a retail sales partner that would create even greater exposure and distribution of their product.
Management team/Advisory boards: Sunapto’s management team and advisory boards bring a variety of skills and experiences to the table. Their Physician, Pharmacist and Home Nursing Advisory Board consisting of individuals experienced in the areas of healthcare, medical devices and elder care will help guide Sunapto to meet the growing and diverse needs of the home healthcare marketplace. Sunapto’s Business Advisory Board will support, mentor and enhance Sunapto’s management team. Please refer to section 7.2 for the management team listing.
5.4 Positioning Statement
For the person, or caregiver of a person, who is on a medication plan, the MedCabinet helps avoid many of the pitfalls associated with medication non-compliance by providing the right medication at the right time.
5.5 Sales Strategy
Sunapto’s initial strategy is to sell the MedCabinet directly to consumers. Once sales have reached a respectable level, Sunapto will begin discussions with retail sales outlets to stock and sell their product(s).
5.5.1 Sales Forecast
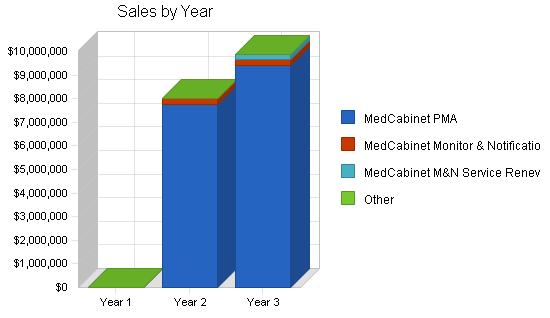
No sales are anticipated throughout Year 1 of operations, as the MedCabinet is developed. The first sales are expected to begin in Year 2. The annual sales forecast for Year 2 is 11,077 MedCabinet units with 7% of the sold units purchasing the companion services. For Year 3, the expected sales forecast is 13,419 units, again with 7% of the sold units purchasing the companion services. It is anticipated that at the end of Year 3, Sunapto will have 1,716 subscribers to the MedCabinet companion services. The estimates presented in this section were derived using a conservative statistical methodology for estimated market penetration for a medical product of this type. For additional details reference section 4.2.4 Market Concept Test.
| Sales Forecast | |||
| Year 1 | Year 2 | Year 3 | |
| Unit Sales | |||
| MedCabinet PMA | 0 | 11,077 | 13,419 |
| MedCabinet Monitor & Notification Service | 0 | 776 | 940 |
| MedCabinet M&N Service Renewal | 0 | 0 | 776 |
| Other | 0 | 0 | 0 |
| Total Unit Sales | 0 | 11,853 | 15,135 |
| Unit Prices | Year 1 | Year 2 | Year 3 |
| MedCabinet PMA | $0.00 | $700.00 | $700.00 |
| MedCabinet Monitor & Notification Service | $0.00 | $301.06 | $301.06 |
| MedCabinet M&N Service Renewal | $0.00 | $239.40 | $239.40 |
| Other | $0.00 | $0.00 | $0.00 |
| Sales | |||
| MedCabinet PMA | $0 | $7,753,900 | $9,393,300 |
| MedCabinet Monitor & Notification Service | $0 | $233,623 | $282,997 |
| MedCabinet M&N Service Renewal | $0 | $0 | $185,774 |
| Other | $0 | $0 | $0 |
| Total Sales | $0 | $7,987,523 | $9,862,072 |
| Direct Unit Costs | Year 1 | Year 2 | Year 3 |
| MedCabinet PMA | $0.00 | $420.00 | $420.00 |
| MedCabinet Monitor & Notification Service | $0.00 | $30.14 | $30.14 |
| MedCabinet M&N Service Renewal | $0.00 | $24.00 | $24.00 |
| Other | $0.00 | $0.00 | $0.00 |
| Direct Cost of Sales | |||
| MedCabinet PMA | $0 | $4,652,340 | $5,635,980 |
| MedCabinet Monitor & Notification Service | $0 | $23,386 | $28,328 |
| MedCabinet M&N Service Renewal | $0 | $0 | $18,624 |
| Other | $0 | $0 | $0 |
| Subtotal Direct Cost of Sales | $0 | $4,675,726 | $5,682,932 |
5.5.2 Sales Programs
Direct sales will be by personal contact, direct mail, public relations and media directed at key industry and customer segments. In addition, electronic marketing will be deployed whenever it fits with the buying or influencing patterns of a key group. A website and electronic commerce site will be utilized to cultivate direct sales to key industry groups and end consumers.
5.6 Strategic Alliances
Sunapto will depend upon strategic alliances in the following areas.
- Contract sales organization to position and sell their product in the national healthcare market.
- Contract design and manufacturer to develop and consistently deliver a quality product.
- Website developer and host to provide continuous access to Sunapto’s current and potential customers.
Web Plan Summary
The Sunapto MedCabinet website will be the virtual business card and portfolio for the company, as well as their online “home.”
It will highlight the MedCabinet and provide access to the monitor and notification service. The website is part of Sunapto’s overall marketing mix. Its main purpose will be to provide information and service to existing customers. It will have a commerce section to allow new customers to purchase Sunapto’s offered products and services.
The website needs to be simple yet classy, and well-designed at the same time, and is in keeping with the latest trends in user interface design. A site that is too flashy, or tries to use too much of the latest Shockwave or Flash technology can be overdone.
Sunapto plans to contract out the development and hosting of the initial MedCabinet website.
6.1 Website Marketing Strategy
The MedCabinet content/commerce site will focus on providing customer service, access to the MedCabinet Monitor and Notification service, products and product information to the healthcare community, caregivers and customer segments. The site will also provide informational and educational content relating to medication compliance/adherence issues.
Sunapto’s website will have a fast loading, extremely user-friendly user interface (UI). The UI will be key to the Web strategy, as it needs to appeal to the audience and at the same time be simple and clean.
6.2 Development Requirements
Sunapto plans to contract out the development and hosting of the initial MedCabinet website. Sunapto will work closely with a selected website developer to develop a simple, classy, yet Internet focused site that satisfies the needs of Sunapto’s target groups.
Management Summary
Sunapto is owned and operated by its founders. It is a small company with a minimum command hierarchy and a maximum of community spirit and cooperation. Despite the loose style, Sunapto is organized by function, and the business is done with logic and order. Management of the company is based upon the following foundation.
- Build and Maintain a Cohesive Leadership Team.
- Create Organizational Clarity.
- Over-Communicate Organizational Clarity.
- Reinforce Organizational Clarity Through Human Systems.
Several key people are actively being sought. These are summarized in the Management Team Gaps section.
7.1 Organizational Structure
The general organization structure of Sunapto is displayed in the chart below.
7.2 Management Team
John P. Brush, President: 41 years old, founded Sunapto in 2002 to focus on using technology to enhance home healthcare. John spent sixteen years at SCS, Inc. before returning to school to obtain his MBA. John was part of the management team that grew SCS from 4 to 55 employees with sales of $5 million. John opened SCS’s first remote office and grew it to 37% of corporate sales in four years. He earned his MBA from the University of Notre Dame’s Mendoza College of Business, and BS (Computer Science) from Rose-Hulman Institute of Technology.
Resumes for the management team may be found in the appendix.
7.3 Management Team Gaps
Sunapto has a good team for covering the main points of the business plan.
At present, Sunapto is weakest in the area of marketing capabilities to position their company and product in the medical marketplace. Sunapto also needs to find technical capabilities to manage the engineering portion of product development.
Sunapto plans to build two advisory boards. One will be the Physician, Pharmacist and Home Nursing Advisory Board consisting of individuals experienced in the areas of healthcare, medical devices and elder care. The second will be an advisory board consisting of individuals with expertise in business development and growth along with medical device product development. The advisor boards will be used to support and supplement the management team.
Listed below are the key management positions that will need to be filled. Each position listed also contains a brief job description and background requirement.
Sales and Marketing Director – Develops strategic sales and marketing objectives, establishes sales territories and quotas, manages budgets and evaluates sales performance. Manages and develops marketing programs and materials such as, advertising, event support and promotions. Requires a bachelor’s degree with at least 7-10 years of sales and marketing experience. Must be familiar with both medical and Internet business models and technologies. Experience must include product/brand management where the emphasis was on managing, developing, and implementing product-marketing activities to maximize sales of an assigned product line.
Controller – Responsible for directing the accounting functions. These functions include establishing and maintaining accounting principles, practices and procedures. Prepares financial reports and presents findings and recommendations. Requires a bachelor’s degree and at least 7 years of direct experience in the field.
Engineering Manager – Plans and directs all aspects of engineering activities within the organization. Ensures all engineering projects, initiatives and processes are in conformance with organization’s established policies and objectives. Requires a bachelor’s degree in engineering and 8 to 10 years of experience in various engineering fields.
7.4 Personnel Plan
The Personnel Plan reflects the need to bolster Sunapto’s capabilities to match their positioning. Sunapto’s total employment should increase to 10 during Year 1 and to 16 by Year 3. Detailed monthly projections are included in the appendix.
| Personnel Plan | |||
| Year 1 | Year 2 | Year 3 | |
| Production Personnel | |||
| Engineering Manager | $94,908 | $97,755 | $100,688 |
| Software Engineer III | $43,577 | $67,332 | $69,352 |
| Software Engineer II | $25,524 | $52,583 | $54,160 |
| Database Administrator | $28,656 | $58,902 | $60,669 |
| Other | $0 | $0 | $0 |
| Subtotal | $192,665 | $276,572 | $284,869 |
| Sales and Marketing Personnel | |||
| Sales and Marketing Director | $85,920 | $88,498 | $91,153 |
| Other | $0 | $0 | $0 |
| Subtotal | $85,920 | $88,498 | $91,153 |
| General and Administrative Personnel | |||
| President | $75,000 | $102,500 | $130,000 |
| Business Office Manager | $26,600 | $46,968 | $48,377 |
| Administrative Assistant | $16,044 | $28,324 | $29,174 |
| Controller | $95,292 | $98,151 | $101,095 |
| Other | $0 | $0 | $0 |
| Subtotal | $212,936 | $275,943 | $308,646 |
| Other Personnel | |||
| Customer Service / Call Center Manager | $22,770 | $46,901 | $48,308 |
| Customer Service Rep | $0 | $29,652 | $30,542 |
| Customer Service Rep | $0 | $29,652 | $30,542 |
| Customer Service Rep | $0 | $0 | $30,542 |
| Customer Service Rep | $0 | $0 | $30,542 |
| Customer Service Rep | $0 | $0 | $30,542 |
| Webmaster | $0 | $46,466 | $47,860 |
| Other | $0 | $0 | $0 |
| Subtotal | $22,770 | $152,671 | $248,876 |
| Total People | 10 | 13 | 16 |
| Total Payroll | $514,291 | $793,684 | $933,544 |
Financial Plan
Sunapto desires to finance growth through a combination of equity investment and internally generated cash flow. Because of the cost of initial product development and marketing costs of establishing a market presence, the business will be financed primarily by investment in the early stages and is expected to burn cash.
The company intends to raise an amount of seed capital before launch and an secure additional outside investment after prototype development.
8.1 Important Assumptions
The financial plan depends on important assumptions, most of which are shown in the following table. The important underlying assumptions are:
- A recovering economy.
- No changes in technology to make products immediately obsolete.
- Access to equity capital and financing sufficient to maintain Sunapto’s financial plan as shown in the tables.
| General Assumptions | |||
| Year 1 | Year 2 | Year 3 | |
| Plan Month | 1 | 2 | 3 |
| Current Interest Rate | 10.00% | 10.00% | 10.00% |
| Long-term Interest Rate | 10.00% | 10.00% | 10.00% |
| Tax Rate | 34.58% | 35.00% | 34.58% |
| Other | 0 | 0 | 0 |
8.2 Break-even Analysis
Sunapto’s break-even analysis assumes approximate running costs per month based o the average of Year 2 and Year 3 expenses, which includes their full payroll, rent, utilities, and an estimation of other running costs.
Margins are harder to assume. Sunapto’s overall average is based on projected total sales in Year 2 and Year 3.
The chart shows what Sunapto needs to sell per month to break-even, according to these assumptions.

| Break-even Analysis | |
| Monthly Units Break-even | 624 |
| Monthly Revenue Break-even | $412,750 |
| Assumptions: | |
| Average Per-Unit Revenue | $661.00 |
| Average Per-Unit Variable Cost | $384.00 |
| Estimated Monthly Fixed Cost | $172,968 |
8.3 Projected Profit and Loss
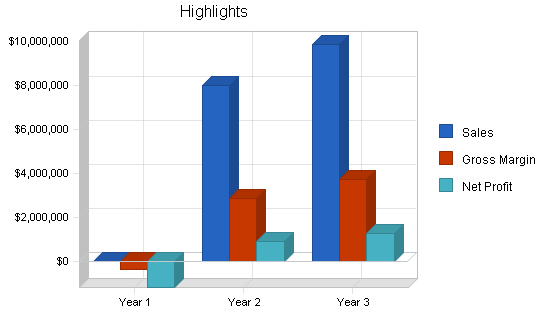
Barring any unforeseen circumstances, Sunapto is anticipated to break-even by Year 2 of operations. Profits for the company in subsequent years will accelerate with the increase in anticipated sales volume, yielding good net profit in Year 2 and better in Year 3.


| Pro Forma Profit and Loss | |||
| Year 1 | Year 2 | Year 3 | |
| Sales | $0 | $7,987,523 | $9,862,072 |
| Direct Cost of Sales | $0 | $4,675,726 | $5,682,932 |
| Production Payroll | $192,665 | $276,572 | $284,869 |
| Research and Development | $175,000 | $180,250 | $185,658 |
| Other Production Expenses | $0 | $0 | $0 |
| Total Cost of Sales | $367,665 | $5,132,548 | $6,153,459 |
| Gross Margin | ($367,665) | $2,854,975 | $3,708,613 |
| Gross Margin % | 0.00% | 35.74% | 37.60% |
| Operating Expenses | |||
| Sales and Marketing Expenses | |||
| Sales and Marketing Payroll | $85,920 | $88,498 | $91,153 |
| Contract Sales Organization | $50,000 | $273,000 | $312,000 |
| Advertising/Promotions | $143,775 | $177,517 | $216,284 |
| Travel | $6,000 | $7,800 | $10,140 |
| Sales Commissions | $0 | $116,309 | $140,900 |
| Legal | $12,000 | $12,360 | $12,731 |
| Miscellaneous | $2,400 | $2,472 | $2,546 |
| Total Sales and Marketing Expenses | $300,095 | $677,955 | $785,753 |
| Sales and Marketing % | 0.00% | 8.49% | 7.97% |
| General and Administrative Expenses | |||
| General and Administrative Payroll | $212,936 | $275,943 | $308,646 |
| Sales and Marketing and Other Expenses | $0 | $0 | $0 |
| Depreciation | $0 | $0 | $0 |
| Leased Equipment | $0 | $0 | $0 |
| Utilities | $36,000 | $37,080 | $38,192 |
| Insurance | $12,000 | $12,360 | $12,731 |
| Office Equipment | $30,000 | $9,000 | $9,000 |
| Office Supplies | $6,000 | $6,180 | $6,365 |
| Rent | $60,000 | $61,800 | $63,654 |
| Payroll Taxes | $154,287 | $238,105 | $280,063 |
| Other General and Administrative Expenses | $0 | $0 | $0 |
| Total General and Administrative Expenses | $511,223 | $640,468 | $718,652 |
| General and Administrative % | 0.00% | 8.02% | 7.29% |
| Other Expenses: | |||
| Other Payroll | $22,770 | $152,671 | $248,876 |
| Consultants | $0 | $0 | $0 |
| Contract/Consultants | $0 | $0 | $0 |
| Total Other Expenses | $22,770 | $152,671 | $248,876 |
| Other % | 0.00% | 1.91% | 2.52% |
| Total Operating Expenses | $834,089 | $1,471,094 | $1,753,281 |
| Profit Before Interest and Taxes | ($1,201,754) | $1,383,881 | $1,955,332 |
| EBITDA | ($1,201,754) | $1,383,881 | $1,955,332 |
| Interest Expense | $0 | $0 | $0 |
| Taxes Incurred | $0 | $484,358 | $676,219 |
| Net Profit | ($1,201,754) | $899,523 | $1,279,113 |
| Net Profit/Sales | 0.00% | 11.26% | 12.97% |
8.4 Projected Cash Flow
It should be noted that the company’s cash flow will be steadily declining for the first year of operations. This is expected due to large capital investments and no sales. Sunapto anticipates having negative net cash flows throughout Year 1 as they incur expenses for prototype development during the first half and as they get ready for production by their contract manufacturer during the second half. Two infusions of capital will get Sunapto through the cash flow drain as they build up for production and sales to begin in Year 2. A monthly breakdown of Year 1 cash flow may be found in the appendix.

| Pro Forma Cash Flow | |||
| Year 1 | Year 2 | Year 3 | |
| Cash Received | |||
| Cash from Operations | |||
| Cash Sales | $0 | $7,188,771 | $8,875,865 |
| Subtotal Cash from Operations | $0 | $7,987,523 | $9,862,072 |
| Additional Cash Received | |||
| Sales Tax, VAT, HST/GST Received | $0 | $0 | $0 |
| New Current Borrowing | $0 | $0 | $0 |
| New Other Liabilities (interest-free) | $0 | $0 | $0 |
| New Long-term Liabilities | $0 | $0 | $0 |
| Sales of Other Current Assets | $0 | $0 | $0 |
| Sales of Long-term Assets | $0 | $0 | $0 |
| New Investment Received | $710,000 | $0 | $0 |
| Subtotal Cash Received | $710,000 | $7,987,523 | $9,862,072 |
| Expenditures | Year 1 | Year 2 | Year 3 |
| Expenditures from Operations | |||
| Cash Spending | $514,291 | $793,684 | $933,544 |
| Bill Payments | $637,885 | $5,826,554 | $7,538,037 |
| Subtotal Spent on Operations | $1,152,176 | $6,620,237 | $8,471,581 |
| Additional Cash Spent | |||
| Sales Tax, VAT, HST/GST Paid Out | $0 | $0 | $0 |
| Principal Repayment of Current Borrowing | $0 | $0 | $0 |
| Other Liabilities Principal Repayment | $0 | $0 | $0 |
| Long-term Liabilities Principal Repayment | $0 | $0 | $0 |
| Purchase Other Current Assets | $0 | $0 | $0 |
| Purchase Long-term Assets | $0 | $0 | $0 |
| Dividends | $0 | $0 | $0 |
| Subtotal Cash Spent | $1,152,176 | $6,620,237 | $8,471,581 |
| Net Cash Flow | ($442,176) | $1,367,286 | $1,390,491 |
| Cash Balance | $27,824 | $1,395,110 | $2,785,601 |
8.5 Projected Balance Sheet
The table below presents the Balance Sheet for Sunapto.
| Pro Forma Balance Sheet | |||
| Year 1 | Year 2 | Year 3 | |
| Assets | |||
| Current Assets | |||
| Cash | $27,824 | $1,395,110 | $2,785,601 |
| Accounts Receivable | $0 | $0 | $0 |
| Inventory | $0 | $0 | $0 |
| Other Current Assets | $0 | $0 | $0 |
| Total Current Assets | $27,824 | $1,395,110 | $2,785,601 |
| Long-term Assets | |||
| Long-term Assets | $0 | $0 | $0 |
| Accumulated Depreciation | $0 | $0 | $0 |
| Total Long-term Assets | $0 | $0 | $0 |
| Total Assets | $27,824 | $1,395,110 | $2,785,601 |
| Liabilities and Capital | Year 1 | Year 2 | Year 3 |
| Current Liabilities | |||
| Accounts Payable | $49,578 | $517,341 | $628,719 |
| Current Borrowing | $0 | $0 | $0 |
| Other Current Liabilities | $0 | $0 | $0 |
| Subtotal Current Liabilities | $49,578 | $517,341 | $628,719 |
| Long-term Liabilities | $0 | $0 | $0 |
| Total Liabilities | $49,578 | $517,341 | $628,719 |
| Paid-in Capital | $1,182,713 | $1,182,713 | $1,182,713 |
| Retained Earnings | ($2,713) | ($1,204,467) | ($304,944) |
| Earnings | ($1,201,754) | $899,523 | $1,279,113 |
| Total Capital | ($21,754) | $877,769 | $2,156,882 |
| Total Liabilities and Capital | $27,824 | $1,395,110 | $2,785,601 |
| Net Worth | ($21,754) | $877,769 | $2,156,882 |
8.6 Business Ratios
The table follows with Sunapto’s main business ratios. The Industry figures come from the Standard Industry Classification (SIC) Index Code 3845, Electromedical Equipment.
| Ratio Analysis | ||||
| Year 1 | Year 2 | Year 3 | Industry Profile | |
| Sales Growth | 0.00% | 0.00% | 23.47% | 2.30% |
| Percent of Total Assets | ||||
| Accounts Receivable | 0.00% | 0.00% | 0.00% | 26.40% |
| Inventory | 0.00% | 0.00% | 0.00% | 13.10% |
| Other Current Assets | 0.00% | 0.00% | 0.00% | 47.70% |
| Total Current Assets | 100.00% | 100.00% | 100.00% | 87.20% |
| Long-term Assets | 0.00% | 0.00% | 0.00% | 12.80% |
| Total Assets | 100.00% | 100.00% | 100.00% | 100.00% |
| Current Liabilities | 178.18% | 37.08% | 22.57% | 38.10% |
| Long-term Liabilities | 0.00% | 0.00% | 0.00% | 18.70% |
| Total Liabilities | 178.18% | 37.08% | 22.57% | 56.80% |
| Net Worth | -78.18% | 62.92% | 77.43% | 43.20% |
| Percent of Sales | ||||
| Sales | 100.00% | 100.00% | 100.00% | 100.00% |
| Gross Margin | 0.00% | 35.74% | 37.60% | 53.30% |
| Selling, General & Administrative Expenses | 0.00% | 23.43% | 22.90% | 34.50% |
| Advertising Expenses | 0.00% | 3.42% | 3.16% | 1.80% |
| Profit Before Interest and Taxes | 0.00% | 17.33% | 19.83% | 4.70% |
| Main Ratios | ||||
| Current | 0.56 | 2.70 | 4.43 | 1.97 |
| Quick | 0.56 | 2.70 | 4.43 | 1.34 |
| Total Debt to Total Assets | 178.18% | 37.08% | 22.57% | 56.80% |
| Pre-tax Return on Net Worth | 5524.36% | 157.66% | 90.66% | 4.10% |
| Pre-tax Return on Assets | -4319.14% | 99.20% | 70.19% | 9.40% |
| Additional Ratios | Year 1 | Year 2 | Year 3 | |
| Net Profit Margin | 0.00% | 11.26% | 12.97% | n.a |
| Return on Equity | 0.00% | 102.48% | 59.30% | n.a |
| Activity Ratios | ||||
| Accounts Receivable Turnover | 0.00 | 0.00 | 0.00 | n.a |
| Collection Days | 0 | 0 | 0 | n.a |
| Inventory Turnover | 0.00 | 0.00 | 0.00 | n.a |
| Accounts Payable Turnover | 13.87 | 12.17 | 12.17 | n.a |
| Payment Days | 27 | 16 | 27 | n.a |
| Total Asset Turnover | 0.00 | 5.73 | 3.54 | n.a |
| Debt Ratios | ||||
| Debt to Net Worth | 0.00 | 0.59 | 0.29 | n.a |
| Current Liab. to Liab. | 1.00 | 1.00 | 1.00 | n.a |
| Liquidity Ratios | ||||
| Net Working Capital | ($21,754) | $877,769 | $2,156,882 | n.a |
| Interest Coverage | 0.00 | 0.00 | 0.00 | n.a |
| Additional Ratios | ||||
| Assets to Sales | n.a. | 0.17 | 0.28 | n.a |
| Current Debt/Total Assets | 178% | 37% | 23% | n.a |
| Acid Test | 0.56 | 2.70 | 4.43 | n.a |
| Sales/Net Worth | 0.00 | 9.10 | 4.57 | n.a |
| Dividend Payout | 0.00 | 0.00 | 0.00 | n.a |
8.7 Exit Strategy
Sunapto is in business to earn a higher than normal return for its business partners. They intend to seek a fair, yet aggressive profit, which will allow the company to be financially healthy for the long term as well as provide compensation to both owners and investors for their money and risk. Sunapto’s founders intend to be part of the ownership and management of Sunapto. Sunapto recognizes that all of its investors will eventually want to reap the rewards of their investments. The following exit strategies are possible ways that Sunapto may choose to reward its early round investors.
- An IPO.
- A sale to a strategic buyer.
- A leveraged recapitalization.
- A new round of financing.
Appendix
| Sales Forecast | |||||||||||||
| Month 1 | Month 2 | Month 3 | Month 4 | Month 5 | Month 6 | Month 7 | Month 8 | Month 9 | Month 10 | Month 11 | Month 12 | ||
| Unit Sales | |||||||||||||
| MedCabinet PMA | 0% | 0 | 0 | 0 | 0 | 0 | 0 | 0 | 0 | 0 | 0 | 0 | 0 |
| MedCabinet Monitor & Notification Service | 0% | 0 | 0 | 0 | 0 | 0 | 0 | 0 | 0 | 0 | 0 | 0 | 0 |
| MedCabinet M&N Service Renewal | 0% | 0 | 0 | 0 | 0 | 0 | 0 | 0 | 0 | 0 | 0 | 0 | 0 |
| Other | 0% | 0 | 0 | 0 | 0 | 0 | 0 | 0 | 0 | 0 | 0 | 0 | 0 |
| Total Unit Sales | 0 | 0 | 0 | 0 | 0 | 0 | 0 | 0 | 0 | 0 | 0 | 0 | |
| Unit Prices | Month 1 | Month 2 | Month 3 | Month 4 | Month 5 | Month 6 | Month 7 | Month 8 | Month 9 | Month 10 | Month 11 | Month 12 | |
| MedCabinet PMA | $700.00 | $700.00 | $700.00 | $700.00 | $700.00 | $700.00 | $700.00 | $700.00 | $700.00 | $700.00 | $700.00 | $700.00 | |
| MedCabinet Monitor & Notification Service | $19.95 | $19.95 | $19.95 | $19.95 | $19.95 | $19.95 | $19.95 | $19.95 | $19.95 | $19.95 | $19.95 | $19.95 | |
| MedCabinet M&N Service Renewal | $19.95 | $19.95 | $19.95 | $19.95 | $19.95 | $19.95 | $19.95 | $19.95 | $19.95 | $19.95 | $19.95 | $19.95 | |
| Other | $0.00 | $0.00 | $0.00 | $0.00 | $0.00 | $0.00 | $0.00 | $0.00 | $0.00 | $0.00 | $0.00 | $0.00 | |
| Sales | |||||||||||||
| MedCabinet PMA | $0 | $0 | $0 | $0 | $0 | $0 | $0 | $0 | $0 | $0 | $0 | $0 | |
| MedCabinet Monitor & Notification Service | $0 | $0 | $0 | $0 | $0 | $0 | $0 | $0 | $0 | $0 | $0 | $0 | |
| MedCabinet M&N Service Renewal | $0 | $0 | $0 | $0 | $0 | $0 | $0 | $0 | $0 | $0 | $0 | $0 | |
| Other | $0 | $0 | $0 | $0 | $0 | $0 | $0 | $0 | $0 | $0 | $0 | $0 | |
| Total Sales | $0 | $0 | $0 | $0 | $0 | $0 | $0 | $0 | $0 | $0 | $0 | $0 | |
| Direct Unit Costs | Month 1 | Month 2 | Month 3 | Month 4 | Month 5 | Month 6 | Month 7 | Month 8 | Month 9 | Month 10 | Month 11 | Month 12 | |
| MedCabinet PMA | 0.00% | $420.00 | $420.00 | $420.00 | $420.00 | $420.00 | $420.00 | $420.00 | $420.00 | $420.00 | $420.00 | $420.00 | $420.00 |
| MedCabinet Monitor & Notification Service | 0.00% | $2.00 | $2.00 | $2.00 | $2.00 | $2.00 | $2.00 | $2.00 | $2.00 | $2.00 | $2.00 | $2.00 | $2.00 |
| MedCabinet M&N Service Renewal | 0.00% | $2.00 | $2.00 | $2.00 | $2.00 | $2.00 | $2.00 | $2.00 | $2.00 | $2.00 | $2.00 | $2.00 | $2.00 |
| Other | 0.00% | $0.00 | $0.00 | $0.00 | $0.00 | $0.00 | $0.00 | $0.00 | $0.00 | $0.00 | $0.00 | $0.00 | $0.00 |
| Direct Cost of Sales | |||||||||||||
| MedCabinet PMA | $0 | $0 | $0 | $0 | $0 | $0 | $0 | $0 | $0 | $0 | $0 | $0 | |
| MedCabinet Monitor & Notification Service | $0 | $0 | $0 | $0 | $0 | $0 | $0 | $0 | $0 | $0 | $0 | $0 | |
| MedCabinet M&N Service Renewal | $0 | $0 | $0 | $0 | $0 | $0 | $0 | $0 | $0 | $0 | $0 | $0 | |
| Other | $0 | $0 | $0 | $0 | $0 | $0 | $0 | $0 | $0 | $0 | $0 | $0 | |
| Subtotal Direct Cost of Sales | $0 | $0 | $0 | $0 | $0 | $0 | $0 | $0 | $0 | $0 | $0 | $0 | |
| Personnel Plan | |||||||||||||
| Month 1 | Month 2 | Month 3 | Month 4 | Month 5 | Month 6 | Month 7 | Month 8 | Month 9 | Month 10 | Month 11 | Month 12 | ||
| Production Personnel | |||||||||||||
| Engineering Manager | $7,909 | $7,909 | $7,909 | $7,909 | $7,909 | $7,909 | $7,909 | $7,909 | $7,909 | $7,909 | $7,909 | $7,909 | |
| Software Engineer III | $0 | $0 | $0 | $1 | $5,447 | $5,447 | $5,447 | $5,447 | $5,447 | $5,447 | $5,447 | $5,447 | |
| Software Engineer II | $0 | $0 | $0 | $0 | $0 | $0 | $4,254 | $4,254 | $4,254 | $4,254 | $4,254 | $4,254 | |
| Database Administrator | $0 | $0 | $0 | $0 | $0 | $0 | $4,776 | $4,776 | $4,776 | $4,776 | $4,776 | $4,776 | |
| Other | $0 | $0 | $0 | $0 | $0 | $0 | $0 | $0 | $0 | $0 | $0 | $0 | |
| Subtotal | $7,909 | $7,909 | $7,909 | $7,910 | $13,356 | $13,356 | $22,386 | $22,386 | $22,386 | $22,386 | $22,386 | $22,386 | |
| Sales and Marketing Personnel | |||||||||||||
| Sales and Marketing Director | $7,160 | $7,160 | $7,160 | $7,160 | $7,160 | $7,160 | $7,160 | $7,160 | $7,160 | $7,160 | $7,160 | $7,160 | |
| Other | $0 | $0 | $0 | $0 | $0 | $0 | $0 | $0 | $0 | $0 | $0 | $0 | |
| Subtotal | $7,160 | $7,160 | $7,160 | $7,160 | $7,160 | $7,160 | $7,160 | $7,160 | $7,160 | $7,160 | $7,160 | $7,160 | |
| General and Administrative Personnel | |||||||||||||
| President | $6,250 | $6,250 | $6,250 | $6,250 | $6,250 | $6,250 | $6,250 | $6,250 | $6,250 | $6,250 | $6,250 | $6,250 | |
| Business Office Manager | $0 | $0 | $0 | $0 | $0 | $3,800 | $3,800 | $3,800 | $3,800 | $3,800 | $3,800 | $3,800 | |
| Administrative Assistant | $0 | $0 | $0 | $0 | $0 | $2,292 | $2,292 | $2,292 | $2,292 | $2,292 | $2,292 | $2,292 | |
| Controller | $7,941 | $7,941 | $7,941 | $7,941 | $7,941 | $7,941 | $7,941 | $7,941 | $7,941 | $7,941 | $7,941 | $7,941 | |
| Other | $0 | $0 | $0 | $0 | $0 | $0 | $0 | $0 | $0 | $0 | $0 | $0 | |
| Subtotal | $14,191 | $14,191 | $14,191 | $14,191 | $14,191 | $20,283 | $20,283 | $20,283 | $20,283 | $20,283 | $20,283 | $20,283 | |
| Other Personnel | |||||||||||||
| Customer Service / Call Center Manager | $0 | $0 | $0 | $0 | $0 | $0 | $3,795 | $3,795 | $3,795 | $3,795 | $3,795 | $3,795 | |
| Customer Service Rep | $0 | $0 | $0 | $0 | $0 | $0 | $0 | $0 | $0 | $0 | $0 | $0 | |
| Customer Service Rep | $0 | $0 | $0 | $0 | $0 | $0 | $0 | $0 | $0 | $0 | $0 | $0 | |
| Customer Service Rep | $0 | $0 | $0 | $0 | $0 | $0 | $0 | $0 | $0 | $0 | $0 | $0 | |
| Customer Service Rep | $0 | $0 | $0 | $0 | $0 | $0 | $0 | $0 | $0 | $0 | $0 | $0 | |
| Customer Service Rep | $0 | $0 | $0 | $0 | $0 | $0 | $0 | $0 | $0 | $0 | $0 | $0 | |
| Webmaster | $0 | $0 | $0 | $0 | $0 | $0 | $0 | $0 | $0 | $0 | $0 | $0 | |
| Other | $0 | $0 | $0 | $0 | $0 | $0 | $0 | $0 | $0 | $0 | $0 | $0 | |
| Subtotal | $0 | $0 | $0 | $0 | $0 | $0 | $3,795 | $3,795 | $3,795 | $3,795 | $3,795 | $3,795 | |
| Total People | 4 | 4 | 4 | 5 | 5 | 7 | 10 | 10 | 10 | 10 | 10 | 10 | |
| Total Payroll | $29,260 | $29,260 | $29,260 | $29,261 | $34,707 | $40,799 | $53,624 | $53,624 | $53,624 | $53,624 | $53,624 | $53,624 | |
| General Assumptions | |||||||||||||
| Month 1 | Month 2 | Month 3 | Month 4 | Month 5 | Month 6 | Month 7 | Month 8 | Month 9 | Month 10 | Month 11 | Month 12 | ||
| Plan Month | 1 | 2 | 3 | 4 | 5 | 6 | 7 | 8 | 9 | 10 | 11 | 12 | |
| Current Interest Rate | 10.00% | 10.00% | 10.00% | 10.00% | 10.00% | 10.00% | 10.00% | 10.00% | 10.00% | 10.00% | 10.00% | 10.00% | |
| Long-term Interest Rate | 10.00% | 10.00% | 10.00% | 10.00% | 10.00% | 10.00% | 10.00% | 10.00% | 10.00% | 10.00% | 10.00% | 10.00% | |
| Tax Rate | 30.00% | 35.00% | 35.00% | 35.00% | 35.00% | 35.00% | 35.00% | 35.00% | 35.00% | 35.00% | 35.00% | 35.00% | |
| Other | 0 | 0 | 0 | 0 | 0 | 0 | 0 | 0 | 0 | 0 | 0 | 0 | |
| Pro Forma Profit and Loss | |||||||||||||
| Month 1 | Month 2 | Month 3 | Month 4 | Month 5 | Month 6 | Month 7 | Month 8 | Month 9 | Month 10 | Month 11 | Month 12 | ||
| Sales | $0 | $0 | $0 | $0 | $0 | $0 | $0 | $0 | $0 | $0 | $0 | $0 | |
| Direct Cost of Sales | $0 | $0 | $0 | $0 | $0 | $0 | $0 | $0 | $0 | $0 | $0 | $0 | |
| Production Payroll | $7,909 | $7,909 | $7,909 | $7,910 | $13,356 | $13,356 | $22,386 | $22,386 | $22,386 | $22,386 | $22,386 | $22,386 | |
| Research and Development | $43,750 | $0 | $0 | $43,750 | $0 | $0 | $43,750 | $0 | $0 | $43,750 | $0 | $0 | |
| Other Production Expenses | $0 | $0 | $0 | $0 | $0 | $0 | $0 | $0 | $0 | $0 | $0 | $0 | |
| Total Cost of Sales | $51,659 | $7,909 | $7,909 | $51,660 | $13,356 | $13,356 | $66,136 | $22,386 | $22,386 | $66,136 | $22,386 | $22,386 | |
| Gross Margin | ($51,659) | ($7,909) | ($7,909) | ($51,660) | ($13,356) | ($13,356) | ($66,136) | ($22,386) | ($22,386) | ($66,136) | ($22,386) | ($22,386) | |
| Gross Margin % | 0.00% | 0.00% | 0.00% | 0.00% | 0.00% | 0.00% | 0.00% | 0.00% | 0.00% | 0.00% | 0.00% | 0.00% | |
| Operating Expenses | |||||||||||||
| Sales and Marketing Expenses | |||||||||||||
| Sales and Marketing Payroll | $7,160 | $7,160 | $7,160 | $7,160 | $7,160 | $7,160 | $7,160 | $7,160 | $7,160 | $7,160 | $7,160 | $7,160 | |
| Contract Sales Organization | $0 | $0 | $0 | $0 | $0 | $0 | $0 | $0 | $0 | $0 | $25,000 | $25,000 | |
| Advertising/Promotions | $0 | $0 | $0 | $47,925 | $0 | $0 | $47,925 | $0 | $0 | $47,925 | $0 | $0 | |
| Travel | $500 | $500 | $500 | $500 | $500 | $500 | $500 | $500 | $500 | $500 | $500 | $500 | |
| Sales Commissions | $0 | $0 | $0 | $0 | $0 | $0 | $0 | $0 | $0 | $0 | $0 | $0 | |
| Legal | $0 | $0 | $0 | $0 | $0 | $0 | $12,000 | $0 | $0 | $0 | $0 | $0 | |
| Miscellaneous | $200 | $200 | $200 | $200 | $200 | $200 | $200 | $200 | $200 | $200 | $200 | $200 | |
| Total Sales and Marketing Expenses | $7,860 | $7,860 | $7,860 | $55,785 | $7,860 | $7,860 | $67,785 | $7,860 | $7,860 | $55,785 | $32,860 | $32,860 | |
| Sales and Marketing % | 0.00% | 0.00% | 0.00% | 0.00% | 0.00% | 0.00% | 0.00% | 0.00% | 0.00% | 0.00% | 0.00% | 0.00% | |
| General and Administrative Expenses | |||||||||||||
| General and Administrative Payroll | $14,191 | $14,191 | $14,191 | $14,191 | $14,191 | $20,283 | $20,283 | $20,283 | $20,283 | $20,283 | $20,283 | $20,283 | |
| Sales and Marketing and Other Expenses | $0 | $0 | $0 | $0 | $0 | $0 | $0 | $0 | $0 | $0 | $0 | $0 | |
| Depreciation | $0 | $0 | $0 | $0 | $0 | $0 | $0 | $0 | $0 | $0 | $0 | $0 | |
| Leased Equipment | $0 | $0 | $0 | $0 | $0 | $0 | $0 | $0 | $0 | $0 | $0 | $0 | |
| Utilities | $3,000 | $3,000 | $3,000 | $3,000 | $3,000 | $3,000 | $3,000 | $3,000 | $3,000 | $3,000 | $3,000 | $3,000 | |
| Insurance | $1,000 | $1,000 | $1,000 | $1,000 | $1,000 | $1,000 | $1,000 | $1,000 | $1,000 | $1,000 | $1,000 | $1,000 | |
| Office Equipment | $12,000 | $0 | $0 | $3,000 | $0 | $6,000 | $9,000 | $0 | $0 | $0 | $0 | $0 | |
| Office Supplies | $500 | $500 | $500 | $500 | $500 | $500 | $500 | $500 | $500 | $500 | $500 | $500 | |
| Rent | $5,000 | $5,000 | $5,000 | $5,000 | $5,000 | $5,000 | $5,000 | $5,000 | $5,000 | $5,000 | $5,000 | $5,000 | |
| Payroll Taxes | 30% | $8,778 | $8,778 | $8,778 | $8,778 | $10,412 | $12,240 | $16,087 | $16,087 | $16,087 | $16,087 | $16,087 | $16,087 |
| Other General and Administrative Expenses | $0 | $0 | $0 | $0 | $0 | $0 | $0 | $0 | $0 | $0 | $0 | $0 | |
| Total General and Administrative Expenses | $44,469 | $32,469 | $32,469 | $35,469 | $34,103 | $48,023 | $54,870 | $45,870 | $45,870 | $45,870 | $45,870 | $45,870 | |
| General and Administrative % | 0.00% | 0.00% | 0.00% | 0.00% | 0.00% | 0.00% | 0.00% | 0.00% | 0.00% | 0.00% | 0.00% | 0.00% | |
| Other Expenses: | |||||||||||||
| Other Payroll | $0 | $0 | $0 | $0 | $0 | $0 | $3,795 | $3,795 | $3,795 | $3,795 | $3,795 | $3,795 | |
| Consultants | $0 | $0 | $0 | $0 | $0 | $0 | $0 | $0 | $0 | $0 | $0 | $0 | |
| Contract/Consultants | $0 | $0 | $0 | $0 | $0 | $0 | $0 | $0 | $0 | $0 | $0 | $0 | |
| Total Other Expenses | $0 | $0 | $0 | $0 | $0 | $0 | $3,795 | $3,795 | $3,795 | $3,795 | $3,795 | $3,795 | |
| Other % | 0.00% | 0.00% | 0.00% | 0.00% | 0.00% | 0.00% | 0.00% | 0.00% | 0.00% | 0.00% | 0.00% | 0.00% | |
| Total Operating Expenses | $52,329 | $40,329 | $40,329 | $91,254 | $41,963 | $55,883 | $126,450 | $57,525 | $57,525 | $105,450 | $82,525 | $82,525 | |
| Profit Before Interest and Taxes | ($103,988) | ($48,238) | ($48,238) | ($142,914) | ($55,319) | ($69,239) | ($192,586) | ($79,911) | ($79,911) | ($171,586) | ($104,911) | ($104,911) | |
| EBITDA | ($103,988) | ($48,238) | ($48,238) | ($142,914) | ($55,319) | ($69,239) | ($192,586) | ($79,911) | ($79,911) | ($171,586) | ($104,911) | ($104,911) | |
| Interest Expense | $0 | $0 | $0 | $0 | $0 | $0 | $0 | $0 | $0 | $0 | $0 | $0 | |
| Taxes Incurred | $0 | $0 | $0 | $0 | $0 | $0 | $0 | $0 | $0 | $0 | $0 | $0 | |
| Net Profit | ($103,988) | ($48,238) | ($48,238) | ($142,914) | ($55,319) | ($69,239) | ($192,586) | ($79,911) | ($79,911) | ($171,586) | ($104,911) | ($104,911) | |
| Net Profit/Sales | 0.00% | 0.00% | 0.00% | 0.00% | 0.00% | 0.00% | 0.00% | 0.00% | 0.00% | 0.00% | 0.00% | 0.00% | |
| Pro Forma Cash Flow | |||||||||||||
| Month 1 | Month 2 | Month 3 | Month 4 | Month 5 | Month 6 | Month 7 | Month 8 | Month 9 | Month 10 | Month 11 | Month 12 | ||
| Cash Received | |||||||||||||
| Cash from Operations | |||||||||||||
| Cash Sales | $0 | $0 | $0 | $0 | $0 | $0 | $0 | $0 | $0 | $0 | $0 | $0 | |
| Subtotal Cash from Operations | $0 | $0 | $0 | $0 | $0 | $0 | $0 | $0 | $0 | $0 | $0 | $0 | |
| Additional Cash Received | |||||||||||||
| Sales Tax, VAT, HST/GST Received | 0.00% | $0 | $0 | $0 | $0 | $0 | $0 | $0 | $0 | $0 | $0 | $0 | $0 |
| New Current Borrowing | $0 | $0 | $0 | $0 | $0 | $0 | $0 | $0 | $0 | $0 | $0 | $0 | |
| New Other Liabilities (interest-free) | $0 | $0 | $0 | $0 | $0 | $0 | $0 | $0 | $0 | $0 | $0 | $0 | |
| New Long-term Liabilities | $0 | $0 | $0 | $0 | $0 | $0 | $0 | $0 | $0 | $0 | $0 | $0 | |
| Sales of Other Current Assets | $0 | $0 | $0 | $0 | $0 | $0 | $0 | $0 | $0 | $0 | $0 | $0 | |
| Sales of Long-term Assets | $0 | $0 | $0 | $0 | $0 | $0 | $0 | $0 | $0 | $0 | $0 | $0 | |
| New Investment Received | $0 | $0 | $0 | $0 | $0 | $0 | $710,000 | $0 | $0 | $0 | $0 | $0 | |
| Subtotal Cash Received | $0 | $0 | $0 | $0 | $0 | $0 | $710,000 | $0 | $0 | $0 | $0 | $0 | |
| Expenditures | Month 1 | Month 2 | Month 3 | Month 4 | Month 5 | Month 6 | Month 7 | Month 8 | Month 9 | Month 10 | Month 11 | Month 12 | |
| Expenditures from Operations | |||||||||||||
| Cash Spending | $29,260 | $29,260 | $29,260 | $29,261 | $34,707 | $40,799 | $53,624 | $53,624 | $53,624 | $53,624 | $53,624 | $53,624 | |
| Bill Payments | $2,491 | $72,870 | $18,978 | $22,134 | $110,552 | $20,873 | $32,124 | $135,207 | $26,287 | $29,343 | $115,740 | $51,287 | |
| Subtotal Spent on Operations | $31,751 | $102,130 | $48,238 | $51,395 | $145,259 | $61,672 | $85,748 | $188,831 | $79,911 | $82,967 | $169,364 | $104,911 | |
| Additional Cash Spent | |||||||||||||
| Sales Tax, VAT, HST/GST Paid Out | $0 | $0 | $0 | $0 | $0 | $0 | $0 | $0 | $0 | $0 | $0 | $0 | |
| Principal Repayment of Current Borrowing | $0 | $0 | $0 | $0 | $0 | $0 | $0 | $0 | $0 | $0 | $0 | $0 | |
| Other Liabilities Principal Repayment | $0 | $0 | $0 | $0 | $0 | $0 | $0 | $0 | $0 | $0 | $0 | $0 | |
| Long-term Liabilities Principal Repayment | $0 | $0 | $0 | $0 | $0 | $0 | $0 | $0 | $0 | $0 | $0 | $0 | |
| Purchase Other Current Assets | $0 | $0 | $0 | $0 | $0 | $0 | $0 | $0 | $0 | $0 | $0 | $0 | |
| Purchase Long-term Assets | $0 | $0 | $0 | $0 | $0 | $0 | $0 | $0 | $0 | $0 | $0 | $0 | |
| Dividends | $0 | $0 | $0 | $0 | $0 | $0 | $0 | $0 | $0 | $0 | $0 | $0 | |
| Subtotal Cash Spent | $31,751 | $102,130 | $48,238 | $51,395 | $145,259 | $61,672 | $85,748 | $188,831 | $79,911 | $82,967 | $169,364 | $104,911 | |
| Net Cash Flow | ($31,751) | ($102,130) | ($48,238) | ($51,395) | ($145,259) | ($61,672) | $624,252 | ($188,831) | ($79,911) | ($82,967) | ($169,364) | ($104,911) | |
| Cash Balance | $438,249 | $336,119 | $287,881 | $236,487 | $91,227 | $29,555 | $653,808 | $464,977 | $385,066 | $302,099 | $132,735 | $27,824 | |
| Pro Forma Balance Sheet | |||||||||||||
| Month 1 | Month 2 | Month 3 | Month 4 | Month 5 | Month 6 | Month 7 | Month 8 | Month 9 | Month 10 | Month 11 | Month 12 | ||
| Assets | Starting Balances | ||||||||||||
| Current Assets | |||||||||||||
| Cash | $470,000 | $438,249 | $336,119 | $287,881 | $236,487 | $91,227 | $29,555 | $653,808 | $464,977 | $385,066 | $302,099 | $132,735 | $27,824 |
| Accounts Receivable | $0 | $0 | $0 | $0 | $0 | $0 | $0 | $0 | $0 | $0 | $0 | $0 | $0 |
| Inventory | $0 | $0 | $0 | $0 | $0 | $0 | $0 | $0 | $0 | $0 | $0 | $0 | $0 |
| Other Current Assets | $0 | $0 | $0 | $0 | $0 | $0 | $0 | $0 | $0 | $0 | $0 | $0 | $0 |
| Total Current Assets | $470,000 | $438,249 | $336,119 | $287,881 | $236,487 | $91,227 | $29,555 | $653,808 | $464,977 | $385,066 | $302,099 | $132,735 | $27,824 |
| Long-term Assets | |||||||||||||
| Long-term Assets | $0 | $0 | $0 | $0 | $0 | $0 | $0 | $0 | $0 | $0 | $0 | $0 | $0 |
| Accumulated Depreciation | $0 | $0 | $0 | $0 | $0 | $0 | $0 | $0 | $0 | $0 | $0 | $0 | $0 |
| Total Long-term Assets | $0 | $0 | $0 | $0 | $0 | $0 | $0 | $0 | $0 | $0 | $0 | $0 | $0 |
| Total Assets | $470,000 | $438,249 | $336,119 | $287,881 | $236,487 | $91,227 | $29,555 | $653,808 | $464,977 | $385,066 | $302,099 | $132,735 | $27,824 |
| Liabilities and Capital | Month 1 | Month 2 | Month 3 | Month 4 | Month 5 | Month 6 | Month 7 | Month 8 | Month 9 | Month 10 | Month 11 | Month 12 | |
| Current Liabilities | |||||||||||||
| Accounts Payable | $0 | $72,237 | $18,345 | $18,345 | $109,865 | $19,925 | $27,492 | $134,330 | $25,411 | $25,411 | $114,030 | $49,578 | $49,578 |
| Current Borrowing | $0 | $0 | $0 | $0 | $0 | $0 | $0 | $0 | $0 | $0 | $0 | $0 | $0 |
| Other Current Liabilities | $0 | $0 | $0 | $0 | $0 | $0 | $0 | $0 | $0 | $0 | $0 | $0 | $0 |
| Subtotal Current Liabilities | $0 | $72,237 | $18,345 | $18,345 | $109,865 | $19,925 | $27,492 | $134,330 | $25,411 | $25,411 | $114,030 | $49,578 | $49,578 |
| Long-term Liabilities | $0 | $0 | $0 | $0 | $0 | $0 | $0 | $0 | $0 | $0 | $0 | $0 | $0 |
| Total Liabilities | $0 | $72,237 | $18,345 | $18,345 | $109,865 | $19,925 | $27,492 | $134,330 | $25,411 | $25,411 | $114,030 | $49,578 | $49,578 |
| Paid-in Capital | $472,713 | $472,713 | $472,713 | $472,713 | $472,713 | $472,713 | $472,713 | $1,182,713 | $1,182,713 | $1,182,713 | $1,182,713 | $1,182,713 | $1,182,713 |
| Retained Earnings | ($2,713) | ($2,713) | ($2,713) | ($2,713) | ($2,713) | ($2,713) | ($2,713) | ($2,713) | ($2,713) | ($2,713) | ($2,713) | ($2,713) | ($2,713) |
| Earnings | $0 | ($103,988) | ($152,226) | ($200,464) | ($343,378) | ($398,698) | ($467,936) | ($660,523) | ($740,434) | ($820,345) | ($991,931) | ($1,096,843) | ($1,201,754) |
| Total Capital | $470,000 | $366,012 | $317,774 | $269,536 | $126,622 | $71,302 | $2,064 | $519,477 | $439,566 | $359,655 | $188,069 | $83,157 | ($21,754) |
| Total Liabilities and Capital | $470,000 | $438,249 | $336,119 | $287,881 | $236,487 | $91,227 | $29,555 | $653,808 | $464,977 | $385,066 | $302,099 | $132,735 | $27,824 |
| Net Worth | $470,000 | $366,012 | $317,774 | $269,536 | $126,622 | $71,302 | $2,064 | $519,477 | $439,566 | $359,655 | $188,069 | $83,157 | ($21,754) |

