
Elite Medical Transcription
Executive Summary
Elite Medical Transcription (EMT) offers high quality, low error rate, medical transcriptions. EMT will concentrate on two market segments: physicians practicing alone and small practices of psychologists. These two market segments are the most reliable consumers of outside transcription services. EMT will also serve other parts of the market, which offer more sporadic service requests.
Through the use of sophisticated software, EMT will provide the accuracy and convenience not yet offered to the medical community in Eugene. Additionally, they will have extensive training requirements for their staff to insure highly qualified transcribers.
These competitive advantages, coupled with a growing market, will allow EMT to quickly gain market penetration. The company will be profitable by month eight and have a solid net profit by year three.
1.1 Objectives
Elite Medical Transcription’s objectives for the first three years of operation include:
- To create a service-based company whose primary goal is exceeding customer’s expectations.
- To increase the number of clients by 20% through superior service.
- To have 45% of our clients become repeat customers.
- To develop a sustainable home-based business, living off of its own cash flow.
1.2 Mission
EMT’s mission is to provide the finest medical transcription service available. We exist to attract and maintain customers. When we adhere to this maxim, everything else will fall into place.
Company Summary
EMT, a medical transcription service, will serve the Eugene medical community. We will offer a superior service through the use of sophisticated digital equipment and careful proofing. In addition to superior equipment, EMT offers professionally trained transcriptionists. Dawn Copikat has taken numerous medical courses to provide her with a medical vocabulary and understanding. This level of knowledge will become a true asset while serving the medical community.
EMT will be located in in Dawn’s home. Dawn will be in charge of scheduling, estimates, billing, and some transcribing. Dawn will also have one full-time employee who will be doing transcriptions. By month 11, Dawn will bring another full-time transcriber onboard. According to projections, EMT will become profitable by month eight and will generate $35,000 in revenues by year three.
2.1 Company Ownership
EMT is a sole proprietorship, founded and owned by Dawn Copikat.
2.2 Start-up Summary
EMT will require the following equipment:
- Legal fees regarding company formation and generation, and review of contracts.
- Advertising costs for advertisements placed in the local medical journals and association newsletters.
- Furniture for the office including two desks, two chairs, and two file cabinets.
- Paper shredder, copier, and fax machine.
- Two computer systems including Microsoft Office, a printer, CD-RW, and Internet connection.
- Two transcribers.
- Medical transcription software.
- Specific psychologist transcription software.
- Reference library.
- Voice recognition software.
- Various office supplies including stationary.
- Cellular phone and pager.
Please note that the equipment listed above will be used for longer than one year and will be considered long-term assets.

| Start-up Funding | |
| Start-up Expenses to Fund | $400 |
| Start-up Assets to Fund | $29,600 |
| Total Funding Required | $30,000 |
| Assets | |
| Non-cash Assets from Start-up | $5,450 |
| Cash Requirements from Start-up | $24,150 |
| Additional Cash Raised | $0 |
| Cash Balance on Starting Date | $24,150 |
| Total Assets | $29,600 |
| Liabilities and Capital | |
| Liabilities | |
| Current Borrowing | $0 |
| Long-term Liabilities | $0 |
| Accounts Payable (Outstanding Bills) | $0 |
| Other Current Liabilities (interest-free) | $0 |
| Total Liabilities | $0 |
| Capital | |
| Planned Investment | |
| Dawn | $30,000 |
| Investor 2 | $0 |
| Other | $0 |
| Additional Investment Requirement | $0 |
| Total Planned Investment | $30,000 |
| Loss at Start-up (Start-up Expenses) | ($400) |
| Total Capital | $29,600 |
| Total Capital and Liabilities | $29,600 |
| Total Funding | $30,000 |
| Start-up | |
| Requirements | |
| Start-up Expenses | |
| Legal | $300 |
| Stationery etc. | $100 |
| Other | $0 |
| Total Start-up Expenses | $400 |
| Start-up Assets | |
| Cash Required | $24,150 |
| Other Current Assets | $0 |
| Long-term Assets | $5,450 |
| Total Assets | $29,600 |
| Total Requirements | $30,000 |
Services
EMT will provide high-level medical transcription services to the Eugene medical community. We typically transcribe office visits, surgery notes, lab results, admissions, assessment, and discharge summaries.
We will offer digital transcription services that allow the physician to call our office and record the dictation over the phone to the recording computer. This will allow the physician to submit the dictation at any time during the day, without having to schedule the transcriber to come in or forward a cassette to the dictation service.
EMT will also offer a rush service that promises transcriptions in 24 hours. It costs a bit more but cuts the turnaround time in half.
Market Analysis Summary
The medical transcription market in Eugene is spread out. On one hand you have two groups of doctors that regularly need a medical transcription service. These are physicians and psychologists who practice alone. Both of these groups have the need for transcribers because they are typically too small to warrant their own in-house employee.
On the other hand you have hospitals, clinics, and other doctors who have an in-house solution, who at times are in need of supplemental services. These service requests are sporadic in nature and often will require EMT’s express service.
4.1 Market Segmentation
EMT will focus on two distinct groups that use medical transcription services:
- Doctors- these physicians typically practice solo or are with one or two other physicians. Because of the small office, they often do not have an in-house transcriber. The advantages of not having an in-house person is reduced labor costs and reduced overhead in terms of the equipment.
- Psychologists- these doctors are very similar to the above market segment. They practice alone or in a small group and typically do not have an in-house transcriber. Although psychologists are medical doctors, their vocabulary of terms requires expertise in the field of psychology to be able to offer transcription services to them.

| Market Analysis | |||||||
| Year 1 | Year 2 | Year 3 | Year 4 | Year 5 | |||
| Potential Customers | Growth | CAGR | |||||
| Doctors | 9% | 215 | 234 | 255 | 278 | 303 | 8.96% |
| Psychologists | 8% | 165 | 178 | 192 | 207 | 224 | 7.94% |
| Other | 0% | 0 | 0 | 0 | 0 | 0 | 0.00% |
| Total | 8.52% | 380 | 412 | 447 | 485 | 527 | 8.52% |
4.2 Target Market Segment Strategy
EMT intends to target the two groups that have the most need for medical transcription services. These groups have the greatest need because they are most likely not going to have an in-house transcriber. This set up is ideal for EMT because it typically means a long-term, active, service relationship.
EMT will also serve the rest of the medical community as the need arises. There are occassions when a hospital, or larger office, may be short staffed and they need a transcriber to fulfill an immediate need. EMT will pick-up the random transcriber call from the larger clinic and hospitals that have an immediate need that they cannot service with their own personnel.
4.3 Service Business Analysis
The medical transcription business is a growing industry that is struggling to fulfill the demand created by physicians. The value of a skilled transcriber is that there will be far fewer errors which typically takes place when the transcriber is unfamiliar with the term that the doctor is using.
In doing market research, EMT interviewed current medical transcribers in Portland and Seattle. Although they have competition, they were not concerned with it because of how much work they had.
The growth of the medical transcription field has been spurred due to insurance company requirements for legible notes prompting a great deal of demand for qualified medical transcribers.
4.3.1 Competition and Buying Patterns
The competition takes two general forms:
- General transcription service- these are transcription services that offer medical services in addition to general service offerings. These firms typically have someone who has been trained in medical transcription, but does not do medical exclusively.
- Specialized medical transcription- there is currently one company that is a true direct competitor with EMT, serving only the medical community. The market looks promising as this firm does not have enough staff to meet demand. Additionally, this firm does not provide specialized service to psychologists.
The buying patterns for medical transcribers are typically based on the type of relationship the physician has with the transcriber. If the physician does not have an in-house solution then they ideally will have a long-term relationship with a service provider. If the physician or hospital has in-house transcribers, then their relationships with the transcriber services are based on sporadic service calls, filling a need when their service provider is unable.

Strategy and Implementation Summary
EMT will be heavily promoting their superior service offerings. Our excellent employee medical specific training and superior software products ensure error reduction, and offer the convenience of electronic dictation from any phone at any time during the day.
5.1 Competitive Edge
EMT has two competitive advantages: the use of advanced digital equipment and its commitment to training. The company has invested in the newest technology, allowing EMT to more quickly and accurately process dictations.
This competitive advantage benefits the clients as it allows them the opportunity to make a dictation over the phone at any time during the day. EMT’s second competitive edge is their commitment to training. In addition to requiring classes in medical transcription, EMT has a sophisticated suite of software manufactured specifically for medical transcriptions. The staff are all trained to utilize this software to its greatest advantage, developing the most error-free document as possible.
5.2 Sales Strategy
EMT’s strategy will be to close prospective leads by asserting high-quality services including well trained transcribers as well as advanced digital equipment offering more conveniences for the physician.
In addition to EMT highlighting the convenience features being offered, the product quality will also be a featured aspect. Because of their extensive training and sophisticated use of technology, EMT’s transcription product is as error free as reasonably possible.
Lastly, recognizing that the industry typically has a 48-hour turnaround, EMT offers an express service where they can turn around orders in 24 hours. There are times when speed and accuracy are the priority and EMT will meet this demand with their express service. This service will be emphasized whenever a prospective customer is inquiring about EMT’s services.
5.2.1 Sales Forecast
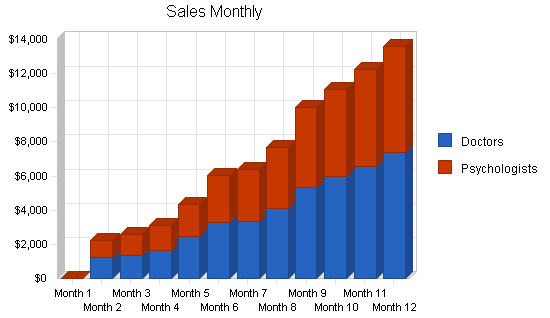
The first month will be used to set up the home office. During this period Dawn will be advertising in local industry-specific journals and association newsletters. At the beginning of month two, EMT will begin servicing clients. The first several months are expected to be slow. Dawn expects it to take a bit of time before business really booms. By month 11, business will be doing well and she will hire one more person.
| Sales Forecast | |||
| Year 1 | Year 2 | Year 3 | |
| Sales | |||
| Doctors | $42,706 | $81,458 | $93,542 |
| Psychologists | $36,539 | $62,545 | $71,254 |
| Total Sales | $79,245 | $144,003 | $164,796 |
| Direct Cost of Sales | Year 1 | Year 2 | Year 3 |
| Doctors | $4,271 | $8,146 | $9,354 |
| Psychologists | $3,654 | $6,255 | $7,125 |
| Subtotal Direct Cost of Sales | $7,925 | $14,400 | $16,480 |
5.3 Milestones
EMT will have several milestones early on:
- Business plan completion. This will be done as a road map for the organization. While we do not need a business plan to raise capital, it will be an indispensable tool for the ongoing performance and improvement of the company.
- Set up the office.
- Profitability.
- Revenue exceeding $50,000.
| Milestones | |||||
| Milestone | Start Date | End Date | Budget | Manager | Department |
| Business Plan Completion | 1/1/2001 | 2/1/2001 | $0 | Dawn | Marketing |
| Office Set-up | 1/1/2001 | 2/1/2001 | $0 | Dawn | Department |
| Profitability | 1/1/2001 | 8/1/2001 | $0 | Dawn | Department |
| Revenue Exceeding $50,000 | 1/1/2001 | 10/30/2001 | $0 | Dawn | Department |
| Totals | $0 | ||||
Management Summary
Dawn Copikat, founder and owner received her Bachelor of Arts from the University of Oregon. During the three years she was pursuing her degree, Dawn worked part time in a physician’s office. She gained insight into the practice of medicine and had a crash course regarding terminology, as well as seeing the amount of money that her employer spent on an outside transcription service. She was able to see the poor quality of the service they received, including typographical errors. Sometimes the product was used regardless of the errors, other times the work had to be sent back and corrected. She was amazed at the number of inaccuracies, but the physician said that this was par for the course.
6.1 Personnel Plan
Dawn will be working full time for EMT. She will wear many hats, including transcriber, payroll, sales, scheduling, and training. Month two will mark when she brings the first employee on board and it will not be until month 11 until she will need a second employee.
Because EMT will be training the staff more than traditional transcribing companies, she will be paying her staff higher than market wages as security for them to stay with the company. It costs too much to find and train new employees, so EMT would rather train people once and ensure that they become long-term employees.
| Personnel Plan | |||
| Year 1 | Year 2 | Year 3 | |
| Dawn | $36,000 | $36,000 | $36,000 |
| Full-time Transcriber | $23,100 | $25,200 | $23,000 |
| Full-time Transcriber | $4,200 | $25,200 | $23,000 |
| Total People | 3 | 3 | 3 |
| Total Payroll | $63,300 | $86,400 | $82,000 |
Financial Plan
The following subtopics will provide more financial information.
7.1 Important Assumptions
See the following table for important financial assumptions.
| General Assumptions | |||
| Year 1 | Year 2 | Year 3 | |
| Plan Month | 1 | 2 | 3 |
| Current Interest Rate | 10.00% | 10.00% | 10.00% |
| Long-term Interest Rate | 10.00% | 10.00% | 10.00% |
| Tax Rate | 25.42% | 25.00% | 25.42% |
| Other | 0 | 0 | 0 |
7.2 Break-even Analysis
The Break-even Analysis is shown below.

| Break-even Analysis | |
| Monthly Revenue Break-even | $7,308 |
| Assumptions: | |
| Average Percent Variable Cost | 10% |
| Estimated Monthly Fixed Cost | $6,577 |
7.3 Projected Profit and Loss
The following table will indicate Projected Profit and Loss.


| Pro Forma Profit and Loss | |||
| Year 1 | Year 2 | Year 3 | |
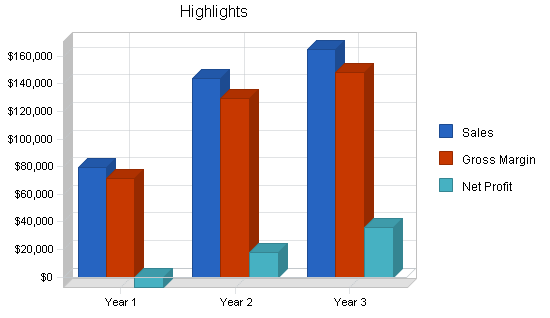
| Sales | $79,245 | $144,003 | $164,796 |
| Direct Cost of Sales | $7,925 | $14,400 | $16,480 |
| Other | $0 | $0 | $0 |
| Total Cost of Sales | $7,925 | $14,400 | $16,480 |
| Gross Margin | $71,321 | $129,603 | $148,316 |
| Gross Margin % | 90.00% | 90.00% | 90.00% |
| Expenses | |||
| Payroll | $63,300 | $86,400 | $82,000 |
| Sales and Marketing and Other Expenses | $1,620 | $1,620 | $1,620 |
| Depreciation | $1,812 | $1,812 | $1,812 |
| Leased Equipment | $0 | $0 | $0 |
| Utilities | $1,500 | $1,500 | $1,500 |
| Insurance | $1,200 | $1,200 | $1,200 |
| Rent | $0 | $0 | $0 |
| Payroll Taxes | $9,495 | $12,960 | $12,300 |
| Other | $0 | $0 | $0 |
| Total Operating Expenses | $78,927 | $105,492 | $100,432 |
| Profit Before Interest and Taxes | ($7,607) | $24,111 | $47,884 |
| EBITDA | ($5,795) | $25,923 | $49,696 |
| Interest Expense | $0 | $0 | $0 |
| Taxes Incurred | $0 | $6,028 | $12,171 |
| Net Profit | ($7,606) | $18,083 | $35,714 |
| Net Profit/Sales | -9.60% | 12.56% | 21.67% |
7.4 Projected Cash Flow
The following table will indicate Projected Cash Flow.

| Pro Forma Cash Flow | |||
| Year 1 | Year 2 | Year 3 | |
| Cash Received | |||
| Cash from Operations | |||
| Cash Sales | $35,660 | $64,801 | $74,158 |
| Cash from Receivables | $29,606 | $67,779 | $86,970 |
| Subtotal Cash from Operations | $65,267 | $132,580 | $161,128 |
| Additional Cash Received | |||
| Sales Tax, VAT, HST/GST Received | $0 | $0 | $0 |
| New Current Borrowing | $0 | $0 | $0 |
| New Other Liabilities (interest-free) | $0 | $0 | $0 |
| New Long-term Liabilities | $0 | $0 | $0 |
| Sales of Other Current Assets | $0 | $0 | $0 |
| Sales of Long-term Assets | $0 | $0 | $0 |
| New Investment Received | $0 | $0 | $0 |
| Subtotal Cash Received | $65,267 | $132,580 | $161,128 |
| Expenditures | Year 1 | Year 2 | Year 3 |
| Expenditures from Operations | |||
| Cash Spending | $63,300 | $86,400 | $82,000 |
| Bill Payments | $19,034 | $37,314 | $44,649 |
| Subtotal Spent on Operations | $82,334 | $123,714 | $126,649 |
| Additional Cash Spent | |||
| Sales Tax, VAT, HST/GST Paid Out | $0 | $0 | $0 |
| Principal Repayment of Current Borrowing | $0 | $0 | $0 |
| Other Liabilities Principal Repayment | $0 | $0 | $0 |
| Long-term Liabilities Principal Repayment | $0 | $0 | $0 |
| Purchase Other Current Assets | $0 | $0 | $0 |
| Purchase Long-term Assets | $0 | $0 | $0 |
| Dividends | $0 | $0 | $0 |
| Subtotal Cash Spent | $82,334 | $123,714 | $126,649 |
| Net Cash Flow | ($17,067) | $8,866 | $34,480 |
| Cash Balance | $7,083 | $15,949 | $50,428 |
7.5 Projected Balance Sheet
The following table details the Projected Balance Sheet.
| Pro Forma Balance Sheet | |||
| Year 1 | Year 2 | Year 3 | |
| Assets | |||
| Current Assets | |||
| Cash | $7,083 | $15,949 | $50,428 |
| Accounts Receivable | $13,978 | $25,401 | $29,069 |
| Other Current Assets | $0 | $0 | $0 |
| Total Current Assets | $21,061 | $41,350 | $79,497 |
| Long-term Assets | |||
| Long-term Assets | $5,450 | $5,450 | $5,450 |
| Accumulated Depreciation | $1,812 | $3,624 | $5,436 |
| Total Long-term Assets | $3,638 | $1,826 | $14 |
| Total Assets | $24,699 | $43,176 | $79,511 |
| Liabilities and Capital | Year 1 | Year 2 | Year 3 |
| Current Liabilities | |||
| Accounts Payable | $2,706 | $3,099 | $3,721 |
| Current Borrowing | $0 | $0 | $0 |
| Other Current Liabilities | $0 | $0 | $0 |
| Subtotal Current Liabilities | $2,706 | $3,099 | $3,721 |
| Long-term Liabilities | $0 | $0 | $0 |
| Total Liabilities | $2,706 | $3,099 | $3,721 |
| Paid-in Capital | $30,000 | $30,000 | $30,000 |
| Retained Earnings | ($400) | ($8,006) | $10,077 |
| Earnings | ($7,606) | $18,083 | $35,714 |
| Total Capital | $21,994 | $40,077 | $75,790 |
| Total Liabilities and Capital | $24,699 | $43,176 | $79,511 |
| Net Worth | $21,994 | $40,077 | $75,790 |
7.6 Business Ratios
The following table contains important ratios from the medical and hospital equipment industry,as determined by the Standard Industry Classification (SIC) Index.
| Ratio Analysis | ||||
| Year 1 | Year 2 | Year 3 | Industry Profile | |
| Sales Growth | 0.00% | 81.72% | 14.44% | 5.80% |
| Percent of Total Assets | ||||
| Accounts Receivable | 56.59% | 58.83% | 36.56% | 28.90% |
| Other Current Assets | 0.00% | 0.00% | 0.00% | 22.00% |
| Total Current Assets | 85.27% | 95.77% | 99.98% | 86.20% |
| Long-term Assets | 14.73% | 4.23% | 0.02% | 13.80% |
| Total Assets | 100.00% | 100.00% | 100.00% | 100.00% |
| Current Liabilities | 10.95% | 7.18% | 4.68% | 43.90% |
| Long-term Liabilities | 0.00% | 0.00% | 0.00% | 10.10% |
| Total Liabilities | 10.95% | 7.18% | 4.68% | 54.00% |
| Net Worth | 89.05% | 92.82% | 95.32% | 46.00% |
| Percent of Sales | ||||
| Sales | 100.00% | 100.00% | 100.00% | 100.00% |
| Gross Margin | 90.00% | 90.00% | 90.00% | 28.30% |
| Selling, General & Administrative Expenses | 99.60% | 77.44% | 68.21% | 16.20% |
| Advertising Expenses | 2.04% | 1.12% | 0.98% | 0.90% |
| Profit Before Interest and Taxes | -9.60% | 16.74% | 29.06% | 3.40% |
| Main Ratios | ||||
| Current | 7.78 | 13.34 | 21.37 | 1.93 |
| Quick | 7.78 | 13.34 | 21.37 | 0.91 |
| Total Debt to Total Assets | 10.95% | 7.18% | 4.68% | 54.00% |
| Pre-tax Return on Net Worth | -34.59% | 60.16% | 63.18% | 6.20% |
| Pre-tax Return on Assets | -30.80% | 55.84% | 60.22% | 13.50% |
| Additional Ratios | Year 1 | Year 2 | Year 3 | |
| Net Profit Margin | -9.60% | 12.56% | 21.67% | n.a |
| Return on Equity | -34.59% | 45.12% | 47.12% | n.a |
| Activity Ratios | ||||
| Accounts Receivable Turnover | 3.12 | 3.12 | 3.12 | n.a |
| Collection Days | 55 | 91 | 110 | n.a |
| Accounts Payable Turnover | 8.03 | 12.17 | 12.17 | n.a |
| Payment Days | 27 | 28 | 27 | n.a |
| Total Asset Turnover | 3.21 | 3.34 | 2.07 | n.a |
| Debt Ratios | ||||
| Debt to Net Worth | 0.12 | 0.08 | 0.05 | n.a |
| Current Liab. to Liab. | 1.00 | 1.00 | 1.00 | n.a |
| Liquidity Ratios | ||||
| Net Working Capital | $18,356 | $38,251 | $75,776 | n.a |
| Interest Coverage | 0.00 | 0.00 | 0.00 | n.a |
| Additional Ratios | ||||
| Assets to Sales | 0.31 | 0.30 | 0.48 | n.a |
| Current Debt/Total Assets | 11% | 7% | 5% | n.a |
| Acid Test | 2.62 | 5.15 | 13.55 | n.a |
| Sales/Net Worth | 3.60 | 3.59 | 2.17 | n.a |
| Dividend Payout | 0.00 | 0.00 | 0.00 | n.a |
Appendix
| Sales Forecast | |||||||||||||
| Month 1 | Month 2 | Month 3 | Month 4 | Month 5 | Month 6 | Month 7 | Month 8 | Month 9 | Month 10 | Month 11 | Month 12 | ||
| Sales | |||||||||||||
| Doctors | 0% | $0 | $1,245 | $1,354 | $1,654 | $2,474 | $3,254 | $3,354 | $4,125 | $5,358 | $5,987 | $6,547 | $7,354 |
| Psychologists | 0% | $0 | $1,001 | $1,245 | $1,458 | $1,874 | $2,754 | $3,021 | $3,524 | $4,685 | $5,055 | $5,687 | $6,235 |
| Total Sales | $0 | $2,246 | $2,599 | $3,112 | $4,348 | $6,008 | $6,375 | $7,649 | $10,043 | $11,042 | $12,234 | $13,589 | |
| Direct Cost of Sales | Month 1 | Month 2 | Month 3 | Month 4 | Month 5 | Month 6 | Month 7 | Month 8 | Month 9 | Month 10 | Month 11 | Month 12 | |
| Doctors | $0 | $125 | $135 | $165 | $247 | $325 | $335 | $413 | $536 | $599 | $655 | $735 | |
| Psychologists | $0 | $100 | $125 | $146 | $187 | $275 | $302 | $352 | $469 | $506 | $569 | $624 | |
| Subtotal Direct Cost of Sales | $0 | $225 | $260 | $311 | $435 | $601 | $638 | $765 | $1,004 | $1,104 | $1,223 | $1,359 | |
| Personnel Plan | |||||||||||||
| Month 1 | Month 2 | Month 3 | Month 4 | Month 5 | Month 6 | Month 7 | Month 8 | Month 9 | Month 10 | Month 11 | Month 12 | ||
| Dawn | 0% | $3,000 | $3,000 | $3,000 | $3,000 | $3,000 | $3,000 | $3,000 | $3,000 | $3,000 | $3,000 | $3,000 | $3,000 |
| Full-time Transcriber | 0% | $0 | $2,100 | $2,100 | $2,100 | $2,100 | $2,100 | $2,100 | $2,100 | $2,100 | $2,100 | $2,100 | $2,100 |
| Full-time Transcriber | 0% | $0 | $0 | $0 | $0 | $0 | $0 | $0 | $0 | $0 | $0 | $2,100 | $2,100 |
| Total People | 1 | 2 | 2 | 2 | 2 | 2 | 2 | 2 | 2 | 2 | 3 | 3 | |
| Total Payroll | $3,000 | $5,100 | $5,100 | $5,100 | $5,100 | $5,100 | $5,100 | $5,100 | $5,100 | $5,100 | $7,200 | $7,200 | |
| General Assumptions | |||||||||||||
| Month 1 | Month 2 | Month 3 | Month 4 | Month 5 | Month 6 | Month 7 | Month 8 | Month 9 | Month 10 | Month 11 | Month 12 | ||
| Plan Month | 1 | 2 | 3 | 4 | 5 | 6 | 7 | 8 | 9 | 10 | 11 | 12 | |
| Current Interest Rate | 10.00% | 10.00% | 10.00% | 10.00% | 10.00% | 10.00% | 10.00% | 10.00% | 10.00% | 10.00% | 10.00% | 10.00% | |
| Long-term Interest Rate | 10.00% | 10.00% | 10.00% | 10.00% | 10.00% | 10.00% | 10.00% | 10.00% | 10.00% | 10.00% | 10.00% | 10.00% | |
| Tax Rate | 30.00% | 25.00% | 25.00% | 25.00% | 25.00% | 25.00% | 25.00% | 25.00% | 25.00% | 25.00% | 25.00% | 25.00% | |
| Other | 0 | 0 | 0 | 0 | 0 | 0 | 0 | 0 | 0 | 0 | 0 | 0 | |
| Pro Forma Profit and Loss | |||||||||||||
| Month 1 | Month 2 | Month 3 | Month 4 | Month 5 | Month 6 | Month 7 | Month 8 | Month 9 | Month 10 | Month 11 | Month 12 | ||
| Sales | $0 | $2,246 | $2,599 | $3,112 | $4,348 | $6,008 | $6,375 | $7,649 | $10,043 | $11,042 | $12,234 | $13,589 | |
| Direct Cost of Sales | $0 | $225 | $260 | $311 | $435 | $601 | $638 | $765 | $1,004 | $1,104 | $1,223 | $1,359 | |
| Other | $0 | $0 | $0 | $0 | $0 | $0 | $0 | $0 | $0 | $0 | $0 | $0 | |
| Total Cost of Sales | $0 | $225 | $260 | $311 | $435 | $601 | $638 | $765 | $1,004 | $1,104 | $1,223 | $1,359 | |
| Gross Margin | $0 | $2,021 | $2,339 | $2,801 | $3,913 | $5,407 | $5,738 | $6,884 | $9,039 | $9,938 | $11,011 | $12,230 | |
| Gross Margin % | 0.00% | 90.00% | 90.00% | 90.00% | 90.00% | 90.00% | 90.00% | 90.00% | 90.00% | 90.00% | 90.00% | 90.00% | |
| Expenses | |||||||||||||
| Payroll | $3,000 | $5,100 | $5,100 | $5,100 | $5,100 | $5,100 | $5,100 | $5,100 | $5,100 | $5,100 | $7,200 | $7,200 | |
| Sales and Marketing and Other Expenses | $135 | $135 | $135 | $135 | $135 | $135 | $135 | $135 | $135 | $135 | $135 | $135 | |
| Depreciation | $151 | $151 | $151 | $151 | $151 | $151 | $151 | $151 | $151 | $151 | $151 | $151 | |
| Leased Equipment | $0 | $0 | $0 | $0 | $0 | $0 | $0 | $0 | $0 | $0 | $0 | $0 | |
| Utilities | $125 | $125 | $125 | $125 | $125 | $125 | $125 | $125 | $125 | $125 | $125 | $125 | |
| Insurance | $100 | $100 | $100 | $100 | $100 | $100 | $100 | $100 | $100 | $100 | $100 | $100 | |
| Rent | $0 | $0 | $0 | $0 | $0 | $0 | $0 | $0 | $0 | $0 | $0 | $0 | |
| Payroll Taxes | 15% | $450 | $765 | $765 | $765 | $765 | $765 | $765 | $765 | $765 | $765 | $1,080 | $1,080 |
| Other | $0 | $0 | $0 | $0 | $0 | $0 | $0 | $0 | $0 | $0 | $0 | $0 | |
| Total Operating Expenses | $3,961 | $6,376 | $6,376 | $6,376 | $6,376 | $6,376 | $6,376 | $6,376 | $6,376 | $6,376 | $8,791 | $8,791 | |
| Profit Before Interest and Taxes | ($3,961) | ($4,355) | ($4,037) | ($3,575) | ($2,463) | ($969) | ($639) | $508 | $2,663 | $3,562 | $2,220 | $3,439 | |
| EBITDA | ($3,810) | ($4,204) | ($3,886) | ($3,424) | ($2,312) | ($818) | ($488) | $659 | $2,814 | $3,713 | $2,371 | $3,590 | |
| Interest Expense | $0 | $0 | $0 | $0 | $0 | $0 | $0 | $0 | $0 | $0 | $0 | $0 | |
| Taxes Incurred | $0 | $0 | $0 | $0 | $0 | $0 | $0 | $0 | $0 | $0 | $0 | $0 | |
| Net Profit | ($3,961) | ($4,355) | ($4,037) | ($3,575) | ($2,463) | ($969) | ($639) | $508 | $2,663 | $3,562 | $2,220 | $3,439 | |
| Net Profit/Sales | 0.00% | -193.88% | -155.33% | -114.88% | -56.64% | -16.13% | -10.02% | 6.64% | 26.51% | 32.26% | 18.14% | 25.31% | |
| Pro Forma Cash Flow | |||||||||||||
| Month 1 | Month 2 | Month 3 | Month 4 | Month 5 | Month 6 | Month 7 | Month 8 | Month 9 | Month 10 | Month 11 | Month 12 | ||
| Cash Received | |||||||||||||
| Cash from Operations | |||||||||||||
| Cash Sales | $0 | $1,011 | $1,170 | $1,400 | $1,957 | $2,704 | $2,869 | $3,442 | $4,519 | $4,969 | $5,505 | $6,115 | |
| Cash from Receivables | $0 | $0 | $41 | $1,242 | $1,439 | $1,734 | $2,422 | $3,311 | $3,530 | $4,251 | $5,542 | $6,095 | |
| Subtotal Cash from Operations | $0 | $1,011 | $1,211 | $2,642 | $3,395 | $4,438 | $5,291 | $6,753 | $8,049 | $9,220 | $11,047 | $12,210 | |
| Additional Cash Received | |||||||||||||
| Sales Tax, VAT, HST/GST Received | 0.00% | $0 | $0 | $0 | $0 | $0 | $0 | $0 | $0 | $0 | $0 | $0 | $0 |
| New Current Borrowing | $0 | $0 | $0 | $0 | $0 | $0 | $0 | $0 | $0 | $0 | $0 | $0 | |
| New Other Liabilities (interest-free) | $0 | $0 | $0 | $0 | $0 | $0 | $0 | $0 | $0 | $0 | $0 | $0 | |
| New Long-term Liabilities | $0 | $0 | $0 | $0 | $0 | $0 | $0 | $0 | $0 | $0 | $0 | $0 | |
| Sales of Other Current Assets | $0 | $0 | $0 | $0 | $0 | $0 | $0 | $0 | $0 | $0 | $0 | $0 | |
| Sales of Long-term Assets | $0 | $0 | $0 | $0 | $0 | $0 | $0 | $0 | $0 | $0 | $0 | $0 | |
| New Investment Received | $0 | $0 | $0 | $0 | $0 | $0 | $0 | $0 | $0 | $0 | $0 | $0 | |
| Subtotal Cash Received | $0 | $1,011 | $1,211 | $2,642 | $3,395 | $4,438 | $5,291 | $6,753 | $8,049 | $9,220 | $11,047 | $12,210 | |
| Expenditures | Month 1 | Month 2 | Month 3 | Month 4 | Month 5 | Month 6 | Month 7 | Month 8 | Month 9 | Month 10 | Month 11 | Month 12 | |
| Expenditures from Operations | |||||||||||||
| Cash Spending | $3,000 | $5,100 | $5,100 | $5,100 | $5,100 | $5,100 | $5,100 | $5,100 | $5,100 | $5,100 | $7,200 | $7,200 | |
| Bill Payments | $27 | $828 | $1,351 | $1,387 | $1,440 | $1,565 | $1,727 | $1,767 | $1,898 | $2,133 | $2,244 | $2,668 | |
| Subtotal Spent on Operations | $3,027 | $5,928 | $6,451 | $6,487 | $6,540 | $6,665 | $6,827 | $6,867 | $6,998 | $7,233 | $9,444 | $9,868 | |
| Additional Cash Spent | |||||||||||||
| Sales Tax, VAT, HST/GST Paid Out | $0 | $0 | $0 | $0 | $0 | $0 | $0 | $0 | $0 | $0 | $0 | $0 | |
| Principal Repayment of Current Borrowing | $0 | $0 | $0 | $0 | $0 | $0 | $0 | $0 | $0 | $0 | $0 | $0 | |
| Other Liabilities Principal Repayment | $0 | $0 | $0 | $0 | $0 | $0 | $0 | $0 | $0 | $0 | $0 | $0 | |
| Long-term Liabilities Principal Repayment | $0 | $0 | $0 | $0 | $0 | $0 | $0 | $0 | $0 | $0 | $0 | $0 | |
| Purchase Other Current Assets | $0 | $0 | $0 | $0 | $0 | $0 | $0 | $0 | $0 | $0 | $0 | $0 | |
| Purchase Long-term Assets | $0 | $0 | $0 | $0 | $0 | $0 | $0 | $0 | $0 | $0 | $0 | $0 | |
| Dividends | $0 | $0 | $0 | $0 | $0 | $0 | $0 | $0 | $0 | $0 | $0 | $0 | |
| Subtotal Cash Spent | $3,027 | $5,928 | $6,451 | $6,487 | $6,540 | $6,665 | $6,827 | $6,867 | $6,998 | $7,233 | $9,444 | $9,868 | |
| Net Cash Flow | ($3,027) | ($4,917) | ($5,240) | ($3,844) | ($3,145) | ($2,227) | ($1,536) | ($114) | $1,051 | $1,987 | $1,604 | $2,342 | |
| Cash Balance | $21,123 | $16,206 | $10,966 | $7,121 | $3,976 | $1,749 | $212 | $99 | $1,150 | $3,137 | $4,741 | $7,083 | |
| Pro Forma Balance Sheet | |||||||||||||
| Month 1 | Month 2 | Month 3 | Month 4 | Month 5 | Month 6 | Month 7 | Month 8 | Month 9 | Month 10 | Month 11 | Month 12 | ||
| Assets | Starting Balances | ||||||||||||
| Current Assets | |||||||||||||
| Cash | $24,150 | $21,123 | $16,206 | $10,966 | $7,121 | $3,976 | $1,749 | $212 | $99 | $1,150 | $3,137 | $4,741 | $7,083 |
| Accounts Receivable | $0 | $0 | $1,235 | $2,624 | $3,093 | $4,046 | $5,616 | $6,701 | $7,596 | $9,590 | $11,413 | $12,599 | $13,978 |
| Other Current Assets | $0 | $0 | $0 | $0 | $0 | $0 | $0 | $0 | $0 | $0 | $0 | $0 | $0 |
| Total Current Assets | $24,150 | $21,123 | $17,441 | $13,589 | $10,215 | $8,022 | $7,365 | $6,913 | $7,695 | $10,740 | $14,550 | $17,340 | $21,061 |
| Long-term Assets | |||||||||||||
| Long-term Assets | $5,450 | $5,450 | $5,450 | $5,450 | $5,450 | $5,450 | $5,450 | $5,450 | $5,450 | $5,450 | $5,450 | $5,450 | $5,450 |
| Accumulated Depreciation | $0 | $151 | $302 | $453 | $604 | $755 | $906 | $1,057 | $1,208 | $1,359 | $1,510 | $1,661 | $1,812 |
| Total Long-term Assets | $5,450 | $5,299 | $5,148 | $4,997 | $4,846 | $4,695 | $4,544 | $4,393 | $4,242 | $4,091 | $3,940 | $3,789 | $3,638 |
| Total Assets | $29,600 | $26,422 | $22,589 | $18,586 | $15,061 | $12,717 | $11,909 | $11,306 | $11,937 | $14,831 | $18,490 | $21,129 | $24,699 |
| Liabilities and Capital | Month 1 | Month 2 | Month 3 | Month 4 | Month 5 | Month 6 | Month 7 | Month 8 | Month 9 | Month 10 | Month 11 | Month 12 | |
| Current Liabilities | |||||||||||||
| Accounts Payable | $0 | $783 | $1,305 | $1,339 | $1,388 | $1,508 | $1,668 | $1,704 | $1,827 | $2,058 | $2,155 | $2,575 | $2,706 |
| Current Borrowing | $0 | $0 | $0 | $0 | $0 | $0 | $0 | $0 | $0 | $0 | $0 | $0 | $0 |
| Other Current Liabilities | $0 | $0 | $0 | $0 | $0 | $0 | $0 | $0 | $0 | $0 | $0 | $0 | $0 |
| Subtotal Current Liabilities | $0 | $783 | $1,305 | $1,339 | $1,388 | $1,508 | $1,668 | $1,704 | $1,827 | $2,058 | $2,155 | $2,575 | $2,706 |
| Long-term Liabilities | $0 | $0 | $0 | $0 | $0 | $0 | $0 | $0 | $0 | $0 | $0 | $0 | $0 |
| Total Liabilities | $0 | $783 | $1,305 | $1,339 | $1,388 | $1,508 | $1,668 | $1,704 | $1,827 | $2,058 | $2,155 | $2,575 | $2,706 |
| Paid-in Capital | $30,000 | $30,000 | $30,000 | $30,000 | $30,000 | $30,000 | $30,000 | $30,000 | $30,000 | $30,000 | $30,000 | $30,000 | $30,000 |
| Retained Earnings | ($400) | ($400) | ($400) | ($400) | ($400) | ($400) | ($400) | ($400) | ($400) | ($400) | ($400) | ($400) | ($400) |
| Earnings | $0 | ($3,961) | ($8,316) | ($12,353) | ($15,928) | ($18,391) | ($19,359) | ($19,998) | ($19,490) | ($16,827) | ($13,265) | ($11,046) | ($7,606) |
| Total Capital | $29,600 | $25,639 | $21,284 | $17,248 | $13,672 | $11,210 | $10,241 | $9,602 | $10,110 | $12,773 | $16,335 | $18,554 | $21,994 |
| Total Liabilities and Capital | $29,600 | $26,422 | $22,589 | $18,586 | $15,061 | $12,717 | $11,909 | $11,306 | $11,937 | $14,831 | $18,490 | $21,129 | $24,699 |
| Net Worth | $29,600 | $25,639 | $21,284 | $17,247 | $13,672 | $11,210 | $10,241 | $9,602 | $10,110 | $12,773 | $16,335 | $18,554 | $21,994 |


