
AgaMatrix, Inc.
Executive Summary
Overview
AgaMatrix is a development stage venture based in Boston offering proprietary Digital Signal Processing (DSP) technology that dramatically improves the functionality and performance of biosensor devices. AgaMatrix’s core DSP algorithms solve a number of immediate problems in the medical devices market by significantly boosting the performance of biosensors without costly specialized hardware and additional chemicals. Initially, AgaMatrix will sell to medical device makers, specifically, home blood glucose monitors and hospital point-of-care blood analyzers. AgaMatrix anticipates achieving positive cash flow by year three with future target healthcare segments to include the large immunoassay and implantable biosensor sectors; as well as other vertical industries that heavily rely on biosensors, such as the military chemical agent detection, environmental air/water quality monitoring, and industrial processing sectors.
Problem – Glucose Monitors Are Burdensome, Painful To Use
Many diabetic patients fail to use home blood glucose devices as prescribed because the regimen is too burdensome or too physically painful. Four to seven times a day, a patient must puncture his or her finger to draw blood onto a test strip for insertion into the glucose biosensor. The average compliance rate for testing is less than 1.5 times a day, resulting in the acceleration of complications caused by diabetes, such as blindness, stroke, and heart and kidney failure. In fact, diabetes is the leading cause of blindness in individuals aged 20-74 and better glucose monitoring compliance is the single biggest key to prevention. Device makers have identified the physical pain of using existing devices as the root cause of non-compliance, and they are seeking ways to reduce the sample size required by their devices. AgaMatrix technology will enable less invasive drawing mechanisms to meet the overwhelming demand for less painful alternatives.
Problems in the hospital blood analyzer market are more related to the lack of the comprehensiveness and accuracy of the devices, which results in reduced adoption levels. AgaMatrix’s value proposition to this market is very clear: devices that are more accurate and sensitive will stand a higher chance of being more readily adopted.
A Software Solution for a Hardware Problem
Historically, the biosensor device industry has attempted to overcome problems related to accuracy, sensitivity, and robustness by enhancing the chemical (hardware) aspects of the devices, such as the biological and chemical design of their sensors. By contrast, AgaMatrix is pioneering a software approach based on digital signal processing (DSP) algorithms that has a number of distinct practical advantages, including lower cost, easier/faster upgrade capability, and complementarity with respect to a wide variety of chemistry/hardware-based biosensor technologies.
AgaMatrix’s solution, consisting of a suite of software modules, enables new functionality and dramatically improves the performance of biosensor devices. Performance improvements include the ability to leverage increases in signal-to-noise ratio to reduce blood sample requirements. For the professional healthcare market, AgaMatrix offers the ability to improve the overall accuracy and sensitivity of hospital point-of-care analyzers. Boosting accuracy removes a major roadblock hindering widespread adoption of portable blood analyzers in place of conventional laboratory equipment.
Software DSP solutions have been vital to the success of many other industries where physical limitations would have impaired their growth. For example, in the 1980s, makers of CD players relied on oversampling and error-correction algorithms to compensate for low quality hardware filters and to overcome disk-skipping problems. AgaMatrix’s algorithms provide analogous solutions in the biosensor space.
Business Model – Software Licensing and Royalty Fees from Device Makers
Initially, AgaMatrix will operate as a technology licensing company, deriving royalty revenue streams based on device makers’ consumables sales (i.e., disposable test strips and cartridges used in the devices). Revenues will be acquired from the sale of the technology to home blood glucose device makers, hospital point-of-care blood analyzer makers, and minimally invasive and implantable blood glucose biosensor developers.
Therasense – an Illustration of How Disruptable the Glucose Market Is
Just a few years ago, the blood glucose market was dominated by four major players (numbers represent annual revenues from test strips): Roche ($1.27B), J & J ($1.09B), Bayer ($650M), and Abbot ($450M). These companies have been around since the 1980’s. Therasense (THER) was founded in 1996, rolled out their first product in June 2000, and leveraged their key differentiator (very similar to what AgaMatrix is offering): the ability to reduce blood sample volume to make glucose testing less painful. In the span of less than two years since their product roll-out, they have achieved $200 million in annual revenues, gone public, and now have a market capitalization of over $800 million. Bottom line: this is a market that is very open to new technological entrants, especially when they are able to reduce pain for the user.
Competitive Advantages
There are no direct competitors pursuing our highly unique and proprietary approach, developed over the past seven years by our world-class scientific team. AgaMatrix technology will be complementary to potential indirect competition from the in-house laboratories of major medical device makers. The sustainable competitive advantages that AgaMatrix commands include:
- Superior software paradigm, complementary to chemical (hardware) advances in biosensors.
- Expertise developed over the course of seven years of biosensor research.
- Monopolization of the scientific team responsible for the original paradigm innovation.
- Development lead time of at least two years over potential competition.
- Intellectual property strategy involving two core utility patents (filed) and three defensive utility patents.
Customer Traction
We have approached two blood glucose monitor makers and one hospital point-of-care device manufacturer as potential customer targets. There are over 20 other major potential target companies we have not yet approached. The following is a summary of the current status of the companies we have reached:
- Strong interest to partner from two blood glucose monitor companies (discussions with Presidents); details are confidential at this point, but we believe we will be able to close a deal by June 2002.
- Strong interest from a leading blood glucose monitor maker (J & J – discussions with Director-level staff) and the leading hospital point-of-care device maker (i-STAT – discussions with Vice President and Director-level staff).
The Team
A current team composed of:
- The three leading scientists pioneering the use of digital signal processing to improve biosensor technology, with an aggregate of over 40 years of direct DSP/biosensor research experience.
- Entrepreneurs who have founded, built and run an enterprise software company.
- An expanding board of veteran advisors made up of medical doctors who have healthcare business experience.
- An additional technical team of three committed to joining the company post-seed financing, composed of engineers from MIT and Tufts, with technical management experience and an aggregate of over 25 years of commercial engineering experience.
Financing
AgaMatrix has been self-funded by the principals of the company since its founding. The company recently closed a seed round of $500K from a number of healthcare angel investors and IncTANK, an early stage venture capital fund. A Series A round is expected in four to five months of approximately $1 million.
The objectives of these rounds of funding are the completion of version 1.0 of the products and the acquisition of at least one paying customer over a period of 13 months of operations. Given the current state of customer traction and product development, we believe these milestones are reasonable. The company expects to raise an institutional or another private round of about $4 million by the end of year one to be cash flow positive. Current valuation drivers include:

- A world-class scientific team consisting of Dr. Sridhar Iyengar (CTO), Dr. Justin Gooding, and Dr. Ian Harding, the engineering team, and an aggressive business team with start-up and management experience.
- Technology applicable to a number of other vertical markets and protected by a rigorous IP strategy.
- External validation from existing relationships with potential customers and advancement to final rounds in a number of national business plan competitions.
1.1 Mission
AgaMatrix develops solutions to power next-generation biological and chemical sensor systems. The value that AgaMatrix delivers to this market is the ability to dramatically improve the accuracy, sensitivity, and robustness of a range of different sensors for the purpose of making medical diagnostic devices more effective. AgaMatrix’s technology enables the development of devices that will be essentially painless to patients and that will meet the demand for better accuracy in medical diagnostics. It is committed to providing software solutions for a critical hardware problem that affects millions of diabetic patients and hospital patients worldwide.
1.2 Objectives
- Develop technology solutions that will increase the adoption and compliance rates of diagnostic medical devices by improving the functionality and performance of biosensors, specifically for home blood glucose monitors and hospital point-of-care blood analyzers.
- Achieve positive cash flow by year three.
- Reach $50 million in annual revenues by year four.
- Expand into other industries that heavily rely on biosensors, including industrial processing, environmental monitoring, and military sectors.
Company Summary
AgaMatrix, Inc., which was incorporated in Delaware in 2001, is an early-stage venture offering proprietary Digital Signal Processing (DSP) technology that dramatically improves the functionality and performance of biosensor devices. AgaMatrix’s core DSP algorithms solve a number of immediate problems in the medical devices market by significantly boosting the performance of biosensors without costly specialized hardware and additional chemicals. Initially, the company will sell technology solutions to diagnostic medical device makers, specifically, manufacturers of home blood glucose monitors and hospital point-of-care blood analyzers. Future target healthcare segments include the immunoassay and implantable biosensor sectors. Its headquarters are located in Cambridge, Massachusetts.
2.1 Start-up Summary
AgaMatrix’s start-up costs amount to $4,900, which covers the initial expenses for opening the first office. These costs include incorporation of the company, design of the company logo and website, purchase of office and IT equipment, and other miscellaneous expenses. The start-up costs are financed by direct owner investment. The assumptions are detailed in the following table and illustration.

| Start-up | |
| Requirements | |
| Start-up Expenses | |
| Legal | $400 |
| Stationery etc. | $200 |
| Brochures | $1,000 |
| Rent | $1,000 |
| Expensed Equipment | $2,000 |
| Other | $300 |
| Total Start-up Expenses | $4,900 |
| Start-up Assets | |
| Cash Required | $1,515,100 |
| Other Current Assets | $0 |
| Long-term Assets | $0 |
| Total Assets | $1,515,100 |
| Total Requirements | $1,520,000 |
| Start-up Funding | |
| Start-up Expenses to Fund | $4,900 |
| Start-up Assets to Fund | $1,515,100 |
| Total Funding Required | $1,520,000 |
| Assets | |
| Non-cash Assets from Start-up | $0 |
| Cash Requirements from Start-up | $1,515,100 |
| Additional Cash Raised | $0 |
| Cash Balance on Starting Date | $1,515,100 |
| Total Assets | $1,515,100 |
| Liabilities and Capital | |
| Liabilities | |
| Current Borrowing | $0 |
| Long-term Liabilities | $15,000 |
| Accounts Payable (Outstanding Bills) | $5,000 |
| Other Current Liabilities (interest-free) | $0 |
| Total Liabilities | $20,000 |
| Capital | |
| Planned Investment | |
| Seed Round Pre-Plan | $500,000 |
| Series A | $1,000,000 |
| Other | $0 |
| Additional Investment Requirement | $0 |
| Total Planned Investment | $1,500,000 |
| Loss at Start-up (Start-up Expenses) | ($4,900) |
| Total Capital | $1,495,100 |
| Total Capital and Liabilities | $1,515,100 |
| Total Funding | $1,520,000 |
2.2 Company Ownership
AgaMatrix is a privately-held Delaware corporation, subchapter C. It was created in 2001. Sonny Vu and Sridhar Iyengar, the company’s founders, own the majority of equity. Members of the board of directors and advisors also hold minority stock positions. All employees of the company are rewarded with stock compensation packages.
Products
AgaMatrix will develop a set of software products that provides critically needed diagnostic functionality to current and next-generation medical biosensors. Optimized for computational efficiency, they are designed to be easily incorporated into a number of leading biosensor platforms. All products that we develop will be powered by our core DSP algorithms with certain features configured and optimized for the relevant applications. Our algorithms will be delivered in a format that is convenient and useful to our customers; as such, each AgaMatrix Product Suite will consist of a core DSP engine supplemented with integration tools, application-specific expansion modules, and professional services. Since our initial product focus is OEM technology, we will work closely with our customers and partners in the development and deployment of our products. The core DSP algorithms will be encoded as a platform technology in modular components that can be rapidly configured as needed for various customers’ applications.
Initially, we are marketing one product for the glucose biosensor market and one product for the hospital POC market:
Suite Name: AccuMatrix
- Target Customer: Smaller Home Glucose Biosensor Manufacturers
- Why Needed: These customers need a method of suppressing interference from other known chemicals in the blood (vitamin C, Tylenol, and uric acid) that can react at the biosensor and give erroneous readings. They need to be able to suppress these interferences without the use of chemical mediators or expensive membranes.
Suite Name: PosiMatrix
- Target Customer: Hospital Point-of-Care Manufacturers
- Why Needed: These customers need a method of alerting the user when unknown chemicals in the blood interfere with the biosensor and give false positives. E.g., the FDA regularly approves new anesthetic gases that are used in surgery; however, the POC makers cannot keep up with these new “unknown” chemicals that may be present in the patient’s blood and can interfere with the device. For one POC maker, it is “medically imperative” for them to avoid reporting false readings; thus, they need a method of identifying when the reading is corrupted by unknown chemical interference so that they may indicate to the user that the reading is not valid.
The core DSP algorithm engine contains all the needed functionality. Using a Configuration Tool, we can rapidly integrate the appropriate Data Modules that are appropriate for the target customer. These Modules contain a library of information that is needed to configure and optimize the core algorithms for the chemicals that are relevant to the customer’s device. Once configured, the algorithms will be delivered in the appropriate software or ASIC-design version for the target device and can be deployed with our Integration Tools by our Professional Services Deployment Team or by the customer’s engineering team. The basic components of each AgaMatrix Suite will include the following:
Core Engine
Core DSP technology software and firmware code base will consist of a major portion of the algorithms that AgaMatrix develops. These algorithms will be activated as needed for each customer’s requirements by the Configuration Tools.
Data Modules
These are libraries that contain empirical data needed to optimize the core DSP engine for the detection of different chemicals in various operating environments. The Configuration Tools will in part use the data from these Data Modules to customize the software for customers’ various products. We will initially offer the following 2 modules:
- Blood Glucose Data Module: Library of empirical information of the standard chemicals that are commonly encountered in blood glucose measurements. This data is used to optimize the core algorithms for detection of glucose and suppression of common interfering chemicals.
- Point-of-Care Data Module(s): Library of empirical information of the standard chemicals that are commonly encountered in various blood chemistry measurements routinely performed by point-of-care devices. This data is used to optimize the core algorithms for detection of each of the relevant chemicals and suppression of common interfering chemicals.
As market and customer needs dictate, future offerings will include the following Modules:
- Implantables Data Module: Library of empirical information on quantities that are relevant to implantable glucose sensors. This data is used to optimize the core algorithms to correct for sensor deterioration (fouling) effects and suppress signals from interfering chemicals while boosting the signal from glucose.
- Immunoassay Data Module(s): Library of empirical information of the standard chemicals that are commonly encountered in relevant immunoassays. Immunoassay Data Modules will be developed for each immunoassay that is of interest to the customer. This data is used to optimize the core algorithms for detection of the relevant chemicals for the given immunoassay.
Configuration Tools
Configuration tools are the front-end interface of the software. This set of tools will allow for the rapid optimization and configuration of the core algorithms for various functionalities and chemicals. These tools are used to select which Data Modules and algorithms are needed for the customer’s application and generate the end product, which can be delivered either as software/firmware for the target device or be delivered in the form of an ASIC design.
Code Integration Tools
This set of tools facilitates the integration and customization of software and firmware code base into customers’ products. These tools may be used by our Professional Services Deployment Team when integrating the product into the customers’ end-device, or they may be used by the customer’s in-house engineering teams themselves. Initially, we will include:
- Software Integration Tools: Tools that facilitate the integration of our technology onto microprocessor-based devices.
- Firmware Integration Tools: Tools that facilitate the integration of our technology onto firmware-based devices.
Technology and Development Tutorials
These are in-depth, easy-to-use online tutorials consisting of scientific and engineering guides to help quickly bring a development and integration team up to speed on AgaMatrix’s DSP technology. The tutorials will consist of code examples, customization, and integration tutorials.
Professional Support Services Package
A set of professional services, including software/firmware development and QA/QC testing, designed to assist in supporting the use and maintenance of the AgaMatrix Product Suites for customers and partners.
Based on initial discussions with potential customers, we believe that we can deliver our product in a format that will be readily usable by their development and integration teams. We will use established processes analogous to those used in the deployment of enterprise software solutions where a Deployment Team will assist the customer in the integration of our product into their devices, as indicated by the professional services component of our product offering.
Market Analysis Summary
Medical diagnostics has the greatest existing opportunity from an industry size perspective as well as the degree of match between existing needs and AgaMatrix’s technology capability. The sub-segments in this market that the AgaMatrix product line is addressing in the short term (within the next two to three years) are the large, high-margin consumer blood glucose monitor market and the now quickly growing hospital point-of-care device market, i.e., customers are makers of these devices. Even by a conservative estimate, the value proposed by AgaMatrix to the glucose market alone would be enough to sustain a viable standalone venture. However, given the minimal incremental effort that would be needed, we will deliver the product to both sub-markets for the benefit of augmenting and diversifying our revenue streams.
The market that we are concerned with consists of advancing medical devices and technologies that allow healthcare professionals and home users to acquire medical diagnostic data such as blood glucose levels (e.g., for diabetics) and various other blood chemistry data (e.g., for emergency care situations) instantly, easily, cheaply, and accurately without having to send blood samples to centralized lab facilities which have longer turnaround times and are more costly. The conclusion that this market should be the company’s initial focus is substantiated by the fact that it has all the relevant characteristics of a market we found to be desirable. These characteristics are discussed below:
- Large existing, robust, high-growth market.
- Converging market forces sustaining industry growth.
- Clear, immediate need for benefits provided by technology.
- Technology delivered would be strongly positioned to participate in emerging trends.
In the medium and long term (three to four years from now), AgaMatrix aims to address needs in the emerging electrochemical immunoassay and implantable biosensor markets.
The Home Blood Glucose Monitoring is the largest, immediately addressable market, over $4.1 billion in size today and growing 13% CAGR. Based on preliminary discussions with several potential customers, AgaMatrix believes that a significant portion of this market can eventually be captured. We expect device makers to pass on the modest costs of AgaMatrix’s technology through the high margins currently enjoyed by the consumable reagents (test strips) they sell. While AgaMatrix technology does not directly improve the test strips themselves, potential customers will incorporate the cost of such technology as part of the total solution cost; development costs of their test devices are already paid for in this way. Diabetics generally are not price sensitive to test strips since insurance usually covers the costs of the strips.
4.1 Market Segmentation
Home Blood Glucose Monitors
AgaMatrix will initially target home blood glucose monitoring device makers. One primary dimension along which these device makers compete is the reduction of pain and discomfort from testing that involves pricking fingers to extract blood. By improving device sensitivity, AgaMatrix allows blood glucose device OEMs to reduce the required blood sample size enabling the use of less painful blood extraction mechanisms, a major competitive advantage for such devices according to customer surveys. In one foreseeable application, diabetics would be able to painlessly extract a small amount of blood using automated AgaMatrix-enabled microneedles to test blood glucose levels.
Hospital Point-of-Care Blood Analyzers
AgaMatrix will also initially target the hospital blood analyzer market ($300 million in 2001, 25% CAGR) by providing increased accuracy and increased types of tests for these devices. Based on a bottom-up analysis of end user (physicians) and device maker surveys, we believe market penetration for these players has been hindered by the relatively low accuracy (when compared to tests done by centralized labs) and by the limited number of available tests. Physicians are thus forced to wait several hours for results from blood sent to centralized labs, and only use portable blood analyzers in acute emergency situations.
AgaMatrix solves the problem of low accuracy for portable hospital blood analyzers, allowing physicians to use portable analyzers in more situations, thus increasing quality of care, increasing patient turnover, and reducing hospital costs. Our technology could also help boost the yield on current cartridge products, eliminate future cartridge production steps, and provide a broader menu of tests on portable devices, delivering a suite of offerings comparable to traditional large and expensive lab equipment analyzers.
Minimally Invasive and Implantable Glucose Monitors
Alternatives to finger-pricking devices currently include devices that continuously monitor blood glucose levels. The problem with these and similar “minimally invasive” devices is that, according to a report by Merrill Lynch, they are not sufficiently accurate (>30% error, outside bounds of FDA-approved primary glucose monitoring devices) to be used for any purpose other than a supplementary aid to traditional finger-pricking methods. Also, they cannot be used continuously for an extended period of time. AgaMatrix’s value proposition of dramatically improving accuracy and usage duration is clear.
With almost all of the major players trying to develop an “artificial pancreas,” commercializing implantable glucose biosensors that can regulate an implanted insulin pump has been the Holy Grail for the industry. The artificial pancreas allows diabetics to lead a near normal lifestyle without the constant pain and inconvenience of finger pricking and insulin injections. One of the key challenges in the development of implantable sensors is eliminating the use of toxic chemicals currently needed to correct for cross-sensitivity effects that reduce the accuracy of the sensor. AgaMatrix’s technology minimizes these effects without having to use toxic chemicals, thus eliminating a key barrier to the development of complete implantable glucose monitoring and insulin pump systems. Such breakthroughs could lead to adoption of implantable devices on the order of today’s cardiac pacemaker. These large players have expressed initial interest in using AgaMatrix’s technology in these next-generation implantable devices.
Electrochemical Immunoassays
Immunoassays are tests that measure biological and chemical species associated with the body’s immune system. Currently, the majority of immunoassays are performed via color-changing tests strips (for simple non-critical applications like home pregnancy tests), or via time-consuming laboratory procedures for more critical tests (like cardiac markers). In hospitals and clinical labs alone, millions of these immunoassays are performed daily. These laboratory assays are based on complicated optical and radioactive detection instrumentation. Leaders in the industry are developing electrochemical immunoassays because electrochemical technologies are generally recognized to be more cost effective, robust, and possibly faster than optical methods given the fact that no complicated sample pre-treatment processes are needed. One of the main challenges to commercializing this new technology is achieving the low detection levels needed for such measurements. AgaMatrix’s technology can be eventually embedded in these devices to overcome the sensitivity issues that currently hinder their commercialization.
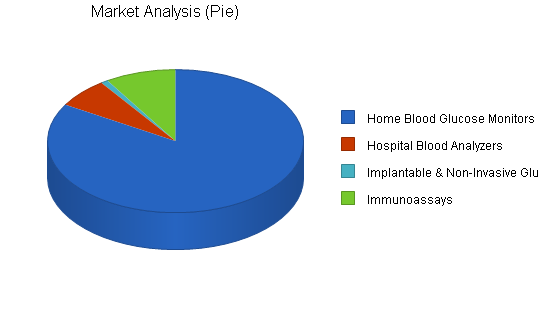
| Market Analysis | |||||||
| Year 1 | Year 2 | Year 3 | Year 4 | Year 5 | |||
| Potential Customers | Growth | CAGR | |||||
| Home Blood Glucose Monitors | 13% | 4,700 | 5,311 | 6,001 | 6,781 | 7,663 | 13.00% |
| Hospital Blood Analyzers | 25% | 375 | 469 | 586 | 733 | 916 | 25.02% |
| Implantable & Non-Invasive Glucose Monitors | 25% | 50 | 60 | 80 | 100 | 125 | 25.74% |
| Immunoassays | 5% | 500 | 525 | 551 | 579 | 608 | 5.01% |
| Total | 13.43% | 5,625 | 6,365 | 7,218 | 8,193 | 9,312 | 13.43% |
4.2 Industry Analysis
The medical diagnostics industry is prone to disruptions because of technological innovations. We have found the following current industry needs are immediately addressable by AgaMatrix’s technology based on a survey of potential customers in the blood glucose and Hospital point-of-care (POC) market:
|
Existing Market Need |
End-User Motivation for Market Need |
Bottom Line Value of Solution to Device Makers |
|
Use of blood from less painful areas. |
Lack of treatment compliance because diabetic patients are unwilling to use the devices too physically painful to use regularly. |
Sample size is a critical dimension device makers compete on. Solution provides a competitive advantage. |
|
Need for higher accuracy for hospital POC blood chemistry analyzers. |
Desire to use point-of-care devices instead of central labs for emergency situations in order to instantly get life-critical diagnostic data. |
Device makers increase penetration in existing hospital markets. |
|
Need for larger test menus offered by POC devices. |
Health professionals will often not use point-of-care devices unless all the required tests are available in one device/cartridge solution. |
A competitive advantage increasing market share since this is an end-user valued differentiating feature. |
Near future market needs prompted by emerging trends
We have also identified a number of needs for which AgaMatrix is aligned to be a major technology provider. For the sake of conservatism and maintaining a focused company positioning in the healthcare arena, we are not pursuing available applications in environmental monitoring, industrial processing, and military biological/chemical warfare agent detection. Instead, we consider our primary expansion markets to be other segments in the healthcare market including the immunoassay and implantable/minimally invasive biosensor markets, with some initial penetration into the latter in Y2 and Y3.
|
Emerging Trend |
Motivation for Trend |
Addressable Roadblocks |
|
Development of minimally-invasive and ultimately of implantable glucose biosensors. |
Addresses compliance issues in patients having difficulty using current devices. |
Toxic chemicals required to overcome interference issues prevent implantation. |
| Conversion of existing immunoassays to electrochemical biosensor-based immunoassays. |
Eliminates time/equipment intensive sample pre-treatment steps. |
Biological elements are in trace amounts too small to be detected. Devices are not sensitive enough. |
4.2.1 Competition and Buying Patterns
Based on a prior art search and our cross-disciplinary technology expertise, we believe we are the only solution provider of our kind to medical device manufacturers. However, AgaMatrix indirectly competes against other biosensor-enhancing technologies. Rival technologies include advances in physical designs such as improvements in chemical reagents used in these devices and the integration of permselective membranes that are intended to materially filter out interfering chemicals from contacting the sensor. We have identified the research efforts of the following companies as potential competition due to their efforts to solve the same problems, albeit through very different approaches.
Strategy and Implementation Summary
AgaMatrix’s strategy will be built upon sustainable advantages from superior software technology, in-house expertise, monopolization of a scientific team, and development lead time over competitors. In addition, the company will deploy a strong intellectual property strategy of defensive and offensive patents to create an IP minefield to make litigation for competitors as costly as possible. Coupled with an aggressive marketing and sales strategy, AgaMatrix is positioned to be the leading provider of technology that enables biosensor devices used in medical and other life science applications.
5.1 Competitive Edge
Advantage #1: Superior and Complementary Software Paradigm
Potential indirect competition could lie within R&D departments of medical device OEMs who are striving to create both incrementally higher-performing biosensors for existing products. The R&D teams are also striving to make revolutionary advances which enable implantable biosensors such as blood glucose monitors. However, based on secondary market research and on first-hand conversations with potential customers/partners, the observed historical trend in this industry has been to approach chemical problems with chemical experts. We believe that our multi-disciplinary software approach fills a missing piece in the development of these devices.
From a technological standpoint, our software-based solutions achieve the same goals of interference suppression as rival chemical solutions; however, because we obviate the need for these chemicals, most of which are toxic, products deployed with AgaMatrix technology will be suited for in vivo applications, such as some minimally invasive and implantable glucose monitors. Furthermore, our technology can simultaneously monitor multiple chemicals, both the target analyte and any interfering chemicals, engendering low-cost multi-analyte sensors which are not readily viable with current chemical-based sensor enhancements.
From a marketing standpoint, our products have the advantage of being software-based, engendering many of the potential benefits that other software-based products traditionally enjoy. One of the principle advantages that end users would have is the ability to upgrade the software as new, better algorithms are developed, a benefit that cannot be as easily realized with other physical and chemical technological advances. From a cost-saving standpoint, many of the permselective membranes that are currently designed to be used in biosensor devices are too expensive to be used in all applications. As such, our software solutions would provide a cost benefit advantage to our customers.
Regardless of other traditional technology advances in sensor design, our DSP technologies will ultimately prove to be complementary. Our noise-filtering algorithms will increase the signal-to-noise ratio enabling greater sensitivity and lowering detection limits. In many applications, membrane filters are not fully effective; as such, our interference suppression algorithms can compensate for the limitations of such membranes. Additionally, rival empirical improvements cannot address other limitations of these devices, such as sensor deterioration, where our technology may be applied to auto-correct for such sources of error.
Advantage #2: In-House Expertise
As is the case with chemical and life science research, one of the most resource-intensive aspects of the development time lies in optimizing empirical protocols and avoiding unforeseen pitfalls; most of the knowledge comes from “hands-on” experience, not only theoretical background. Furthermore, expertise in multi-disciplinary areas as ours requires specialized knowledge. AgaMatrix’s scientific team has been involved in biosensor research for an aggregate of over 40 years. The foundational research for our current technology was initiated seven years ago, and our scientists have developed and optimized many of the techniques that are vital to the continuing development and validation of AgaMatrix’s products. To date, we have developed the groundbreaking technology approach, the experimental protocols, the validation mechanisms, and the core algorithms. Our extensive in-house expertise in working on bridging biosensor systems and DSP technologies represents a significant barrier to any potential competitor.
Advantage #3: Monopolization of Scientific Team
The technology that AgaMatrix is built upon has been inspired by research performed throughout the past decade at the University of Cambridge. The original scientific team that achieved these breakthroughs boasts inimitable credentials and has remained intact to form the current AgaMatrix R&D team. In the ensuing years, AgaMatrix has developed new technologies and is moving towards its commercialization. We believe that our virtual monopoly on the intellectual resources that have been responsible for the technological advances that AgaMatrix owns represents a significant competitive advantage over potential competitors. As is the case with any empirical endeavor, much of the in-house expertise comes in the form of a close working knowledge of the practical aspects of technology development. With the current R&D team already experienced in the relevant technologies, and having worked together in the past, much of this knowledge has already been acquired.
Advantage #4: Development Lead Time Over Potential Competition
In sharp contrast to the typical chemistry-based approach, AgaMatrix’s technology is based upon a multi-disciplinary core competency. Our competitive capabilities are derived from a unique confluence of electrical engineering and life science disciplines, a roadblock for potential competitors entrenched in traditional “wet chemistry” research paradigms.
5.2 Marketing Strategy
Presenting compelling value through superior technology
Because of AgaMatrix’s revolutionary, proprietary technology, we are positioned to be the market leader in biosensor enhancing solutions. AgaMatrix offers a novel approach that clearly provides significant value to our customer and ultimately the end user. The AgaMatrix solution delivers value in two ways: by improving the performance of their product against competing products and by increasing customers’ market share and revenue. Communicating this value to the device manufacturers, as well as branding our technology to defend market share, is the fundamental philosophy behind our marketing strategy.
Becoming a competitive standard
The core AgaMatrix technology is a unique approach to improving biosensors systems in a way that substantially increases performance and adds value to the end user. In a competitive marketplace, we will present our technology to medical device makers as an industry standard that they must adopt to be able to compete. Examples of this kind of standard-setting technology include the adoption of Windows platforms on PCs and auto-focus and red-eye reduction capabilities on cameras. Specific selling points include elimination of cross-interference, improvement in accuracy, improvement in signal to noise ratio, improvement in device robustness, reduction in sample requirements, and increase in market acceptance of product. The value proposition will differ depending on the needs of each customer.
Marketing to end users by marketing the end product
AgaMatrix will market to end users through partnership with the device makers; to add value, our technology must increase their bottom line profit. AgaMatrix can do this if end users appreciate the advantages AgaMatrix enhancements bring and if they require our products for a healthcare “standard of care.” The desire for end users, such as doctors and patients, to use the best and most effective technology for diagnosis and treatment of health problems will drive demand for AgaMatrix-enabled devices. Therefore, AgaMatrix will develop a marketing plan with our partners to increase the awareness of the clinical advantages of our devices. The AgaMatrix-enabled label will become a moral imperative to clinicians in the same way that advanced digital imaging technology is used by radiologists and cardiovascular specialists.
In summary, AgaMatrix will market both to the device makers we sell to and end customers, who will drive demand. Because device makers are concerned about increasing their bottom line through value-add to their products as well as through production cost reductions, AgaMatrix will sell to them on the basis of value rather than on any other consumer-based premise. End users, such as healthcare professionals and customers, demand standard of care. Therefore, AgaMatrix will co-market its brand as a necessary technology for healthcare diagnostics.
5.3 Sales Strategy
Phase 1: Sales to medical device manufacturer partners
In the first stage of bringing AgaMatrix technology to market, the company will approach and partner with medical device manufacturers. Such partnerships have the added advantages of product development that is supported by the partner’s engineering, finance, marketing, and management.
Phase 2: Becoming the “competitive standard”
With a base of customers who can vouch for the product value, AgaMatrix aims to become the competitive standard that all players must adopt. Specific marketing tactics in this stage include: increasing market awareness through trade shows (e.g., Medical Device Expo, SensorExpo) and technical conferences, advertising in trade journals and publications (e.g., Sensor Magazine, Medical Device and Diagnostics Magazine), and retaining “Thought Leaders” from industry and academia who will corroborate our claims.
Phase 3: Branding for mind share and market domination
AgaMatrix will brand its proprietary DSP technology to associate enhanced solutions with our identity. A consistent, strong, and clearly defined brand will add yet another barrier to entry and market penetration. Increased awareness of the advantages we deliver will give rise to increased demand for the end product.
5.3.1 Sales Forecast
The sales forecast is based on a royalties pricing model. However, a revenue model based on licensing fees is also described and provided for comparison purposes, below.
Charging on a royalty-based per-use fee, AgaMatrix will initially sell OEM technology solutions to manufacturers of biosensor-based medical devices that will enhance their products’ performance. Because AgaMatrix technology is software-based and is optimized for minimal hardware requirements, it can be easily integrated into existing sensor devices, boosting functionality on a cost-effective basis. By embedding our technology within their devices, OEMs will realize substantial gains (20% to over 100%) in performance dimensions such as accuracy, sensitivity, and robustness. Technology OEM royalty-based business models are not new in this business. Our ability to quickly provide performance upgrades in the form of easy-to-integrate software/firmware updates provides a number of technical and sales advantages over the existing development paradigm, which relies on “wet” chemistry approaches.
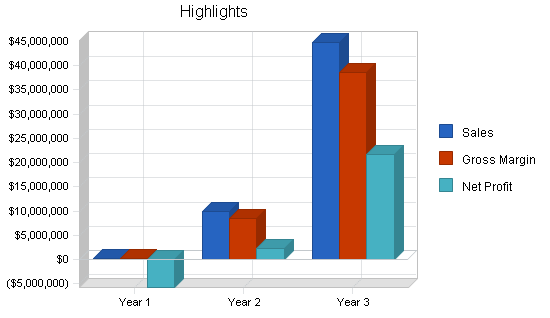
| Sales Forecast | |||
| Year 1 | Year 2 | Year 3 | |
| Sales | |||
| Test Strip Royalties (000) | $256,000 | $9,954,000 | $44,816,000 |
| Other | $0 | $0 | $0 |
| Total Sales | $256,000 | $9,954,000 | $44,816,000 |
| Direct Cost of Sales | Year 1 | Year 2 | Year 3 |
| Test Strip Royalties (000) | $37,500 | $1,500,000 | $6,270,000 |
| Other | $0 | $0 | $0 |
| Subtotal Direct Cost of Sales | $37,500 | $1,500,000 | $6,270,000 |
5.3.2 Pricing Model and Revenues
The primary value proposition that AgaMatrix presents to medical device manufacturers is increased revenues through increased market share from product advantages over other competing devices and from premium pricing for increased functionality and performance of their products. Because the new product offering from the manufacturer contains “best of” technology and is in the healthcare space, they can charge a premium for their product, which will translate into revenues to AgaMatrix. Another value proposition which a potential customer (i-STAT) actually brought to our attention is that our technology could very likely reduce production costs for them by allowing them to eliminate the need to use costly membranes in their products.
The pricing for our product can be either “value-added” pricing on the price of the medical device or based on device usage, depending on the revenue model used by our customers. In the case of the blood glucose market, revenues are driven not by the device, but rather by recurring revenues from consumable test strips. For example, the test strips that LifeScan sells retail for approximately $0.70 each. These test strips are supposed to be used three to four times a day, although the pain associated with testing has reduced compliance to about 1.5 tests per day per patient. AgaMatrix will share in the revenues this model generates. For example, every time a test strip is analyzed by the device that LifeScan sells, AgaMatrix technology will be utilized to provide a more accurate reading. Therefore, AgaMatrix will enter into a royalty-based fee agreement with device manufacturers, such as those in glucose monitoring, where consumables generate revenue. Preliminary conversations with Hypoguard indicate a general willingness to this type of pricing model.
Another example of how our royalty will work could be through the partnership with Company X. Company X manufactures and sells a point-of-care device for approximately $5,000. Test cartridges are priced at around $3.40 each and can perform 5-6 different tests once. For Company X, our product would solve an existing problem with the performance and reliability of their cartridges. Cartridges would be priced approximately $4.00 – $5.00. Company X manufactures these cartridges for $0.12-$0.16 each and should be amenable to sharing the increased margins. For cases in which consumables are not used, premium pricing of about +20% will be used depending on the added value that can be delivered to the end user. The following table summarizes a conservative revenue forecast based on royalties.
| Revenue |
2003 |
2004 |
2005 |
2006 |
| Blood Glucose |
$256,432 |
$9,954,009 |
$44,816,452 |
$94,571,316 |
| Implantable |
– |
$1,317,544 |
$2,879,816 |
$6,283,236 |
| Hospital POC |
– |
$1,013,627 |
$7,066,014 |
$11,367,777 |
|
Total Royalty Revenue |
$256,432 |
$12,285,180 |
$54,762,282 |
$112,222,328 |
An alternative pricing model would be to charge an annual licensing fee for each device enabling AgaMatrix technology. The value proposition to customers is the same: devices enabled with AgaMatrix technology will be more accurate and therefore require smaller blood samples and result in less pain, which will increase device and test strip sales. Pricing structures and terms of the company’s software modules and services will ultimately be determined by negotiations with customers. The most likely scenario will be a hybrid pricing model of flat licensing fees on devices and royalties on test strip sales. The following table summarizes a conservative revenue forecast based on a licensing structure.
| Revenue |
2003 |
2004 |
2005 |
2006 |
| Blood Glucose |
$100,879 |
$3,894,857 |
$18,693,271 |
$41,016,225 |
| Implantable |
– |
$1,317,544 |
$2,879,816 |
$6,283,236 |
| Hospital POC |
– |
$278,540 |
$3,035,925 |
$6,223,663 |
|
Total Royalty Revenue |
$100,879 |
$5,490,941 |
$24,609,011 |
$53,523,124 |
5.4 Intellectual Property Strategy
With a fully developed IP strategy consisting of core utility patents (currently filed as provisional applications) and defensive utility patents to be filed imminently, and based on our technological leadership, we believe that it would be far more beneficial for potential customers to purchase our technology than to develop it in-house.
5.5 Milestones
The following tables summarize the company’s developmental goals (month-to-month for Y1). Product Milestones are listed separately, below.
Phase 1
|
Months |
Business Milestones |
Operational Milestones |
| 1-3 | Secure 1st beta letter of intent with one small blood glucose monitor company | Set up HR and Finances Systems; set up lab |
| 4 | Secure final beta agreement and terms | |
| 5 | Determine short term partner targets |
Phase 2
|
Months |
Business Milestones |
Operational Milestones |
| 6 | Marketing face overhauled | Move to larger office |
| 7 | Determine future product requirements | 2nd Research Scientist hired |
| 8 | Utility patent #1 filed; 2 more Engineers hired | |
| 9 | Soft launch; secure 2nd beta agreement |
Phase 3
|
Months |
Business Milestones |
Operational Milestones |
| 10 | CEO and VP hired | |
| 11 | Secure institutional funding commitment for Year 2 and 3 | |
| 12 | Secure 2nd beta terms | Utility patent #2 filed |
| 13 | Secure first (small) paying glucose customer terms |
5.5.1 Year 2 and 3 Milestones
Year 2
- Business Milestones
- Secure two major paying POC customers
- Secure another small paying glucose customer
- Secure one major glucose beta customer
- Operational Milestones
- Move to larger office
- Hire 6 scientists, 8 engineers
- Hire product management and operations staff
Year 3 Milestones
- Secure one major paying glucose customer
- Secure one major implantable beta
- Expand to other POC players
5.5.2 Product Milestones
The following table summarizes the product development vision. Future products will all contain updated core DSP algorithm software, associated tools, and documentation of performance results, ensuring that we maximally leverage our existing technology base as productization evolves.
|
Quarter |
Milestone |
|
Y2; Q1 |
Customize AccuMatrix v1.0 for continued deployment onto other glucose biosensor devices Customize PosiMatrix v1.0 for continued deployment onto other point-of-care devices Begin development of VivoMatrix v1.0 for implantable glucose biosensor makers Improve algorithm functionality to address robustness & fouling issues |
|
Y2; Q2 |
Begin development of AccuMatrix v2.0 Improve algorithms to increase signal-to-noise ratio for higher sensitivity Begin development of PosiMatrix v2.0 Incorporate adaptive interference cancellation algorithms to auto-correct for unknown interferences |
|
Y2; Q4 |
Deliver AccuMatrix v2.0, PosiMatrix v2.0 |
|
Y3; Q1 |
Begin development of PosiMatrix v3.0, AccuMatrix v3.0 |
|
Y3; Q4 |
Deliver VivoMatrix v1.0, PosiMatrix v3.0, AccuMatrix v3.0 |
|
Y4; Q4 |
Deliver AccuMatrix v2.0, PosiMatrix v2.0, VivoMatrix v2.0 |
5.5.3 Summary of Current Accounts
|
Potential Customer or OEM Partner |
Current Product Desired |
Conversation Status |
|
Company A |
AccuMatrix interference suppression |
|
|
Company B |
Implantable biosensor anti-fouling |
|
|
Company C |
Alerting of bad readings |
|
|
Company D |
Not yet determined |
They have requested the blood data. |
|
Company E |
Monitoring of multiple analytes |
|
Web Plan Summary
AgaMatrix’s website will be a dynamic marketing tool for the company that serves the needs of business development, sales, and recruiting. The company site will provide information about AgaMatrix’s products and services for target customers and potential business partners, such as marketing collateral, technical white papers, and new product updates. As the company grows, its recruiting needs can be addressed by posting career opportunities and FAQs about the company. AgaMatrix.com will also communicate company news to create and maintain positive public relations with the community and investors. The goal will be to implement a functional and professionally designed website that can be adapted to meet the company’s growing needs.
6.1 Development Requirements
Creation of future versions of the AgaMatrix website will continue to be outsourced to Nathan Bailey, a professional graphics designer with over 15 years of experience. The contractor will work with the marketing department to conceptualize the company’s logo and overall design. It will be maintained in-house and major site redesigning will be made through a contractor.
Management Summary
The following are the current members of the AgaMatrix Team. Once a permanent CEO is on board, Sonny will transfer to a Director of Product Management role.
Sonny Vu, Chief Executive Officer and Founder
Sonny brings management and entrepreneurial experience from having worked in several of Microsoft’s product groups and having launched and built FireSpout, an enterprise software company. At Microsoft, he worked in a number of product development groups, including the natural language group responsible for shipping linguistic technologies to over 16 applications in 22 languages. While at FireSpout, Sonny created the original technology vision, recruited the technical teams, developed and managed the technology development and various operational processes, and developed the intellectual property strategy. Originally a mathematician by training, Sonny was a Ph.D. candidate at MIT prior to working in the software industry.
Dr. Sridhar Iyengar, Chief Technology Officer and Founder
With 10 years of research and engineering experience in DSP and mathematical modeling of chemical systems, Sridhar drives and directs the implementation of AgaMatrix’s technology vision. He is the leading expert in the core DSP/electrochemistry interdisciplinary approach used by AgaMatrix. Combining his background in electrical engineering and biological sciences, Sridhar conceived and pioneered the concept of using a DSP approach to enhance biosensor performance. His work in the years following his breakthrough Ph.D. research is the cornerstone for AgaMatrix’s intellectual property with two key patents filed under his name and another three defensive patents to be filed during the summer of 2002. Sridhar obtained his Ph.D. from the University of Cambridge as a Marshall Scholar.
Craig Bolon, Vice President of Engineering
With more than 35 years of management and technical experience in software and hardware engineering, Craig is responsible for executing AgaMatrix’s product development initiatives. He brings his leadership experiences from being a hands-on development engineer, team leader, general manager, engineering director, and entrepreneur. Craig has a proven track record of delivering on-time, on-budget projects while working on commercial product development in software and instrumentation for organizations such as Schlumberger, Polaroid, Betagen, Exxon, and MIT. His commercial product development work has spanned the fields of molecular biology, chemical analysis, electronic imaging, speech recognition, and mechanical design software. Craig has invented key technologies and holds a number of software and hardware patents. He holds a degree in particle physics from MIT.
Dr. Paul J. Kelly, Advisor
Paul is the founder and former CEO of Gemini Genomics plc, until its merger in 2001. A physician who specialized in endocrinology, he has more than 25 years of experience in medicine, and research in clinical and commercial settings. He has published extensively in over 90 publications, has an issued patent, and has held faculty appointments at the University of New South Wales and St. Vincent’s Hospital in Sydney, Australia. After launching Gemini Genomics in Cambridge, England, Paul went on to list the company on NASDAQ, in the most successful IPO of 2000 in the UK. He has served on national governmental advisory bodies, as well as on the boards of public and private companies, and non-profit institutions. Paul graduated in Medicine from the University of New South Wales, Sydney, and received his Doctor of Medicine degree for his thesis in the genetics of osteoporosis also from the University of New South Wales. He is a Fellow of the Australasian College of Physicians.
7.1 Personnel Plan
The personnel table assumes steady growth in employees over the next year. We expect head count to reach 14 employees by end of year one. We are in the process of implementing a strong benefits policy (with fully-paid medical, dental, and life insurance, plus a profit sharing and 401K plan). Employees generally earn competitive salaries and receive generous equity packages.
| Personnel Plan | |||
| Year 1 | Year 2 | Year 3 | |
| Combined Payroll | $780,750 | $4,181,056 | $6,013,186 |
| Other | $0 | $0 | $0 |
| Total People | 0 | 0 | 0 |
| Total Payroll | $780,750 | $4,181,056 | $6,013,186 |
Financial Plan
The following subtopics highlight the financial plan for AgaMatrix.
8.1 Break-even Analysis
The break-even analysis demonstrates that AgaMatrix will have a sales level running comfortably above break-even starting in year two. Depending on which pricing model is used – either royalties, licensing, or both – average revenue could vary significantly, but the table shows a fair estimate given our revenue projections.
The business will have very few fixed costs – most laboratory equipment can be leased, as will the real estate for our offices. All costs are expected to be variable for modeling purposes, giving the company flexibility to adapt as needs and environmental conditions may change. Because AgaMatrix technology is software-based and is optimized for minimal hardware requirements, it can be easily distributed and integrated into biosensor devices with advantages of economies of scale. As volume increases, average variable costs will significantly decrease.

| Break-even Analysis | |
| Monthly Revenue Break-even | $583,407 |
| Assumptions: | |
| Average Percent Variable Cost | 15% |
| Estimated Monthly Fixed Cost | $497,947 |
8.2 Important Assumptions
The financial plan depends on important assumptions, most of which are shown in the following table. The key underlying assumptions are:
- We assume a slow-growth economy, without major recession.
- We assume of course that there are no unforeseen changes in technology to make our products immediately obsolete.
- We assume access to equity capital and financing sufficient to maintain our financial plan as shown in the tables.
Financial projections are predicated upon targeting the life sciences vertical exclusively. Within the life sciences market, blood glucose will drive the majority of revenue. However, the point-of-care testing market will contribute modest revenue in the near term, accompanied by a substantial contribution from the implantable market in the medium and long term.
| General Assumptions | |||
| Year 1 | Year 2 | Year 3 | |
| Plan Month | 1 | 2 | 3 |
| Current Interest Rate | 8.00% | 8.00% | 8.00% |
| Long-term Interest Rate | 10.00% | 10.00% | 10.00% |
| Tax Rate | 30.00% | 30.00% | 30.00% |
| Other | 0 | 0 | 0 |
8.3 Projected Profit and Loss
Gross and operating margins
Gross margins will be approximately 85% on the core product offering, which will be delivered in the form of software. Such margins are typical in the software industry; we have not modeled in support revenue streams for our products, assuming this will be handled entirely by our OEM customers. In year one, we expect a loss, as we grow the business from a small base by conserving cash. Beginning in year two (post-institutional funding), as we ramp up the business more aggressively, operating expenses as a percent of revenue will fall as we hire a critical mass of personnel for marketing, sales, and research and development. By the end of the forecast horizon, operating margins will once again exceed 30%.
Profit potential and durability
AgaMatrix is expected to be net income positive beginning in its second full year of operations. Profitability is expected to grow rapidly following year two, once the business is able to leverage the investment from the year two ramp-up. AgaMatrix has the potential to be an enduring standalone business, supported by a diversified revenue stream within the life sciences vertical (blood glucose, point-of-care testing and minimally invasive/implantable devices), with the opportunity to expand into other sub-segments in the healthcare sector and new verticals for long-term growth.


| Pro Forma Profit and Loss | |||
| Year 1 | Year 2 | Year 3 | |
| Sales | $256,000 | $9,954,000 | $44,816,000 |
| Direct Cost of Sales | $37,500 | $1,500,000 | $6,270,000 |
| Other Production Expenses | $0 | $0 | $0 |
| Total Cost of Sales | $37,500 | $1,500,000 | $6,270,000 |
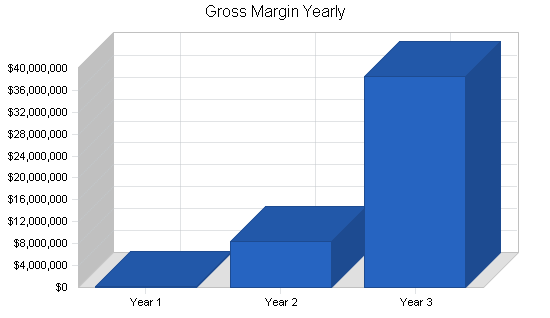
| Gross Margin | $218,500 | $8,454,000 | $38,546,000 |
| Gross Margin % | 85.35% | 84.93% | 86.01% |
| Expenses | |||
| Payroll | $780,750 | $4,181,056 | $6,013,186 |
| Sales and Marketing and Other Expenses | $4,915,400 | $245,000 | $450,000 |
| Depreciation | $0 | $0 | $0 |
| Leased Equipment | $0 | $0 | $0 |
| Utilities | $3,400 | $6,300 | $8,000 |
| Insurance | $44,000 | $65,000 | $80,000 |
| Rent | $114,700 | $120,000 | $120,000 |
| Payroll Taxes | $117,113 | $627,158 | $901,978 |
| Other | $0 | $0 | $0 |
| Total Operating Expenses | $5,975,363 | $5,244,514 | $7,573,164 |
| Profit Before Interest and Taxes | ($5,756,863) | $3,209,486 | $30,972,836 |
| EBITDA | ($5,756,863) | $3,209,486 | $30,972,836 |
| Interest Expense | $1,419 | $1,250 | $1,025 |
| Taxes Incurred | $0 | $962,471 | $9,291,543 |
| Net Profit | ($5,758,281) | $2,245,765 | $21,680,268 |
| Net Profit/Sales | -2249.33% | 22.56% | 48.38% |
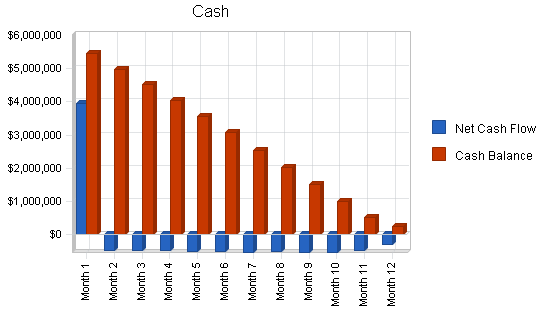
8.4 Projected Cash Flow
The financial outlook is positive as the company rolls out and meets its milestones. After financing, cash flow will be negative for year one. By year two, AgaMatrix expects to be cash flow positive.
| Pro Forma Cash Flow | |||
| Year 1 | Year 2 | Year 3 | |
| Cash Received | |||
| Cash from Operations | |||
| Cash Sales | $256,000 | $9,954,000 | $44,816,000 |
| Subtotal Cash from Operations | $256,000 | $9,954,000 | $44,816,000 |
| Additional Cash Received | |||
| Sales Tax, VAT, HST/GST Received | $0 | $0 | $0 |
| New Current Borrowing | $0 | $0 | $0 |
| New Other Liabilities (interest-free) | $0 | $0 | $0 |
| New Long-term Liabilities | $0 | $0 | $0 |
| Sales of Other Current Assets | $0 | $0 | $0 |
| Sales of Long-term Assets | $0 | $0 | $0 |
| New Investment Received | $4,075,000 | $0 | $0 |
| Subtotal Cash Received | $4,331,000 | $9,954,000 | $44,816,000 |
| Expenditures | Year 1 | Year 2 | Year 3 |
| Expenditures from Operations | |||
| Cash Spending | $780,750 | $4,181,056 | $6,013,186 |
| Bill Payments | $4,812,657 | $3,663,149 | $16,005,119 |
| Subtotal Spent on Operations | $5,593,407 | $7,844,205 | $22,018,305 |
| Additional Cash Spent | |||
| Sales Tax, VAT, HST/GST Paid Out | $0 | $0 | $0 |
| Principal Repayment of Current Borrowing | $0 | $0 | $0 |
| Other Liabilities Principal Repayment | $0 | $0 | $0 |
| Long-term Liabilities Principal Repayment | $1,500 | $2,000 | $2,500 |
| Purchase Other Current Assets | $0 | $0 | $0 |
| Purchase Long-term Assets | $0 | $0 | $0 |
| Dividends | $0 | $0 | $0 |
| Subtotal Cash Spent | $5,594,907 | $7,846,205 | $22,020,805 |
| Net Cash Flow | ($1,263,907) | $2,107,795 | $22,795,195 |
| Cash Balance | $251,193 | $2,358,989 | $25,154,184 |
8.5 Projected Balance Sheet
Our projected balance sheet shows an increase in net worth. The monthly projections for the first year are in the appendix. Net worth is negative initially because the company does not expect to secure its first paying customer until end of year one.
| Pro Forma Balance Sheet | |||
| Year 1 | Year 2 | Year 3 | |
| Assets | |||
| Current Assets | |||
| Cash | $251,193 | $2,358,989 | $25,154,184 |
| Other Current Assets | $0 | $0 | $0 |
| Total Current Assets | $251,193 | $2,358,989 | $25,154,184 |
| Long-term Assets | |||
| Long-term Assets | $0 | $0 | $0 |
| Accumulated Depreciation | $0 | $0 | $0 |
| Total Long-term Assets | $0 | $0 | $0 |
| Total Assets | $251,193 | $2,358,989 | $25,154,184 |
| Liabilities and Capital | Year 1 | Year 2 | Year 3 |
| Current Liabilities | |||
| Accounts Payable | $425,875 | $289,905 | $1,407,333 |
| Current Borrowing | $0 | $0 | $0 |
| Other Current Liabilities | $0 | $0 | $0 |
| Subtotal Current Liabilities | $425,875 | $289,905 | $1,407,333 |
| Long-term Liabilities | $13,500 | $11,500 | $9,000 |
| Total Liabilities | $439,375 | $301,405 | $1,416,333 |
| Paid-in Capital | $5,575,000 | $5,575,000 | $5,575,000 |
| Retained Earnings | ($4,900) | ($5,763,181) | ($3,517,416) |
| Earnings | ($5,758,281) | $2,245,765 | $21,680,268 |
| Total Capital | ($188,181) | $2,057,584 | $23,737,851 |
| Total Liabilities and Capital | $251,193 | $2,358,989 | $25,154,184 |
| Net Worth | ($188,181) | $2,057,584 | $23,737,851 |
8.6 Financial Risks and Contingencies
We have identified several critical risks and assumptions that must be addressed to ensure AgaMatrix’s success.
Market Risks
Risk #1: Corporate R&D labs of our customers/partners may develop competing DSP-based technologies to enhance their own electrochemical sensors based products.
See section 4 for a detailed discussion of competition and AgaMatrix’s sustainable competitive advantages.
Risk #2: Other technologies may be developed to improve sensor performance.
Other technology solutions designed to improve sensor performance have been generally hardware-based introducing additional costs and at times toxic chemicals. For example, MEMS-based infrared sensors, being developed as an alternative to electrochemical sensors, are expected to be much more costly despite increased performance. Similarly, mediators such as ferrocene are used to deliver accurate readings, but are toxic and less effective than AgaMatrix’s solution. AgaMatrix software-based solution improves performance while being cost effective and safe.
Risk #3: As a pioneer in electrochemical applications for DSP algorithms, AgaMatrix may not be able to convince customers to adopt such a revolutionary solution.
Developers of blood glucose monitors and portable blood analyzers have never considered using a software-based approach to solving their accuracy and cross-interference problems. There is thus a psychological barrier that we believe can be overcome through a simple, concrete demonstration of low-cost performance gains which we can provide.
Risk #4: There may not be enough computing power and memory on blood glucose monitoring devices and portable blood analyzers to support AgaMatrix’s software.
The algorithms have been optimized for computational speed and are designed for use on devices with very little CPU resources. Initial customer feed back shows that AgaMatrix’s algorithms can be incorporated in next-generation ASICS designs for blood glucose monitoring devices, as well as into current microprocessor-powered portable blood analyzers.
Risk #5: Implantable blood glucose sensors may be prolonged from the marketplace indefinitely.
Although most blood glucose monitoring device companies are trying to develop implantable sensors, other technical and marketing issues may prevent the eventual adoption of the artificial pancreas. AgaMatrix’s technology will accelerate the development of the artificial pancreas by not requiring toxic mediators. However, AgaMatrix cannot solely depend on this market’s development, and has thus chosen to focus on existing markets to drive short to medium term revenue.
Risk #6: AgaMatrix must prove out the technology on blood samples.
Despite a high confidence in the technology, we must still create experimental data sets created from tests using actual blood samples. These data sets will be shown to customers as proof of the technology’s effectiveness. AgaMatrix is confident that after initial funding, lab space and equipment can be quickly secured to produce these data sets.
Risk #7: AgaMatrix may face regulatory delays from FDA approval.
We will work with our customers to ensure that the technologies that are deployed into their devices will incur minimal regulatory risks thereby complying with the FDA’s less onerous regulations for a “derivative device” (compared to the approval process for a completely new device).
Risk #8: AgaMatrix needs to determine customer willingness to pay and secure concrete deals with customers.
Several conversations with potential customers have already reached the level of discussing potential pricing structures so we believe there is some genuine interest.
Risk #9: Each OEM customer will require a custom-built version of the AgaMatrix software.
The software suite will be designed to be a modular and scalable platform technology. We will construct a set of configuration and integration tools designed to translate our core technology into suitable deployment formats.
Risk #10: University of Cambridge may have claims to AgaMatrix’s technologies.
The technology is based on 3rd generation algorithms that AgaMatrix alone has been developing for two years. 1st and 2nd generation technologies were developed at the University of Cambridge and validated the proof of concept of using a DSP approach to solving many of the outstanding problems in biosensors. Our 3rd generation technology is fundamentally different from the earlier technologies and has overcome a number of critical limitations, on both the theoretical and empirical sides, that prevent commercialization. AgaMatrix owns all rights to these 3rd generation technologies. The 1st and 2nd generation technologies, while illustrative of the concept, do not pose any commercial threat due to fundamental technological limitations
Financial Risks
Risk #1: Working Capital Management – We expect to be running a significant working capital deficit because of the time it will take to establish payment schedules (e.g. quarterly royalties from partners) and receive payments from large OEM vendors while, as an early-stage company, we will simultaneously have to make payments on our supplies on a short-term basis. Managing the cash conversion cycle will be critical to ensuring liquidity and solvency.
Risk #2: Seasonal, Cyclical, or Highly Volatile Cash Flows – at this time, we expect there to be volatility in our cash flows based primarily on the new product introduction cycles of major medical devices manufacturers. Therefore our revenue and cash flow streams will not be smooth throughout the year, but will be stronger during times of new product introduction. By targeting three different market segments early on (blood glucose, point-of-care, and implantable devices) we aim to mitigate this risk.
Risk #3: Concentration of Customers – The blood glucose market and portable blood analyzer markets are dominated by an oligopoly of a handful of companies. It may be difficult to diversify our customer base sufficiently to prevent large swings in our revenue and cash flow based upon the actions of a small number of customers. To diminish this risk, we will initially target smaller players who will move more quickly and provide us with greater leverage when we go to negotiate with larger customers.
8.7 Business Ratios
Business ratios for the years of this plan are shown below. Industry profile ratios based on the Standard Industrial Classification (SIC) code 7373 or NAICS code 541512, Computer Systems Design Services, are shown for comparison.
| Ratio Analysis | ||||
| Year 1 | Year 2 | Year 3 | Industry Profile | |
| Sales Growth | 0.00% | 3788.28% | 350.23% | 16.45% |
| Percent of Total Assets | ||||
| Other Current Assets | 0.00% | 0.00% | 0.00% | 63.87% |
| Total Current Assets | 100.00% | 100.00% | 100.00% | 94.15% |
| Long-term Assets | 0.00% | 0.00% | 0.00% | 5.85% |
| Total Assets | 100.00% | 100.00% | 100.00% | 100.00% |
| Current Liabilities | 169.54% | 12.29% | 5.59% | 33.55% |
| Long-term Liabilities | 5.37% | 0.49% | 0.04% | 21.29% |
| Total Liabilities | 174.91% | 12.78% | 5.63% | 54.84% |
| Net Worth | -74.91% | 87.22% | 94.37% | 45.16% |
| Percent of Sales | ||||
| Sales | 100.00% | 100.00% | 100.00% | 100.00% |
| Gross Margin | 85.35% | 84.93% | 86.01% | 100.00% |
| Selling, General & Administrative Expenses | 1351.46% | 57.96% | 36.23% | 77.82% |
| Advertising Expenses | 8.98% | 0.60% | 0.27% | 1.65% |
| Profit Before Interest and Taxes | -2248.77% | 32.24% | 69.11% | 0.36% |
| Main Ratios | ||||
| Current | 0.59 | 8.14 | 17.87 | 1.97 |
| Quick | 0.59 | 8.14 | 17.87 | 1.57 |
| Total Debt to Total Assets | 174.91% | 12.78% | 5.63% | 65.50% |
| Pre-tax Return on Net Worth | 3059.97% | 155.92% | 130.47% | 0.53% |
| Pre-tax Return on Assets | -2292.37% | 136.00% | 123.13% | 1.52% |
| Additional Ratios | Year 1 | Year 2 | Year 3 | |
| Net Profit Margin | -2249.33% | 22.56% | 48.38% | n.a |
| Return on Equity | 0.00% | 109.15% | 91.33% | n.a |
| Activity Ratios | ||||
| Accounts Payable Turnover | 12.29 | 12.17 | 12.17 | n.a |
| Payment Days | 27 | 37 | 18 | n.a |
| Total Asset Turnover | 1.02 | 4.22 | 1.78 | n.a |
| Debt Ratios | ||||
| Debt to Net Worth | 0.00 | 0.15 | 0.06 | n.a |
| Current Liab. to Liab. | 0.97 | 0.96 | 0.99 | n.a |
| Liquidity Ratios | ||||
| Net Working Capital | ($174,681) | $2,069,084 | $23,746,851 | n.a |
| Interest Coverage | -4,057.70 | 2,567.59 | 30,217.40 | n.a |
| Additional Ratios | ||||
| Assets to Sales | 0.98 | 0.24 | 0.56 | n.a |
| Current Debt/Total Assets | 170% | 12% | 6% | n.a |
| Acid Test | 0.59 | 8.14 | 17.87 | n.a |
| Sales/Net Worth | 0.00 | 4.84 | 1.89 | n.a |
| Dividend Payout | 0.00 | 0.00 | 0.00 | n.a |
Appendix
| Sales Forecast | |||||||||||||
| Month 1 | Month 2 | Month 3 | Month 4 | Month 5 | Month 6 | Month 7 | Month 8 | Month 9 | Month 10 | Month 11 | Month 12 | ||
| Sales | |||||||||||||
| Test Strip Royalties (000) | 0% | $0 | $0 | $0 | $0 | $0 | $0 | $0 | $0 | $0 | $0 | $0 | $256,000 |
| Other | 0% | $0 | $0 | $0 | $0 | $0 | $0 | $0 | $0 | $0 | $0 | $0 | $0 |
| Total Sales | $0 | $0 | $0 | $0 | $0 | $0 | $0 | $0 | $0 | $0 | $0 | $256,000 | |
| Direct Cost of Sales | Month 1 | Month 2 | Month 3 | Month 4 | Month 5 | Month 6 | Month 7 | Month 8 | Month 9 | Month 10 | Month 11 | Month 12 | |
| Test Strip Royalties (000) | $5,000 | $1,500 | $1,500 | $1,500 | $1,500 | $9,500 | $1,500 | $1,500 | $1,500 | $9,500 | $1,500 | $1,500 | |
| Other | $0 | $0 | $0 | $0 | $0 | $0 | $0 | $0 | $0 | $0 | $0 | $0 | |
| Subtotal Direct Cost of Sales | $5,000 | $1,500 | $1,500 | $1,500 | $1,500 | $9,500 | $1,500 | $1,500 | $1,500 | $9,500 | $1,500 | $1,500 | |
| Personnel Plan | |||||||||||||
| Month 1 | Month 2 | Month 3 | Month 4 | Month 5 | Month 6 | Month 7 | Month 8 | Month 9 | Month 10 | Month 11 | Month 12 | ||
| Combined Payroll | 0% | $36,583 | $43,250 | $47,000 | $47,000 | $54,500 | $57,417 | $76,250 | $76,250 | $76,250 | $88,750 | $88,750 | $88,750 |
| Other | 0% | $0 | $0 | $0 | $0 | $0 | $0 | $0 | $0 | $0 | $0 | $0 | $0 |
| Total People | 0 | 0 | 0 | 0 | 0 | 0 | 0 | 0 | 0 | 0 | 0 | 0 | |
| Total Payroll | $36,583 | $43,250 | $47,000 | $47,000 | $54,500 | $57,417 | $76,250 | $76,250 | $76,250 | $88,750 | $88,750 | $88,750 | |
| General Assumptions | |||||||||||||
| Month 1 | Month 2 | Month 3 | Month 4 | Month 5 | Month 6 | Month 7 | Month 8 | Month 9 | Month 10 | Month 11 | Month 12 | ||
| Plan Month | 1 | 2 | 3 | 4 | 5 | 6 | 7 | 8 | 9 | 10 | 11 | 12 | |
| Current Interest Rate | 8.00% | 8.00% | 8.00% | 8.00% | 8.00% | 8.00% | 8.00% | 8.00% | 8.00% | 8.00% | 8.00% | 8.00% | |
| Long-term Interest Rate | 10.00% | 10.00% | 10.00% | 10.00% | 10.00% | 10.00% | 10.00% | 10.00% | 10.00% | 10.00% | 10.00% | 10.00% | |
| Tax Rate | 30.00% | 30.00% | 30.00% | 30.00% | 30.00% | 30.00% | 30.00% | 30.00% | 30.00% | 30.00% | 30.00% | 30.00% | |
| Other | 0 | 0 | 0 | 0 | 0 | 0 | 0 | 0 | 0 | 0 | 0 | 0 | |
| Pro Forma Profit and Loss | |||||||||||||
| Month 1 | Month 2 | Month 3 | Month 4 | Month 5 | Month 6 | Month 7 | Month 8 | Month 9 | Month 10 | Month 11 | Month 12 | ||
| Sales | $0 | $0 | $0 | $0 | $0 | $0 | $0 | $0 | $0 | $0 | $0 | $256,000 | |
| Direct Cost of Sales | $5,000 | $1,500 | $1,500 | $1,500 | $1,500 | $9,500 | $1,500 | $1,500 | $1,500 | $9,500 | $1,500 | $1,500 | |
| Other Production Expenses | $0 | $0 | $0 | $0 | $0 | $0 | $0 | $0 | $0 | $0 | $0 | $0 | |
| Total Cost of Sales | $5,000 | $1,500 | $1,500 | $1,500 | $1,500 | $9,500 | $1,500 | $1,500 | $1,500 | $9,500 | $1,500 | $1,500 | |
| Gross Margin | ($5,000) | ($1,500) | ($1,500) | ($1,500) | ($1,500) | ($9,500) | ($1,500) | ($1,500) | ($1,500) | ($9,500) | ($1,500) | $254,500 | |
| Gross Margin % | 0.00% | 0.00% | 0.00% | 0.00% | 0.00% | 0.00% | 0.00% | 0.00% | 0.00% | 0.00% | 0.00% | 99.41% | |
| Expenses | |||||||||||||
| Payroll | $36,583 | $43,250 | $47,000 | $47,000 | $54,500 | $57,417 | $76,250 | $76,250 | $76,250 | $88,750 | $88,750 | $88,750 | |
| Sales and Marketing and Other Expenses | $407,150 | $406,150 | $406,150 | $406,150 | $406,150 | $415,150 | $406,650 | $408,650 | $408,650 | $424,150 | $410,200 | $410,200 | |
| Depreciation | $0 | $0 | $0 | $0 | $0 | $0 | $0 | $0 | $0 | $0 | $0 | $0 | |
| Leased Equipment | $0 | $0 | $0 | $0 | $0 | $0 | $0 | $0 | $0 | $0 | $0 | $0 | |
| Utilities | $220 | $240 | $260 | $260 | $260 | $260 | $260 | $320 | $320 | $320 | $340 | $340 | |
| Insurance | $2,400 | $2,800 | $3,200 | $3,200 | $3,200 | $3,200 | $3,200 | $4,400 | $4,400 | $4,400 | $4,800 | $4,800 | |
| Rent | $8,535 | $8,545 | $8,555 | $8,555 | $8,555 | $10,255 | $10,255 | $10,285 | $10,285 | $10,285 | $10,295 | $10,295 | |
| Payroll Taxes | 15% | $5,487 | $6,488 | $7,050 | $7,050 | $8,175 | $8,613 | $11,438 | $11,438 | $11,438 | $13,313 | $13,313 | $13,313 |
| Other | $0 | $0 | $0 | $0 | $0 | $0 | $0 | $0 | $0 | $0 | $0 | $0 | |
| Total Operating Expenses | $460,375 | $467,473 | $472,215 | $472,215 | $480,840 | $494,895 | $508,053 | $511,343 | $511,343 | $541,218 | $527,698 | $527,698 | |
| Profit Before Interest and Taxes | ($465,375) | ($468,973) | ($473,715) | ($473,715) | ($482,340) | ($504,395) | ($509,553) | ($512,843) | ($512,843) | ($550,718) | ($529,198) | ($273,198) | |
| EBITDA | ($465,375) | ($468,973) | ($473,715) | ($473,715) | ($482,340) | ($504,395) | ($509,553) | ($512,843) | ($512,843) | ($550,718) | ($529,198) | ($273,198) | |
| Interest Expense | $124 | $123 | $122 | $121 | $120 | $119 | $118 | $117 | $116 | $115 | $114 | $113 | |
| Taxes Incurred | $0 | $0 | $0 | $0 | $0 | $0 | $0 | $0 | $0 | $0 | $0 | $0 | |
| Net Profit | ($465,499) | ($469,095) | ($473,837) | ($473,836) | ($482,460) | ($504,513) | ($509,670) | ($512,959) | ($512,958) | ($550,832) | ($529,311) | ($273,310) | |
| Net Profit/Sales | 0.00% | 0.00% | 0.00% | 0.00% | 0.00% | 0.00% | 0.00% | 0.00% | 0.00% | 0.00% | 0.00% | -106.76% | |
| Pro Forma Cash Flow | |||||||||||||
| Month 1 | Month 2 | Month 3 | Month 4 | Month 5 | Month 6 | Month 7 | Month 8 | Month 9 | Month 10 | Month 11 | Month 12 | ||
| Cash Received | |||||||||||||
| Cash from Operations | |||||||||||||
| Cash Sales | $0 | $0 | $0 | $0 | $0 | $0 | $0 | $0 | $0 | $0 | $0 | $256,000 | |
| Subtotal Cash from Operations | $0 | $0 | $0 | $0 | $0 | $0 | $0 | $0 | $0 | $0 | $0 | $256,000 | |
| Additional Cash Received | |||||||||||||
| Sales Tax, VAT, HST/GST Received | 0.00% | $0 | $0 | $0 | $0 | $0 | $0 | $0 | $0 | $0 | $0 | $0 | $0 |
| New Current Borrowing | $0 | $0 | $0 | $0 | $0 | $0 | $0 | $0 | $0 | $0 | $0 | $0 | |
| New Other Liabilities (interest-free) | $0 | $0 | $0 | $0 | $0 | $0 | $0 | $0 | $0 | $0 | $0 | $0 | |
| New Long-term Liabilities | $0 | $0 | $0 | $0 | $0 | $0 | $0 | $0 | $0 | $0 | $0 | $0 | |
| Sales of Other Current Assets | $0 | $0 | $0 | $0 | $0 | $0 | $0 | $0 | $0 | $0 | $0 | $0 | |
| Sales of Long-term Assets | $0 | $0 | $0 | $0 | $0 | $0 | $0 | $0 | $0 | $0 | $0 | $0 | |
| New Investment Received | $4,000,000 | $0 | $0 | $0 | $0 | $0 | $0 | $0 | $0 | $0 | $75,000 | $0 | |
| Subtotal Cash Received | $4,000,000 | $0 | $0 | $0 | $0 | $0 | $0 | $0 | $0 | $0 | $75,000 | $256,000 | |
| Expenditures | Month 1 | Month 2 | Month 3 | Month 4 | Month 5 | Month 6 | Month 7 | Month 8 | Month 9 | Month 10 | Month 11 | Month 12 | |
| Expenditures from Operations | |||||||||||||
| Cash Spending | $36,583 | $43,250 | $47,000 | $47,000 | $54,500 | $57,417 | $76,250 | $76,250 | $76,250 | $88,750 | $88,750 | $88,750 | |
| Bill Payments | $19,297 | $428,814 | $425,878 | $426,837 | $426,873 | $428,598 | $446,640 | $433,530 | $436,709 | $437,554 | $461,365 | $440,561 | |
| Subtotal Spent on Operations | $55,880 | $472,064 | $472,878 | $473,837 | $481,373 | $486,015 | $522,890 | $509,780 | $512,959 | $526,304 | $550,115 | $529,311 | |
| Additional Cash Spent | |||||||||||||
| Sales Tax, VAT, HST/GST Paid Out | $0 | $0 | $0 | $0 | $0 | $0 | $0 | $0 | $0 | $0 | $0 | $0 | |
| Principal Repayment of Current Borrowing | $0 | $0 | $0 | $0 | $0 | $0 | $0 | $0 | $0 | $0 | $0 | $0 | |
| Other Liabilities Principal Repayment | $0 | $0 | $0 | $0 | $0 | $0 | $0 | $0 | $0 | $0 | $0 | $0 | |
| Long-term Liabilities Principal Repayment | $125 | $125 | $125 | $125 | $125 | $125 | $125 | $125 | $125 | $125 | $125 | $125 | |
| Purchase Other Current Assets | $0 | $0 | $0 | $0 | $0 | $0 | $0 | $0 | $0 | $0 | $0 | $0 | |
| Purchase Long-term Assets | $0 | $0 | $0 | $0 | $0 | $0 | $0 | $0 | $0 | $0 | $0 | $0 | |
| Dividends | $0 | $0 | $0 | $0 | $0 | $0 | $0 | $0 | $0 | $0 | $0 | $0 | |
| Subtotal Cash Spent | $56,005 | $472,189 | $473,003 | $473,962 | $481,498 | $486,140 | $523,015 | $509,905 | $513,084 | $526,429 | $550,240 | $529,436 | |
| Net Cash Flow | $3,943,995 | ($472,189) | ($473,003) | ($473,962) | ($481,498) | ($486,140) | ($523,015) | ($509,905) | ($513,084) | ($526,429) | ($475,240) | ($273,436) | |
| Cash Balance | $5,459,095 | $4,986,906 | $4,513,902 | $4,039,940 | $3,558,442 | $3,072,302 | $2,549,287 | $2,039,382 | $1,526,298 | $999,869 | $524,629 | $251,193 | |
| Pro Forma Balance Sheet | |||||||||||||
| Month 1 | Month 2 | Month 3 | Month 4 | Month 5 | Month 6 | Month 7 | Month 8 | Month 9 | Month 10 | Month 11 | Month 12 | ||
| Assets | Starting Balances | ||||||||||||
| Current Assets | |||||||||||||
| Cash | $1,515,100 | $5,459,095 | $4,986,906 | $4,513,902 | $4,039,940 | $3,558,442 | $3,072,302 | $2,549,287 | $2,039,382 | $1,526,298 | $999,869 | $524,629 | $251,193 |
| Other Current Assets | $0 | $0 | $0 | $0 | $0 | $0 | $0 | $0 | $0 | $0 | $0 | $0 | $0 |
| Total Current Assets | $1,515,100 | $5,459,095 | $4,986,906 | $4,513,902 | $4,039,940 | $3,558,442 | $3,072,302 | $2,549,287 | $2,039,382 | $1,526,298 | $999,869 | $524,629 | $251,193 |
| Long-term Assets | |||||||||||||
| Long-term Assets | $0 | $0 | $0 | $0 | $0 | $0 | $0 | $0 | $0 | $0 | $0 | $0 | $0 |
| Accumulated Depreciation | $0 | $0 | $0 | $0 | $0 | $0 | $0 | $0 | $0 | $0 | $0 | $0 | $0 |
| Total Long-term Assets | $0 | $0 | $0 | $0 | $0 | $0 | $0 | $0 | $0 | $0 | $0 | $0 | $0 |
| Total Assets | $1,515,100 | $5,459,095 | $4,986,906 | $4,513,902 | $4,039,940 | $3,558,442 | $3,072,302 | $2,549,287 | $2,039,382 | $1,526,298 | $999,869 | $524,629 | $251,193 |
| Liabilities and Capital | Month 1 | Month 2 | Month 3 | Month 4 | Month 5 | Month 6 | Month 7 | Month 8 | Month 9 | Month 10 | Month 11 | Month 12 | |
| Current Liabilities | |||||||||||||
| Accounts Payable | $5,000 | $414,619 | $411,651 | $412,609 | $412,608 | $413,694 | $432,193 | $418,973 | $422,152 | $422,151 | $446,679 | $425,876 | $425,875 |
| Current Borrowing | $0 | $0 | $0 | $0 | $0 | $0 | $0 | $0 | $0 | $0 | $0 | $0 | $0 |
| Other Current Liabilities | $0 | $0 | $0 | $0 | $0 | $0 | $0 | $0 | $0 | $0 | $0 | $0 | $0 |
| Subtotal Current Liabilities | $5,000 | $414,619 | $411,651 | $412,609 | $412,608 | $413,694 | $432,193 | $418,973 | $422,152 | $422,151 | $446,679 | $425,876 | $425,875 |
| Long-term Liabilities | $15,000 | $14,875 | $14,750 | $14,625 | $14,500 | $14,375 | $14,250 | $14,125 | $14,000 | $13,875 | $13,750 | $13,625 | $13,500 |
| Total Liabilities | $20,000 | $429,494 | $426,401 | $427,234 | $427,108 | $428,069 | $446,443 | $433,098 | $436,152 | $436,026 | $460,429 | $439,501 | $439,375 |
| Paid-in Capital | $1,500,000 | $5,500,000 | $5,500,000 | $5,500,000 | $5,500,000 | $5,500,000 | $5,500,000 | $5,500,000 | $5,500,000 | $5,500,000 | $5,500,000 | $5,575,000 | $5,575,000 |
| Retained Earnings | ($4,900) | ($4,900) | ($4,900) | ($4,900) | ($4,900) | ($4,900) | ($4,900) | ($4,900) | ($4,900) | ($4,900) | ($4,900) | ($4,900) | ($4,900) |
| Earnings | $0 | ($465,499) | ($934,595) | ($1,408,432) | ($1,882,268) | ($2,364,727) | ($2,869,241) | ($3,378,911) | ($3,891,870) | ($4,404,828) | ($4,955,660) | ($5,484,971) | ($5,758,281) |
| Total Capital | $1,495,100 | $5,029,601 | $4,560,505 | $4,086,668 | $3,612,832 | $3,130,373 | $2,625,859 | $2,116,189 | $1,603,230 | $1,090,272 | $539,440 | $85,129 | ($188,181) |
| Total Liabilities and Capital | $1,515,100 | $5,459,095 | $4,986,906 | $4,513,902 | $4,039,940 | $3,558,442 | $3,072,302 | $2,549,287 | $2,039,382 | $1,526,298 | $999,869 | $524,629 | $251,193 |
| Net Worth | $1,495,100 | $5,029,601 | $4,560,505 | $4,086,668 | $3,612,832 | $3,130,373 | $2,625,859 | $2,116,189 | $1,603,230 | $1,090,272 | $539,440 | $85,129 | ($188,181) |

