
Scan Lab
Executive Summary
Scan Lab Medical Imaging is a start-up company offering a wide range of medical image scanning tests for the New Bedford, Massachusetts community.
The Market
Scan Lab will target insurance carriers. Insurance carriers use a bid submittal process to set up contracts with the various medical scan service providers. In today’s medical environment these contact are key because 99% of the scans done are billed through insurance. Insurance companies therefore are the gate keepers to this process. Scan Lab recognizes the importance of getting insurance carriers approval and will work hard to get approved by all popular insurance plans.
Once Scan Lab has been approved by an insurance company, it will rely on referrals of physicians to point their patients to Scan Lab. Doctors make referrals based on several factors including geographic location/convenience who they know, accepted forms of insurance, type of scan, etc. It will be important to have a strong marketing and sales campaign that alerts referring doctors to Scan Lab’s services.
Services
Scan Lab offers a wide range of radiology-based medical scanning tests. Scan Lab has the latest equipment and the expert medical training to interpret and provide valuable consultations to the physicians who make the patient referrals to Scan Lab.
Management
Scan Lab will be lead by Dr. Carolyn Jones. Dr. Jones received her medical degree with a specialization in radiology from the University of California San Diego, a nationally recognized medical school for radiology. Dr. Jones performed her residency at John Hopkins, also nationally recognized for their radiology program. Dr. Jones has practiced radiology for 13 years at a large clinic in Boston.
1.1 Mission
It is Scan Lab’s mission to be recognized as the leader in medical scanning technology in New Bedford. This will be achieved by friendly service, flexible acceptance of insurance plans, and accurate analysis.
1.2 Objectives
- To capture 40% of local physicians’ business within two years.
- To reach profitability within two years.
- To double sales by year three.
1.3 Keys to Success
- Only purchase medical equipment that has demand within the community.
- Provide fast, friendly service with accurate readings.
- Employ strict financial controls to help manage the expensive capital costs associated with medical imaging equipment.
Company Summary
Scan Lab has been formed as a Massachusetts corporation. It is solely owned by Carolyn Jones.
2.1 Start-up Summary
Scan Lab will need to purchase the necessary equipment for the clinic.
- Office furniture for four exam rooms. This equipment will be purchased used in good condition. This will be done as a cost saving measure.
- Receptionist office furniture and assorted waiting room furniture (this will also be purchased in good, used condition).
- Three computers, one with QuickBooks Pro, all with Microsoft Office, a central laser printer and broadband Internet connection.
- Medical scanning devices:
- X-ray machine
- Ultra sound unit
- CAT scan imaging machine
- MRI imaging machine

| Start-up | |
| Requirements | |
| Start-up Expenses | |
| Legal | $3,000 |
| Stationery etc. | $300 |
| Brochures | $300 |
| Consultants | $2,000 |
| Insurance | $3,000 |
| Rent | $2,000 |
| Total Start-up Expenses | $10,600 |
| Start-up Assets | |
| Cash Required | $317,900 |
| Other Current Assets | $0 |
| Long-term Assets | $861,500 |
| Total Assets | $1,179,400 |
| Total Requirements | $1,190,000 |
| Start-up Funding | |
| Start-up Expenses to Fund | $10,600 |
| Start-up Assets to Fund | $1,179,400 |
| Total Funding Required | $1,190,000 |
| Assets | |
| Non-cash Assets from Start-up | $861,500 |
| Cash Requirements from Start-up | $317,900 |
| Additional Cash Raised | $0 |
| Cash Balance on Starting Date | $317,900 |
| Total Assets | $1,179,400 |
| Liabilities and Capital | |
| Liabilities | |
| Current Borrowing | $0 |
| Long-term Liabilities | $860,000 |
| Accounts Payable (Outstanding Bills) | $0 |
| Other Current Liabilities (interest-free) | $0 |
| Total Liabilities | $860,000 |
| Capital | |
| Planned Investment | |
| Dr. Jones | $180,000 |
| Investor | $150,000 |
| Additional Investment Requirement | $0 |
| Total Planned Investment | $330,000 |
| Loss at Start-up (Start-up Expenses) | ($10,600) |
| Total Capital | $319,400 |
| Total Capital and Liabilities | $1,179,400 |
| Total Funding | $1,190,000 |
2.2 Company Ownership
Carolyn Jones is the sole stockholder of the Scan Lab corporation.
Services
Scan Lab offers New Bedford physicians a wide range of diagnostic scanning tests. Due to the high cost of scanning equipment for occasional use, most small clinics and practices use an outside service provider for scanning needs. The following scans will be offered:
- X-Ray: An X-ray uses invisible electromagnetic energy beams to produce images of internal tissues, bones, and organs on film. X-rays are used for numerous reasons but work best to find tumors or bone injuries.
- Ultrasound: This technology sends sound waves into the body, recording the reflection. Ultrasound is used for a detailed assessment of blood flow and for views of soft tissue and anatomical body structure.
- CAT Scan: This is a diagnostic technology that uses a combination of x-rays and computer technology to produce cross-sectional images (“slices”) in a horizontal and vertical orientation. A CAT scan can show detailed images of any part of the body including bones, muscles, fat, and organs. CAT scans are more detailed than traditional x-rays and have lower releases of radiation. CAT scans are often used to diagnose tumors, evaluate internal bleeding or investigate internal injuries or damage.
- MRI: This technology harnesses magnetic energy. The patient is placed in a tube or on a bed where magnetic fields are applied to the body. The reaction by the body when the magnetic fields are applied and relaxed are noted by a computer which has been recording data throughout the process. MRIs are the premier scanning device for extremities, especially joints, as well as for imaging the upper spine and lower back.
Diagnostic scanning requires proper analysis by a radiologist to analyze the scans.
Market Analysis Summary
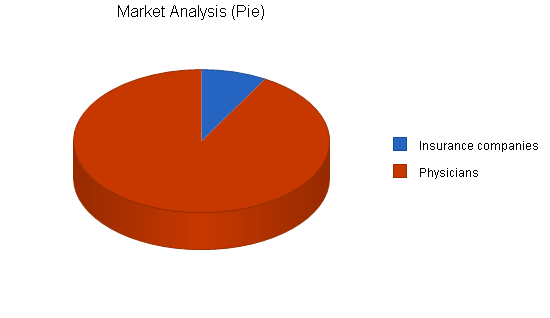
Scan Lab has identified two customer segments that they will target: medical insurance carriers and physicians. For many patients the insurance company mandates who can provide scanning services. Therefore, the driving force to getting customers is attracting the large insurance carriers. Scan Lab has been in negotiations with the three largest carriers in the state and all have informally accepted Scan Lab’s bid proposal.
The second customer group is the physicians. While the insurance company will mandate what labs are acceptable for their insurance plan, it is the doctor’s choice where they recommend their patients goes.
4.1 Market Segmentation
Scan Lab will target the three largest medical insurance carriers: Aetna, Cigna, and Prudential. Smaller ones will also be targeted later.
Scan Lab has been involved in negotiations with these three insurance carriers to develop an arrangement for Scan Lab to be an approved facility. The next step is the submission of a bid, which is primarily based on price. The lab must agree to rates that the insurance companies have set forth. A secondary consideration is the ability of the lab to adhere to specific filing and billing procedures.
The second target market segment is physicians. Physicians make referrals based on numerous factors including:
- Who they know.
- Who the patient’s insurance company is.
- What type of scan the patient is receiving.
- Convenience of location relative to their office or to the patient’s home.
| Market Analysis | |||||||
| Year 1 | Year 2 | Year 3 | Year 4 | Year 5 | |||
| Potential Customers | Growth | CAGR | |||||
| Insurance companies | 1% | 21 | 21 | 21 | 21 | 21 | 0.00% |
| Physicians | 4% | 235 | 244 | 254 | 264 | 275 | 4.01% |
| Total | 3.70% | 256 | 265 | 275 | 285 | 296 | 3.70% |
4.2 Target Market Segment Strategy
The insurance companies decide what scanning facilities are acceptable relative to their insurance plan. Once the facility has been approved, the approval is typically good for one to two years at which point a new bid must be submitted.
Physicians direct the patient to where they must go for a scan. Because Scan Lab is located within a professional building with many doctors, this level of convenience with often prompt the doctor to immediately recommend Scan Lab.

4.3 Service Business Analysis
The medical imaging industry operates under two models: a large clinic or practice that purchases the equipment for the use of their physicians, and outside service providers.
Only large clinics and practices can justify buying their own scanning equipment. For a small clinic or practice, the high equipment cost with low use rate makes cost per use expensive.
Scan Lab’s direct competitors offer their services to all physicians and accept a wide range of insurance plans. These competitors rarely offer services beyond medical imagine test and radiologist analysis. The medical scanning industry can be profitable if there is not over capacity of the scanning machines in the area. A profitable capacity is to have approximately five MRIs for every 100,000 people. Currently, New Bedford, with a population of 300,000 has 12.
4.3.1 Competition and Buying Patterns
There are nine direct competitors in the area. The large ones are detailed below:
- Massachusetts Imaging Center: This company operates three centers of imaging equipment. This company is large, while they offer competent radiologist analysis, the setting is somewhat factory like where patients become numbers who are shuffled through.
- Bedford Scanning: This is a small facility with one part time radiologist on staff. They only have an MRI and CAT scan, they do not offer any other types of imaging services.
- Radiologist Imaging: This facility is similar to Scan Lab but is located on the far side of town, a 25 minute drive away, therefore this facility seems to serve a more regional customer base due to their non-centralized location.
Scan Lab also has indirect competition from clinics and large practices with their own scanning equipment. This group does not serve outside physicians so it is only a threat if they recruit doctors, that use Scan Lab, away from private practice.
Strategy and Implementation Summary
Scan Lab will leverage its competitive edge of having the most advanced equipment with a seasoned, nationally recognized radiologist providing all of the analysis. Scan Lab will employ a marketing strategy that will communicate the message that offers state of the art technology and medical analysis, developing an awareness regarding Scan Lab’s strengths and distinctiveness.
There is not a significant amount of work that needs to occur to market to the insurance companies. This activity is handled by bid submission. Most activities directed at the insurance companies will occur through the sales campaign. Scan Lab will also embark on a sales strategy that has the goal of converting qualified doctors into referring doctors, Scan Lab’s source of patients. The following three sections provides this analysis.
5.1 Competitive Edge
Scan Lab will a nationally recognized expert radiologist in charge of all analysis. Dr. Carolyn Jones has been practicing radiology for 13 years, has published over 14 articles in renowned medical journals and is often asked to be a speaker at national engagements. Recently, she was the keynote speaker for the American Association of Radiologists Annual Conference where she described a new technique of using contrast in medical imaging that yielded a 34% increase in detail. A medical imaging scan is only as good as the analysis of the scan, therefore it is of significant value to offer a service where you have a nationally recognized expert offering the consultation to the referring doctor.
5.2 Marketing Strategy
Scan Lab will use several methods to communicate that it offers the most advanced technology and the best expert radiology analysis. This message will be communicate through various methods:
- Yellow Pages: While the Yellow Pages are not as targeted as other methods of communication, these advertisements will be necessary as many people turn to the pages when they do not have a specific service provider in mind. The ads are proven to be cost effective.
- Circulars: These will be pamphlets that are sent out to local physicians. The pamphlet will serve to introduce Scan Lab and detail the different services that it offers. It will also provide information on Dr. Carolyn Jones and will include background into her professional accomplishments and activities.
- Networking: Dr. Jones recognizes the importance of networking, getting to know the physicians that work in New Bedford. A high percentage of referrals are made based on personal and professional contacts so networking is a very effective method of increasing the number of referrals. Dr. Jones will be active in the numerous organizations and committees that are present within the medical community.
5.3 Sales Strategy
Scan Lab’s sales strategy will be to convert a qualified lead into a referring physician. This will be done through the emphasis of Dr. Jones’ strength and expertise in the field of radiology. The medical scanning laboratories service both patients and doctors.
For patients the scanning must be convenient, pleasant, and accept most insurance plans. For physicians, it must be a high-quality radiologist analysis. The better the analysis, the more accurate information that the radiologists can offer in the consultation to the referring physician.
Scan Lab will be networking with various insurance carriers. The first step is to determine who the key contact at the insurance company is. These contacts will be useful in providing information on what is expected in the submitted bid.
5.3.1 Sales Forecast
The sales forecast adopts a conservative approach to projecting future sales. As a start-up organization, Scan Lab recognizes that sales will be slow initially but by the seventh month sales will be steady and grow as the marketing efforts are developed.
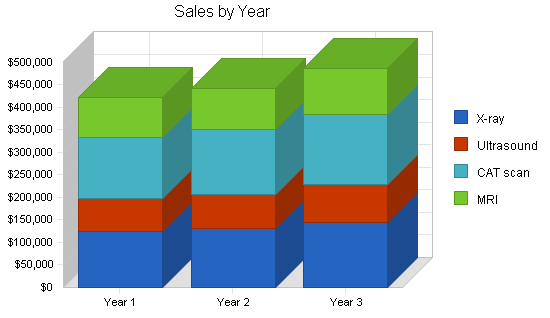
The sales forecast is broken down by the type of service provided and displayed in the following table. The charts give a visual representation of monthly and yearly figures.

| Sales Forecast | |||
| Year 1 | Year 2 | Year 3 | |
| Sales | |||
| X-ray | $124,292 | $130,500 | $143,550 |
| Ultrasound | $73,332 | $77,000 | $84,700 |
| CAT scan | $136,721 | $143,000 | $157,300 |
| MRI | $87,999 | $92,000 | $101,200 |
| Total Sales | $422,344 | $442,500 | $486,750 |
| Direct Cost of Sales | Year 1 | Year 2 | Year 3 |
| X-ray | $28,587 | $30,000 | $30,900 |
| Ultrasound | $16,866 | $18,000 | $18,540 |
| CAT scan | $31,446 | $33,000 | $34,000 |
| MRI | $20,240 | $21,300 | $22,000 |
| Subtotal Direct Cost of Sales | $97,139 | $102,300 | $105,440 |
5.4 Milestones
Scan Lab has chosen several quantifiable milestones that have been developed as goals for the organization to achieve. The following table details the specific milestones, the time frame that has been estimated for completion of the milestone, and the specific employee responsible.

| Milestones | |||||
| Milestone | Start Date | End Date | Budget | Manager | Department |
| Business plan completion | 6/1/2003 | 12/1/2003 | $0 | Carolyn | Business Development |
| Secure lease | 12/1/2003 | 2/28/2004 | $0 | Carolyn | Operations |
| Equipment purchases | 1/1/2004 | 3/1/2004 | $0 | Carolyn | Operations |
| Facility open | 3/1/2004 | 3/30/2004 | $0 | Carolyn | Operations |
| Profitability | 10/30/2004 | 1/31/2005 | $0 | Carolyn | Accounting |
| Totals | $0 | ||||
Web Plan Summary
Scan Lab will have a website which will provide information regarding the services offered and Dr. Jones professional experience.
6.1 Website Marketing Strategy
Scan Lab will use two simple marketing techniques to alert prospective customers to the site. The first is the prominent display of the Web address on all literature that Scan Lab has. The second is submitting Scan Labs website URL to multiple search engines. This will ensure that if a customer types “New Bedford MRI” into a search engine and they would be brought to www.scanlab.com.
6.2 Development Requirements
The website will be designed and built by a local computer science student.
Management Summary
Scan Lab will be lead by Dr. Carolyn Jones. Dr. Jones received her medical degree from The University of California San Diego, world renowned for their radiology. Dr. Jones moved to the Northeast and practiced her residency at John Hopkins, after which she went to work for a large clinic in Boston.
Dr. Jones has published 14 articles and is frequently asked to present her papers at conferences.
7.1 Personnel Plan
Scan Lab will require the following positions/responsibilities:
- Dr. Jones: In addition to being the resident radiologist, she will also be responsible for business development, and some marketing and sales.
- Technicians: Four people will be responsible for the operation of the machines.
- Administration: Two people will be responsible for the clerical duties and bookkeeping.
| Personnel Plan | |||
| Year 1 | Year 2 | Year 3 | |
| Dr. Jones | $60,000 | $61,800 | $63,654 |
| Technicians | $48,000 | $49,440 | $50,923 |
| Other | $19,200 | $19,776 | $20,269 |
| Total People | 5 | 5 | 5 |
| Total Payroll | $127,200 | $131,016 | $134,846 |
Financial Plan
The following sections will outline the financial planning for Scan Lab.
8.1 Important Assumptions
The following table details important Financial Assumptions.
| General Assumptions | |||
| Year 1 | Year 2 | Year 3 | |
| Plan Month | 1 | 2 | 3 |
| Current Interest Rate | 10.00% | 10.00% | 10.00% |
| Long-term Interest Rate | 10.00% | 10.00% | 10.00% |
| Tax Rate | 30.00% | 30.00% | 30.00% |
| Other | 0 | 0 | 0 |
8.2 Break-even Analysis
The Break-even Analysis indicates what is needed in monthly revenue to reach the break-even point.

| Break-even Analysis | |
| Monthly Revenue Break-even | $40,582 |
| Assumptions: | |
| Average Percent Variable Cost | 23% |
| Estimated Monthly Fixed Cost | $31,248 |
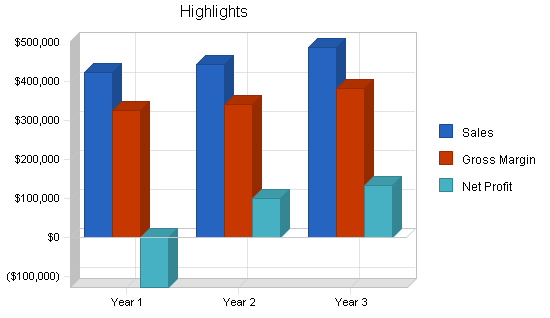
8.3 Projected Profit and Loss
The following table and charts will indicate Projected Profit and Loss.


| Pro Forma Profit and Loss | |||
| Year 1 | Year 2 | Year 3 | |
| Sales | $422,344 | $442,500 | $486,750 |
| Direct Cost of Sales | $97,139 | $102,300 | $105,440 |
| Other Costs of Sales | $0 | $0 | $0 |
| Total Cost of Sales | $97,139 | $102,300 | $105,440 |
| Gross Margin | $325,205 | $340,200 | $381,310 |
| Gross Margin % | 77.00% | 76.88% | 78.34% |
| Expenses | |||
| Payroll | $127,200 | $131,016 | $134,846 |
| Sales and Marketing and Other Expenses | $6,000 | $0 | $0 |
| Depreciation | $172,300 | $0 | $0 |
| Rent | $24,000 | $0 | $0 |
| Utilities | $6,000 | $0 | $0 |
| Insurance | $18,000 | $0 | $0 |
| Payroll Taxes | $19,080 | $0 | $0 |
| Other | $2,400 | $0 | $0 |
| Total Operating Expenses | $374,980 | $131,016 | $134,846 |
| Profit Before Interest and Taxes | ($49,775) | $209,184 | $246,464 |
| EBITDA | $122,525 | $209,184 | $246,464 |
| Interest Expense | $79,500 | $68,000 | $56,000 |
| Taxes Incurred | $0 | $42,355 | $57,139 |
| Net Profit | ($129,275) | $98,829 | $133,325 |
| Net Profit/Sales | -30.61% | 22.33% | 27.39% |
8.4 Projected Cash Flow
The following table and chart will indicate Projected Cash Flow.

| Pro Forma Cash Flow | |||
| Year 1 | Year 2 | Year 3 | |
| Cash Received | |||
| Cash from Operations | |||
| Cash Sales | $105,586 | $110,625 | $121,688 |
| Cash from Receivables | $240,226 | $328,223 | $357,044 |
| Subtotal Cash from Operations | $345,812 | $438,848 | $478,732 |
| Additional Cash Received | |||
| Sales Tax, VAT, HST/GST Received | $0 | $0 | $0 |
| New Current Borrowing | $0 | $0 | $0 |
| New Other Liabilities (interest-free) | $0 | $0 | $0 |
| New Long-term Liabilities | $0 | $0 | $0 |
| Sales of Other Current Assets | $0 | $0 | $0 |
| Sales of Long-term Assets | $0 | $0 | $0 |
| New Investment Received | $0 | $0 | $0 |
| Subtotal Cash Received | $345,812 | $438,848 | $478,732 |
| Expenditures | Year 1 | Year 2 | Year 3 |
| Expenditures from Operations | |||
| Cash Spending | $127,200 | $131,016 | $134,846 |
| Bill Payments | $227,987 | $219,308 | $218,092 |
| Subtotal Spent on Operations | $355,187 | $350,324 | $352,938 |
| Additional Cash Spent | |||
| Sales Tax, VAT, HST/GST Paid Out | $0 | $0 | $0 |
| Principal Repayment of Current Borrowing | $0 | $0 | $0 |
| Other Liabilities Principal Repayment | $0 | $0 | $0 |
| Long-term Liabilities Principal Repayment | $120,000 | $120,000 | $120,000 |
| Purchase Other Current Assets | $0 | $0 | $0 |
| Purchase Long-term Assets | $0 | $0 | $0 |
| Dividends | $0 | $0 | $0 |
| Subtotal Cash Spent | $475,187 | $470,324 | $472,938 |
| Net Cash Flow | ($129,375) | ($31,477) | $5,793 |
| Cash Balance | $188,525 | $157,048 | $162,841 |
8.5 Projected Balance Sheet
The following table will indicate the Projected Balance Sheet.
| Pro Forma Balance Sheet | |||
| Year 1 | Year 2 | Year 3 | |
| Assets | |||
| Current Assets | |||
| Cash | $188,525 | $157,048 | $162,841 |
| Accounts Receivable | $76,532 | $80,184 | $88,203 |
| Other Current Assets | $0 | $0 | $0 |
| Total Current Assets | $265,057 | $237,232 | $251,044 |
| Long-term Assets | |||
| Long-term Assets | $861,500 | $861,500 | $861,500 |
| Accumulated Depreciation | $172,300 | $172,300 | $172,300 |
| Total Long-term Assets | $689,200 | $689,200 | $689,200 |
| Total Assets | $954,257 | $926,433 | $940,244 |
| Liabilities and Capital | Year 1 | Year 2 | Year 3 |
| Current Liabilities | |||
| Accounts Payable | $24,132 | $17,479 | $17,965 |
| Current Borrowing | $0 | $0 | $0 |
| Other Current Liabilities | $0 | $0 | $0 |
| Subtotal Current Liabilities | $24,132 | $17,479 | $17,965 |
| Long-term Liabilities | $740,000 | $620,000 | $500,000 |
| Total Liabilities | $764,132 | $637,479 | $517,965 |
| Paid-in Capital | $330,000 | $330,000 | $330,000 |
| Retained Earnings | ($10,600) | ($139,875) | ($41,046) |
| Earnings | ($129,275) | $98,829 | $133,325 |
| Total Capital | $190,125 | $288,954 | $422,279 |
| Total Liabilities and Capital | $954,257 | $926,433 | $940,244 |
| Net Worth | $190,125 | $288,954 | $422,279 |
8.6 Business Ratios
The following table details Business Ratios as they relate to Scan Lab, as well as the Diagnostic Imaging Center industry, NAICS code 612512, that it participates in.
| Ratio Analysis | ||||
| Year 1 | Year 2 | Year 3 | Industry Profile | |
| Sales Growth | 0.00% | 4.77% | 10.00% | 8.83% |
| Percent of Total Assets | ||||
| Accounts Receivable | 8.02% | 8.66% | 9.38% | 29.41% |
| Other Current Assets | 0.00% | 0.00% | 0.00% | 48.00% |
| Total Current Assets | 27.78% | 25.61% | 26.70% | 80.30% |
| Long-term Assets | 72.22% | 74.39% | 73.30% | 19.70% |
| Total Assets | 100.00% | 100.00% | 100.00% | 100.00% |
| Current Liabilities | 2.53% | 1.89% | 1.91% | 30.82% |
| Long-term Liabilities | 77.55% | 66.92% | 53.18% | 21.77% |
| Total Liabilities | 80.08% | 68.81% | 55.09% | 52.59% |
| Net Worth | 19.92% | 31.19% | 44.91% | 47.41% |
| Percent of Sales | ||||
| Sales | 100.00% | 100.00% | 100.00% | 100.00% |
| Gross Margin | 77.00% | 76.88% | 78.34% | 100.00% |
| Selling, General & Administrative Expenses | 102.84% | 0.00% | 0.00% | 66.55% |
| Advertising Expenses | 0.00% | 0.00% | 0.00% | 0.85% |
| Profit Before Interest and Taxes | -11.79% | 47.27% | 50.63% | 5.72% |
| Main Ratios | ||||
| Current | 10.98 | 13.57 | 13.97 | 1.77 |
| Quick | 10.98 | 13.57 | 13.97 | 1.49 |
| Total Debt to Total Assets | 80.08% | 68.81% | 55.09% | 54.16% |
| Pre-tax Return on Net Worth | -67.99% | 48.86% | 45.10% | 6.71% |
| Pre-tax Return on Assets | -13.55% | 15.24% | 20.26% | 14.64% |
| Additional Ratios | Year 1 | Year 2 | Year 3 | |
| Net Profit Margin | -30.61% | 22.33% | 27.39% | n.a |
| Return on Equity | -67.99% | 34.20% | 31.57% | n.a |
| Activity Ratios | ||||
| Accounts Receivable Turnover | 4.14 | 4.14 | 4.14 | n.a |
| Collection Days | 56 | 86 | 84 | n.a |
| Accounts Payable Turnover | 10.45 | 12.17 | 12.17 | n.a |
| Payment Days | 27 | 36 | 30 | n.a |
| Total Asset Turnover | 0.44 | 0.48 | 0.52 | n.a |
| Debt Ratios | ||||
| Debt to Net Worth | 4.02 | 2.21 | 1.23 | n.a |
| Current Liab. to Liab. | 0.03 | 0.03 | 0.03 | n.a |
| Liquidity Ratios | ||||
| Net Working Capital | $240,925 | $219,754 | $233,079 | n.a |
| Interest Coverage | -0.63 | 3.08 | 4.40 | n.a |
| Additional Ratios | ||||
| Assets to Sales | 2.26 | 2.09 | 1.93 | n.a |
| Current Debt/Total Assets | 3% | 2% | 2% | n.a |
| Acid Test | 7.81 | 8.99 | 9.06 | n.a |
| Sales/Net Worth | 2.22 | 1.53 | 1.15 | n.a |
| Dividend Payout | 0.00 | 0.00 | 0.00 | n.a |
Appendix
| Sales Forecast | |||||||||||||
| Month 1 | Month 2 | Month 3 | Month 4 | Month 5 | Month 6 | Month 7 | Month 8 | Month 9 | Month 10 | Month 11 | Month 12 | ||
| Sales | |||||||||||||
| X-ray | 0% | $0 | $0 | $5,500 | $8,565 | $10,005 | $12,454 | $13,121 | $14,005 | $14,989 | $15,114 | $15,265 | $15,274 |
| Ultrasound | 0% | $0 | $0 | $3,245 | $5,053 | $5,903 | $7,348 | $7,741 | $8,263 | $8,844 | $8,917 | $9,006 | $9,012 |
| CAT scan | 0% | $0 | $0 | $6,050 | $9,422 | $11,006 | $13,699 | $14,433 | $15,406 | $16,488 | $16,625 | $16,792 | $16,801 |
| MRI | 0% | $0 | $0 | $3,894 | $6,064 | $7,084 | $8,817 | $9,290 | $9,916 | $10,612 | $10,701 | $10,808 | $10,814 |
| Total Sales | $0 | $0 | $18,689 | $29,104 | $33,997 | $42,319 | $44,585 | $47,589 | $50,933 | $51,357 | $51,870 | $51,901 | |
| Direct Cost of Sales | Month 1 | Month 2 | Month 3 | Month 4 | Month 5 | Month 6 | Month 7 | Month 8 | Month 9 | Month 10 | Month 11 | Month 12 | |
| X-ray | $0 | $0 | $1,265 | $1,970 | $2,301 | $2,864 | $3,018 | $3,221 | $3,447 | $3,476 | $3,511 | $3,513 | |
| Ultrasound | $0 | $0 | $746 | $1,162 | $1,358 | $1,690 | $1,781 | $1,900 | $2,034 | $2,051 | $2,071 | $2,073 | |
| CAT scan | $0 | $0 | $1,392 | $2,167 | $2,531 | $3,151 | $3,320 | $3,543 | $3,792 | $3,824 | $3,862 | $3,864 | |
| MRI | $0 | $0 | $896 | $1,395 | $1,629 | $2,028 | $2,137 | $2,281 | $2,441 | $2,461 | $2,486 | $2,487 | |
| Subtotal Direct Cost of Sales | $0 | $0 | $4,298 | $6,694 | $7,819 | $9,733 | $10,255 | $10,945 | $11,715 | $11,812 | $11,930 | $11,937 | |
| Personnel Plan | |||||||||||||
| Month 1 | Month 2 | Month 3 | Month 4 | Month 5 | Month 6 | Month 7 | Month 8 | Month 9 | Month 10 | Month 11 | Month 12 | ||
| Dr. Jones | 0% | $0 | $0 | $6,000 | $6,000 | $6,000 | $6,000 | $6,000 | $6,000 | $6,000 | $6,000 | $6,000 | $6,000 |
| Technicians | 0% | $0 | $0 | $0 | $3,000 | $3,000 | $6,000 | $6,000 | $6,000 | $6,000 | $6,000 | $6,000 | $6,000 |
| Other | 0% | $0 | $0 | $0 | $1,200 | $1,200 | $2,400 | $2,400 | $2,400 | $2,400 | $2,400 | $2,400 | $2,400 |
| Total People | 0 | 0 | 0 | 3 | 3 | 5 | 5 | 5 | 5 | 5 | 5 | 5 | |
| Total Payroll | $0 | $0 | $6,000 | $10,200 | $10,200 | $14,400 | $14,400 | $14,400 | $14,400 | $14,400 | $14,400 | $14,400 | |
| General Assumptions | |||||||||||||
| Month 1 | Month 2 | Month 3 | Month 4 | Month 5 | Month 6 | Month 7 | Month 8 | Month 9 | Month 10 | Month 11 | Month 12 | ||
| Plan Month | 1 | 2 | 3 | 4 | 5 | 6 | 7 | 8 | 9 | 10 | 11 | 12 | |
| Current Interest Rate | 10.00% | 10.00% | 10.00% | 10.00% | 10.00% | 10.00% | 10.00% | 10.00% | 10.00% | 10.00% | 10.00% | 10.00% | |
| Long-term Interest Rate | 10.00% | 10.00% | 10.00% | 10.00% | 10.00% | 10.00% | 10.00% | 10.00% | 10.00% | 10.00% | 10.00% | 10.00% | |
| Tax Rate | 30.00% | 30.00% | 30.00% | 30.00% | 30.00% | 30.00% | 30.00% | 30.00% | 30.00% | 30.00% | 30.00% | 30.00% | |
| Other | 0 | 0 | 0 | 0 | 0 | 0 | 0 | 0 | 0 | 0 | 0 | 0 | |
| Pro Forma Profit and Loss | |||||||||||||
| Month 1 | Month 2 | Month 3 | Month 4 | Month 5 | Month 6 | Month 7 | Month 8 | Month 9 | Month 10 | Month 11 | Month 12 | ||
| Sales | $0 | $0 | $18,689 | $29,104 | $33,997 | $42,319 | $44,585 | $47,589 | $50,933 | $51,357 | $51,870 | $51,901 | |
| Direct Cost of Sales | $0 | $0 | $4,298 | $6,694 | $7,819 | $9,733 | $10,255 | $10,945 | $11,715 | $11,812 | $11,930 | $11,937 | |
| Other Costs of Sales | $0 | $0 | $0 | $0 | $0 | $0 | $0 | $0 | $0 | $0 | $0 | $0 | |
| Total Cost of Sales | $0 | $0 | $4,298 | $6,694 | $7,819 | $9,733 | $10,255 | $10,945 | $11,715 | $11,812 | $11,930 | $11,937 | |
| Gross Margin | $0 | $0 | $14,391 | $22,410 | $26,178 | $32,585 | $34,331 | $36,644 | $39,218 | $39,545 | $39,940 | $39,964 | |
| Gross Margin % | 0.00% | 0.00% | 77.00% | 77.00% | 77.00% | 77.00% | 77.00% | 77.00% | 77.00% | 77.00% | 77.00% | 77.00% | |
| Expenses | |||||||||||||
| Payroll | $0 | $0 | $6,000 | $10,200 | $10,200 | $14,400 | $14,400 | $14,400 | $14,400 | $14,400 | $14,400 | $14,400 | |
| Sales and Marketing and Other Expenses | $500 | $500 | $500 | $500 | $500 | $500 | $500 | $500 | $500 | $500 | $500 | $500 | |
| Depreciation | $14,358 | $14,358 | $14,358 | $14,358 | $14,358 | $14,358 | $14,358 | $14,358 | $14,358 | $14,358 | $14,358 | $14,358 | |
| Rent | $2,000 | $2,000 | $2,000 | $2,000 | $2,000 | $2,000 | $2,000 | $2,000 | $2,000 | $2,000 | $2,000 | $2,000 | |
| Utilities | $500 | $500 | $500 | $500 | $500 | $500 | $500 | $500 | $500 | $500 | $500 | $500 | |
| Insurance | $1,500 | $1,500 | $1,500 | $1,500 | $1,500 | $1,500 | $1,500 | $1,500 | $1,500 | $1,500 | $1,500 | $1,500 | |
| Payroll Taxes | 15% | $0 | $0 | $900 | $1,530 | $1,530 | $2,160 | $2,160 | $2,160 | $2,160 | $2,160 | $2,160 | $2,160 |
| Other | $200 | $200 | $200 | $200 | $200 | $200 | $200 | $200 | $200 | $200 | $200 | $200 | |
| Total Operating Expenses | $19,058 | $19,058 | $25,958 | $30,788 | $30,788 | $35,618 | $35,618 | $35,618 | $35,618 | $35,618 | $35,618 | $35,618 | |
| Profit Before Interest and Taxes | ($19,058) | ($19,058) | ($11,568) | ($8,378) | ($4,611) | ($3,033) | ($1,288) | $1,025 | $3,600 | $3,927 | $4,322 | $4,346 | |
| EBITDA | ($4,700) | ($4,700) | $2,791 | $5,980 | $9,748 | $11,325 | $13,071 | $15,384 | $17,958 | $18,285 | $18,680 | $18,704 | |
| Interest Expense | $7,083 | $7,000 | $6,917 | $6,833 | $6,750 | $6,667 | $6,583 | $6,500 | $6,417 | $6,333 | $6,250 | $6,167 | |
| Taxes Incurred | $0 | $0 | $0 | $0 | $0 | $0 | $0 | $0 | $0 | $0 | $0 | $0 | |
| Net Profit | ($26,142) | ($26,058) | ($18,484) | ($15,212) | ($11,361) | ($9,700) | ($7,871) | ($5,475) | ($2,817) | ($2,406) | ($1,928) | ($1,821) | |
| Net Profit/Sales | 0.00% | 0.00% | -98.91% | -52.27% | -33.42% | -22.92% | -17.65% | -11.50% | -5.53% | -4.69% | -3.72% | -3.51% | |
| Pro Forma Cash Flow | |||||||||||||
| Month 1 | Month 2 | Month 3 | Month 4 | Month 5 | Month 6 | Month 7 | Month 8 | Month 9 | Month 10 | Month 11 | Month 12 | ||
| Cash Received | |||||||||||||
| Cash from Operations | |||||||||||||
| Cash Sales | $0 | $0 | $4,672 | $7,276 | $8,499 | $10,580 | $11,146 | $11,897 | $12,733 | $12,839 | $12,968 | $12,975 | |
| Cash from Receivables | $0 | $0 | $0 | $467 | $14,277 | $21,950 | $25,706 | $31,796 | $33,514 | $35,775 | $38,210 | $38,531 | |
| Subtotal Cash from Operations | $0 | $0 | $4,672 | $7,743 | $22,776 | $32,530 | $36,852 | $43,693 | $46,247 | $48,615 | $51,178 | $51,506 | |
| Additional Cash Received | |||||||||||||
| Sales Tax, VAT, HST/GST Received | 0.00% | $0 | $0 | $0 | $0 | $0 | $0 | $0 | $0 | $0 | $0 | $0 | $0 |
| New Current Borrowing | $0 | $0 | $0 | $0 | $0 | $0 | $0 | $0 | $0 | $0 | $0 | $0 | |
| New Other Liabilities (interest-free) | $0 | $0 | $0 | $0 | $0 | $0 | $0 | $0 | $0 | $0 | $0 | $0 | |
| New Long-term Liabilities | $0 | $0 | $0 | $0 | $0 | $0 | $0 | $0 | $0 | $0 | $0 | $0 | |
| Sales of Other Current Assets | $0 | $0 | $0 | $0 | $0 | $0 | $0 | $0 | $0 | $0 | $0 | $0 | |
| Sales of Long-term Assets | $0 | $0 | $0 | $0 | $0 | $0 | $0 | $0 | $0 | $0 | $0 | $0 | |
| New Investment Received | $0 | $0 | $0 | $0 | $0 | $0 | $0 | $0 | $0 | $0 | $0 | $0 | |
| Subtotal Cash Received | $0 | $0 | $4,672 | $7,743 | $22,776 | $32,530 | $36,852 | $43,693 | $46,247 | $48,615 | $51,178 | $51,506 | |
| Expenditures | Month 1 | Month 2 | Month 3 | Month 4 | Month 5 | Month 6 | Month 7 | Month 8 | Month 9 | Month 10 | Month 11 | Month 12 | |
| Expenditures from Operations | |||||||||||||
| Cash Spending | $0 | $0 | $6,000 | $10,200 | $10,200 | $14,400 | $14,400 | $14,400 | $14,400 | $14,400 | $14,400 | $14,400 | |
| Bill Payments | $393 | $11,781 | $11,871 | $16,913 | $19,792 | $20,881 | $23,275 | $23,718 | $24,328 | $24,992 | $25,007 | $25,038 | |
| Subtotal Spent on Operations | $393 | $11,781 | $17,871 | $27,113 | $29,992 | $35,281 | $37,675 | $38,118 | $38,728 | $39,392 | $39,407 | $39,438 | |
| Additional Cash Spent | |||||||||||||
| Sales Tax, VAT, HST/GST Paid Out | $0 | $0 | $0 | $0 | $0 | $0 | $0 | $0 | $0 | $0 | $0 | $0 | |
| Principal Repayment of Current Borrowing | $0 | $0 | $0 | $0 | $0 | $0 | $0 | $0 | $0 | $0 | $0 | $0 | |
| Other Liabilities Principal Repayment | $0 | $0 | $0 | $0 | $0 | $0 | $0 | $0 | $0 | $0 | $0 | $0 | |
| Long-term Liabilities Principal Repayment | $10,000 | $10,000 | $10,000 | $10,000 | $10,000 | $10,000 | $10,000 | $10,000 | $10,000 | $10,000 | $10,000 | $10,000 | |
| Purchase Other Current Assets | $0 | $0 | $0 | $0 | $0 | $0 | $0 | $0 | $0 | $0 | $0 | $0 | |
| Purchase Long-term Assets | $0 | $0 | $0 | $0 | $0 | $0 | $0 | $0 | $0 | $0 | $0 | $0 | |
| Dividends | $0 | $0 | $0 | $0 | $0 | $0 | $0 | $0 | $0 | $0 | $0 | $0 | |
| Subtotal Cash Spent | $10,393 | $21,781 | $27,871 | $37,113 | $39,992 | $45,281 | $47,675 | $48,118 | $48,728 | $49,392 | $49,407 | $49,438 | |
| Net Cash Flow | ($10,393) | ($21,781) | ($23,198) | ($29,370) | ($17,216) | ($12,751) | ($10,822) | ($4,425) | ($2,481) | ($777) | $1,771 | $2,068 | |
| Cash Balance | $307,507 | $285,727 | $262,528 | $233,158 | $215,943 | $203,191 | $192,369 | $187,944 | $185,462 | $184,685 | $186,456 | $188,525 | |
| Pro Forma Balance Sheet | |||||||||||||
| Month 1 | Month 2 | Month 3 | Month 4 | Month 5 | Month 6 | Month 7 | Month 8 | Month 9 | Month 10 | Month 11 | Month 12 | ||
| Assets | Starting Balances | ||||||||||||
| Current Assets | |||||||||||||
| Cash | $317,900 | $307,507 | $285,727 | $262,528 | $233,158 | $215,943 | $203,191 | $192,369 | $187,944 | $185,462 | $184,685 | $186,456 | $188,525 |
| Accounts Receivable | $0 | $0 | $0 | $14,017 | $35,377 | $46,598 | $56,387 | $64,120 | $68,016 | $72,701 | $75,444 | $76,137 | $76,532 |
| Other Current Assets | $0 | $0 | $0 | $0 | $0 | $0 | $0 | $0 | $0 | $0 | $0 | $0 | $0 |
| Total Current Assets | $317,900 | $307,507 | $285,727 | $276,545 | $268,536 | $262,541 | $259,578 | $256,489 | $255,960 | $258,164 | $260,130 | $262,593 | $265,057 |
| Long-term Assets | |||||||||||||
| Long-term Assets | $861,500 | $861,500 | $861,500 | $861,500 | $861,500 | $861,500 | $861,500 | $861,500 | $861,500 | $861,500 | $861,500 | $861,500 | $861,500 |
| Accumulated Depreciation | $0 | $14,358 | $28,717 | $43,075 | $57,433 | $71,792 | $86,150 | $100,508 | $114,866 | $129,225 | $143,583 | $157,941 | $172,300 |
| Total Long-term Assets | $861,500 | $847,142 | $832,783 | $818,425 | $804,067 | $789,709 | $775,350 | $760,992 | $746,634 | $732,275 | $717,917 | $703,559 | $689,200 |
| Total Assets | $1,179,400 | $1,154,649 | $1,118,510 | $1,094,970 | $1,072,603 | $1,052,249 | $1,034,928 | $1,017,481 | $1,002,593 | $990,439 | $978,047 | $966,152 | $954,257 |
| Liabilities and Capital | Month 1 | Month 2 | Month 3 | Month 4 | Month 5 | Month 6 | Month 7 | Month 8 | Month 9 | Month 10 | Month 11 | Month 12 | |
| Current Liabilities | |||||||||||||
| Accounts Payable | $0 | $11,391 | $11,310 | $16,255 | $19,099 | $20,106 | $22,485 | $22,908 | $23,495 | $24,158 | $24,172 | $24,206 | $24,132 |
| Current Borrowing | $0 | $0 | $0 | $0 | $0 | $0 | $0 | $0 | $0 | $0 | $0 | $0 | $0 |
| Other Current Liabilities | $0 | $0 | $0 | $0 | $0 | $0 | $0 | $0 | $0 | $0 | $0 | $0 | $0 |
| Subtotal Current Liabilities | $0 | $11,391 | $11,310 | $16,255 | $19,099 | $20,106 | $22,485 | $22,908 | $23,495 | $24,158 | $24,172 | $24,206 | $24,132 |
| Long-term Liabilities | $860,000 | $850,000 | $840,000 | $830,000 | $820,000 | $810,000 | $800,000 | $790,000 | $780,000 | $770,000 | $760,000 | $750,000 | $740,000 |
| Total Liabilities | $860,000 | $861,391 | $851,310 | $846,255 | $839,099 | $830,106 | $822,485 | $812,908 | $803,495 | $794,158 | $784,172 | $774,206 | $764,132 |
| Paid-in Capital | $330,000 | $330,000 | $330,000 | $330,000 | $330,000 | $330,000 | $330,000 | $330,000 | $330,000 | $330,000 | $330,000 | $330,000 | $330,000 |
| Retained Earnings | ($10,600) | ($10,600) | ($10,600) | ($10,600) | ($10,600) | ($10,600) | ($10,600) | ($10,600) | ($10,600) | ($10,600) | ($10,600) | ($10,600) | ($10,600) |
| Earnings | $0 | ($26,142) | ($52,200) | ($70,684) | ($85,896) | ($97,257) | ($106,956) | ($114,827) | ($120,302) | ($123,119) | ($125,525) | ($127,453) | ($129,275) |
| Total Capital | $319,400 | $293,258 | $267,200 | $248,716 | $233,504 | $222,143 | $212,444 | $204,573 | $199,098 | $196,281 | $193,875 | $191,947 | $190,125 |
| Total Liabilities and Capital | $1,179,400 | $1,154,649 | $1,118,510 | $1,094,970 | $1,072,603 | $1,052,249 | $1,034,928 | $1,017,481 | $1,002,593 | $990,439 | $978,047 | $966,152 | $954,257 |
| Net Worth | $319,400 | $293,258 | $267,200 | $248,716 | $233,504 | $222,143 | $212,444 | $204,573 | $199,098 | $196,281 | $193,875 | $191,947 | $190,125 |


