
Global Health Translations
Executive Summary
Biomedical innovations have a world-wide audience. Each new innovation, each new medical/pharmaceutical product, has a world-wide market. This presents a unique challenge to a company to develop translations in the following areas:
- Instructions for use.
- User’s manuals.
- Service manuals.
- Packaging/labels.
- Clinical trials.
- Regulatory documents.
- Marketing materials.
There is need for a translation service that is expert with the technical information as well as the languages where the product will be sold. Global Health Translations is an invaluable resource in preparing a product for the world marketplace. We will offer medical translation in the following areas:
- Medical devices.
- Pharmaceuticals.
- Biotechnology.
1.1 Mission
The mission of Global Health Translations is to provide our clients translators that can master the medical concepts in the material as well as the demands of the language translation.
1.2 Keys to Success
- All translations will be reviewed by medical professionals with experience in the industry.
- Selection of accredited translators with a university degree from their native country.
- Fast, efficient and professional management of each project.
1.3 Objectives
The objectives of Global Health Translations are:
- Creating translations of exceptional quality.
- Assuring fast turnaround on every project.
- Maintaining competitive prices.
Company Summary
Global Health Translations is a service focused on the translation needs of the health care industry. We have gathered a large pool of translators and editors in more than 30 languages. All translators and editors are native speakers. The translators are accredited by the American Translator Association or other similar organizations. Our editors are required to have a medical education and practice in the medical field.
2.1 Company Ownership
Global Health Translations is owned by Linda and Steven Johnson.
2.2 Start-up Summary
Linda and Steven Johnson will invest in the company as well as securing an SBA business loan.

| Start-up | |
| Requirements | |
| Start-up Expenses | |
| Legal | $2,000 |
| Stationery etc. | $2,000 |
| Brochures | $3,000 |
| Consultants | $0 |
| Insurance | $0 |
| Rent | $1,000 |
| Translators/Editors Pool Development | $40,000 |
| Computer Equipment/Software | $6,000 |
| Other | $0 |
| Total Start-up Expenses | $54,000 |
| Start-up Assets | |
| Cash Required | $26,000 |
| Other Current Assets | $0 |
| Long-term Assets | $20,000 |
| Total Assets | $46,000 |
| Total Requirements | $100,000 |
| Start-up Funding | |
| Start-up Expenses to Fund | $54,000 |
| Start-up Assets to Fund | $46,000 |
| Total Funding Required | $100,000 |
| Assets | |
| Non-cash Assets from Start-up | $20,000 |
| Cash Requirements from Start-up | $26,000 |
| Additional Cash Raised | $0 |
| Cash Balance on Starting Date | $26,000 |
| Total Assets | $46,000 |
| Liabilities and Capital | |
| Liabilities | |
| Current Borrowing | $0 |
| Long-term Liabilities | $50,000 |
| Accounts Payable (Outstanding Bills) | $0 |
| Other Current Liabilities (interest-free) | $0 |
| Total Liabilities | $50,000 |
| Capital | |
| Planned Investment | |
| Linda and Steven Johnson | $50,000 |
| Other | $0 |
| Additional Investment Requirement | $0 |
| Total Planned Investment | $50,000 |
| Loss at Start-up (Start-up Expenses) | ($54,000) |
| Total Capital | ($4,000) |
| Total Capital and Liabilities | $46,000 |
| Total Funding | $100,000 |
Services
Global Health Translation offers the following services:
Languages:
- English
- Portuguese
- Turkish
- Italian
- French
- Spanish
- German
- Mandarin
- Japanese
- Czech
- Finnish
- Swedish
- Korean
- Dutch
Need Assessment & Project Management
A project coordinator is assigned to each client to monitor the quality of services throughout the translation process and ensure consistency in project management.
Glossary Compilation
The glossary of terms are specific to the client’s company and industry and is used to ensure that the terminology is consistent with the terms already utilized by the client’s foreign subsidiaries.
Translation, Editing & Proofreading
All of our linguists are native speakers of the language into which they translate. A professional translator performs the initial conversion of the text into the target language. The technical aspects are then reviewed by a medical editor (a M.D., Ph.D. doing lab research, or medical industry professional) who is currently working in the field.
Formatting & Galley Review
Once the text is finalized, our formatter uses the formatted English files to flow in the foreign language text. The formatted document is then galley reviewed by the project’s proofreader. We also provide:
- DTP formatting of the foreign language versions (PageMaker, QuarkXPress, etc.).
- Import of graphic files.
- Electronic files (PDF, EPS or TIF) or linotronic output for non-roman character languages: Russian, Japanese, Chinese, etc.
Client Galley Review
Laser proofs of the formatted versions are submitted to the client for approval. The in-house graphics staff will have the opportunity to review the proofs and suggest changes.
Final Documents
If the client’s printer cannot use a PDF or TIF file, we deliver a lino output or camera-ready copy.
Market Analysis Summary
In the biomedical industry, each new product, instantly, has an international market. The problem for most companies is finding translators that understand the medical concepts in their materials. This is a critical first step is assuring that foreign subsidiaries can use the material. It is an essential component of releasing the product to market during its optimum window of opportunity. Poor translations can create delays that will push back release dates. This ultimately will impact the company’s sales.
4.1 Market Segmentation
Global Health Translations will focus on three significant client groups:
- Medical device companies
- Pharmaceutical companies
- Biotechnology companies

| Market Analysis | |||||||
| Year 1 | Year 2 | Year 3 | Year 4 | Year 5 | |||
| Potential Customers | Growth | CAGR | |||||
| Medical Device Companies | 10% | 3,240 | 3,564 | 3,920 | 4,312 | 4,743 | 10.00% |
| Biotechnology Companies | 10% | 3,300 | 3,630 | 3,993 | 4,392 | 4,831 | 10.00% |
| Pharmaceutical Companies | 10% | 1,020 | 1,122 | 1,234 | 1,357 | 1,493 | 9.99% |
| Total | 10.00% | 7,560 | 8,316 | 9,147 | 10,061 | 11,067 | 10.00% |
Strategy and Implementation Summary
Global Health Translations faces a tremendous amount of competition for its targeted client group but few translation services have as strong a network of medical editors and translators. Global Health Translations will aggressively market this network with our target clients.
5.1 Competitive Edge
Global Health Translations’ competitive advantage is the experience of its project managers and the network of editors and translators that have been assembled for each project.
Global Health Translations has gathered translators and editors in more than 14 languages. All translators and editors are native speakers. Our translators are accredited by the American Translator Association or other similar organizations. Our editors are required to have a medical education and practice in the medical field. In all cases, translators and editors are selected so that their specialization matches the company’s industry.
The following are examples of our professional translators and editors.
Translators
Spanish: a third-year medical student in pharmacology who is highly involved in research and development projects.
French: a medical researcher with a M.S. in molecular biology. She has over six years experience as translator both in Europe and the United States.
Editors
Japanese: a medical student at Osaka University, specializing in toxicology.
German: recently completed Ph.D. in pharmaceutical biology from the University of Freiburg, Germany.
5.2 Sales Strategy
The heart of Global Health Translations is the network of medical editors and translators we have assembled. This resource is invaluable to companies bringing a product to the international market. Our marketing strategy is to sell this advantage to our target clients.
5.2.1 Sales Forecast
The following is Global Health Translations’ sales forecast for three years.

| Sales Forecast | |||
| Year 1 | Year 2 | Year 3 | |
| Sales | |||
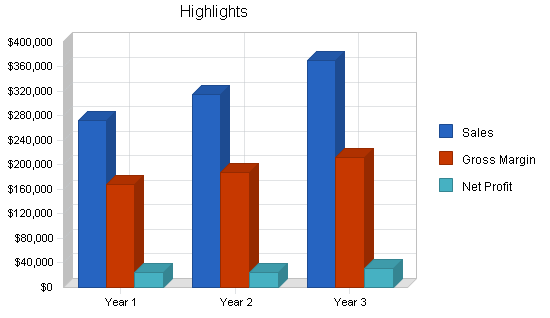
| Translation Projects | $273,000 | $315,000 | $370,000 |
| Other | $0 | $0 | $0 |
| Total Sales | $273,000 | $315,000 | $370,000 |
| Direct Cost of Sales | Year 1 | Year 2 | Year 3 |
| Translation Projects | $105,000 | $128,000 | $158,000 |
| Other | $0 | $0 | $0 |
| Subtotal Direct Cost of Sales | $105,000 | $128,000 | $158,000 |
Management Summary
Linda and Steven Johnson, owners of Global Health Translations, will share responsibility in managing the business.
Linda was born in Mexico City, Mexico and obtained high school diplomas in both the English and Spanish-language school systems. She graduated from the Stanford University with a BS in Biology. Linda has worked as a freelance translator for five years. Linda is fluent in Spanish, German, French, Portuguese and Italian.

Steven was born in Baltimore, Maryland. He is a graduate of the University of Washington in linguistics and holds an M.A. from Oxford University in Russian Language and Literature. While at Oxford University, Steven supplemented his Rhodes Scholarship funds by doing Russian and Polish translations for clients in the U.K. Steven also reads Spanish, French, Italian, German, and Portuguese.
6.1 Organizational Structure
Global Health Translations will assign a project coordinator to each project who will work in close association with the client on each of his/her translation projects, in order to maintain consistency and quality of services. The positions of editor and translator will be contracted out. The project coordinator will manage the project’s translator and editor.
6.2 Personnel Plan
Global Health Translations will have the following positions:
- Project managers (2).
- Marketing person.
| Personnel Plan | |||
| Year 1 | Year 2 | Year 3 | |
| Project Managers (2) | $60,000 | $70,000 | $80,000 |
| Marketing Person | $36,000 | $40,000 | $44,000 |
| Other | $0 | $0 | $0 |
| Total People | 3 | 3 | 3 |
| Total Payroll | $96,000 | $110,000 | $124,000 |
Financial Plan
The following sections outline the Financial Plan for Global Health Translations.
7.1 Projected Cash Flow
The following is the projected cash flow for three years.

| Pro Forma Cash Flow | |||
| Year 1 | Year 2 | Year 3 | |
| Cash Received | |||
| Cash from Operations | |||
| Cash Sales | $68,250 | $78,750 | $92,500 |
| Cash from Receivables | $164,950 | $230,127 | $269,482 |
| Subtotal Cash from Operations | $233,200 | $308,877 | $361,982 |
| Additional Cash Received | |||
| Sales Tax, VAT, HST/GST Received | $0 | $0 | $0 |
| New Current Borrowing | $0 | $0 | $0 |
| New Other Liabilities (interest-free) | $0 | $0 | $0 |
| New Long-term Liabilities | $0 | $0 | $0 |
| Sales of Other Current Assets | $0 | $0 | $0 |
| Sales of Long-term Assets | $0 | $0 | $0 |
| New Investment Received | $0 | $0 | $0 |
| Subtotal Cash Received | $233,200 | $308,877 | $361,982 |
| Expenditures | Year 1 | Year 2 | Year 3 |
| Expenditures from Operations | |||
| Cash Spending | $96,000 | $110,000 | $124,000 |
| Bill Payments | $135,937 | $176,615 | $209,462 |
| Subtotal Spent on Operations | $231,937 | $286,615 | $333,462 |
| Additional Cash Spent | |||
| Sales Tax, VAT, HST/GST Paid Out | $0 | $0 | $0 |
| Principal Repayment of Current Borrowing | $0 | $0 | $0 |
| Other Liabilities Principal Repayment | $0 | $0 | $0 |
| Long-term Liabilities Principal Repayment | $0 | $0 | $0 |
| Purchase Other Current Assets | $0 | $0 | $0 |
| Purchase Long-term Assets | $0 | $0 | $0 |
| Dividends | $0 | $0 | $0 |
| Subtotal Cash Spent | $231,937 | $286,615 | $333,462 |
| Net Cash Flow | $1,263 | $22,262 | $28,520 |
| Cash Balance | $27,263 | $49,526 | $78,045 |
7.2 Break-even Analysis
The monthly break-even point is shown in the following table and chart.

| Break-even Analysis | |
| Monthly Revenue Break-even | $17,449 |
| Assumptions: | |
| Average Percent Variable Cost | 38% |
| Estimated Monthly Fixed Cost | $10,738 |
7.3 Projected Profit and Loss
Global Health Translations will not see a profit until its second year of operation. We estimate that sales will grow by a modest percentage the second and third year. The following is the projected profit and loss for three years.


| Pro Forma Profit and Loss | |||
| Year 1 | Year 2 | Year 3 | |
| Sales | $273,000 | $315,000 | $370,000 |
| Direct Cost of Sales | $105,000 | $128,000 | $158,000 |
| Other Production Expenses | $0 | $0 | $0 |
| Total Cost of Sales | $105,000 | $128,000 | $158,000 |
| Gross Margin | $168,000 | $187,000 | $212,000 |
| Gross Margin % | 61.54% | 59.37% | 57.30% |
| Expenses | |||
| Payroll | $96,000 | $110,000 | $124,000 |
| Sales and Marketing and Other Expenses | $1,800 | $2,700 | $3,800 |
| Depreciation | $2,856 | $2,856 | $2,856 |
| Leased Equipment | $0 | $0 | $0 |
| Utilities | $1,800 | $1,800 | $1,800 |
| Insurance | $0 | $0 | $0 |
| Rent | $12,000 | $12,000 | $12,000 |
| Payroll Taxes | $14,400 | $16,500 | $18,600 |
| Other | $0 | $0 | $0 |
| Total Operating Expenses | $128,856 | $145,856 | $163,056 |
| Profit Before Interest and Taxes | $39,144 | $41,144 | $48,944 |
| EBITDA | $42,000 | $44,000 | $51,800 |
| Interest Expense | $5,000 | $5,000 | $5,000 |
| Taxes Incurred | $10,243 | $10,843 | $13,183 |
| Net Profit | $23,901 | $25,301 | $30,761 |
| Net Profit/Sales | 8.75% | 8.03% | 8.31% |
7.4 Projected Balance Sheet
The following is the projected balance sheet for three years.
| Pro Forma Balance Sheet | |||
| Year 1 | Year 2 | Year 3 | |
| Assets | |||
| Current Assets | |||
| Cash | $27,263 | $49,526 | $78,045 |
| Accounts Receivable | $39,800 | $45,923 | $53,941 |
| Other Current Assets | $0 | $0 | $0 |
| Total Current Assets | $67,063 | $95,449 | $131,987 |
| Long-term Assets | |||
| Long-term Assets | $20,000 | $20,000 | $20,000 |
| Accumulated Depreciation | $2,856 | $5,712 | $8,568 |
| Total Long-term Assets | $17,144 | $14,288 | $11,432 |
| Total Assets | $84,207 | $109,737 | $143,419 |
| Liabilities and Capital | Year 1 | Year 2 | Year 3 |
| Current Liabilities | |||
| Accounts Payable | $14,307 | $14,535 | $17,456 |
| Current Borrowing | $0 | $0 | $0 |
| Other Current Liabilities | $0 | $0 | $0 |
| Subtotal Current Liabilities | $14,307 | $14,535 | $17,456 |
| Long-term Liabilities | $50,000 | $50,000 | $50,000 |
| Total Liabilities | $64,307 | $64,535 | $67,456 |
| Paid-in Capital | $50,000 | $50,000 | $50,000 |
| Retained Earnings | ($54,000) | ($30,099) | ($4,798) |
| Earnings | $23,901 | $25,301 | $30,761 |
| Total Capital | $19,901 | $45,202 | $75,962 |
| Total Liabilities and Capital | $84,207 | $109,737 | $143,419 |
| Net Worth | $19,901 | $45,202 | $75,962 |
7.5 Business Ratios
Business ratios for the years of this plan are shown below. Industry profile ratios based on the Standard Industrial Classification (SIC) code 7389, Language Translation and Interpretation Services, are shown for comparison.
| Ratio Analysis | ||||
| Year 1 | Year 2 | Year 3 | Industry Profile | |
| Sales Growth | 0.00% | 15.38% | 17.46% | 8.20% |
| Percent of Total Assets | ||||
| Accounts Receivable | 47.26% | 41.85% | 37.61% | 26.30% |
| Other Current Assets | 0.00% | 0.00% | 0.00% | 44.20% |
| Total Current Assets | 79.64% | 86.98% | 92.03% | 74.30% |
| Long-term Assets | 20.36% | 13.02% | 7.97% | 25.70% |
| Total Assets | 100.00% | 100.00% | 100.00% | 100.00% |
| Current Liabilities | 16.99% | 13.25% | 12.17% | 49.00% |
| Long-term Liabilities | 59.38% | 45.56% | 34.86% | 13.80% |
| Total Liabilities | 76.37% | 58.81% | 47.03% | 62.80% |
| Net Worth | 23.63% | 41.19% | 52.97% | 37.20% |
| Percent of Sales | ||||
| Sales | 100.00% | 100.00% | 100.00% | 100.00% |
| Gross Margin | 61.54% | 59.37% | 57.30% | 0.00% |
| Selling, General & Administrative Expenses | 52.70% | 51.14% | 48.71% | 81.40% |
| Advertising Expenses | 0.00% | 0.00% | 0.00% | 1.70% |
| Profit Before Interest and Taxes | 14.34% | 13.06% | 13.23% | 2.10% |
| Main Ratios | ||||
| Current | 4.69 | 6.57 | 7.56 | 1.49 |
| Quick | 4.69 | 6.57 | 7.56 | 1.17 |
| Total Debt to Total Assets | 76.37% | 58.81% | 47.03% | 62.80% |
| Pre-tax Return on Net Worth | 171.57% | 79.96% | 57.85% | 4.20% |
| Pre-tax Return on Assets | 40.55% | 32.94% | 30.64% | 11.30% |
| Additional Ratios | Year 1 | Year 2 | Year 3 | |
| Net Profit Margin | 8.75% | 8.03% | 8.31% | n.a |
| Return on Equity | 120.10% | 55.97% | 40.49% | n.a |
| Activity Ratios | ||||
| Accounts Receivable Turnover | 5.14 | 5.14 | 5.14 | n.a |
| Collection Days | 57 | 66 | 66 | n.a |
| Accounts Payable Turnover | 10.50 | 12.17 | 12.17 | n.a |
| Payment Days | 28 | 30 | 27 | n.a |
| Total Asset Turnover | 3.24 | 2.87 | 2.58 | n.a |
| Debt Ratios | ||||
| Debt to Net Worth | 3.23 | 1.43 | 0.89 | n.a |
| Current Liab. to Liab. | 0.22 | 0.23 | 0.26 | n.a |
| Liquidity Ratios | ||||
| Net Working Capital | $52,757 | $80,914 | $114,530 | n.a |
| Interest Coverage | 7.83 | 8.23 | 9.79 | n.a |
| Additional Ratios | ||||
| Assets to Sales | 0.31 | 0.35 | 0.39 | n.a |
| Current Debt/Total Assets | 17% | 13% | 12% | n.a |
| Acid Test | 1.91 | 3.41 | 4.47 | n.a |
| Sales/Net Worth | 13.72 | 6.97 | 4.87 | n.a |
| Dividend Payout | 0.00 | 0.00 | 0.00 | n.a |
Appendix
| Sales Forecast | |||||||||||||
| Month 1 | Month 2 | Month 3 | Month 4 | Month 5 | Month 6 | Month 7 | Month 8 | Month 9 | Month 10 | Month 11 | Month 12 | ||
| Sales | |||||||||||||
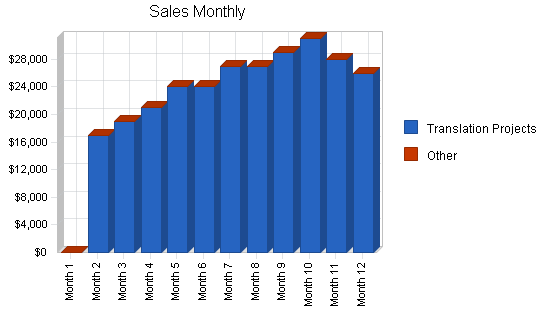
| Translation Projects | 0% | $0 | $17,000 | $19,000 | $21,000 | $24,000 | $24,000 | $27,000 | $27,000 | $29,000 | $31,000 | $28,000 | $26,000 |
| Other | 0% | $0 | $0 | $0 | $0 | $0 | $0 | $0 | $0 | $0 | $0 | $0 | $0 |
| Total Sales | $0 | $17,000 | $19,000 | $21,000 | $24,000 | $24,000 | $27,000 | $27,000 | $29,000 | $31,000 | $28,000 | $26,000 | |
| Direct Cost of Sales | Month 1 | Month 2 | Month 3 | Month 4 | Month 5 | Month 6 | Month 7 | Month 8 | Month 9 | Month 10 | Month 11 | Month 12 | |
| Translation Projects | $0 | $6,000 | $7,000 | $8,000 | $9,000 | $9,000 | $10,000 | $10,000 | $12,000 | $12,500 | $11,500 | $10,000 | |
| Other | $0 | $0 | $0 | $0 | $0 | $0 | $0 | $0 | $0 | $0 | $0 | $0 | |
| Subtotal Direct Cost of Sales | $0 | $6,000 | $7,000 | $8,000 | $9,000 | $9,000 | $10,000 | $10,000 | $12,000 | $12,500 | $11,500 | $10,000 | |
| Personnel Plan | |||||||||||||
| Month 1 | Month 2 | Month 3 | Month 4 | Month 5 | Month 6 | Month 7 | Month 8 | Month 9 | Month 10 | Month 11 | Month 12 | ||
| Project Managers (2) | 0% | $5,000 | $5,000 | $5,000 | $5,000 | $5,000 | $5,000 | $5,000 | $5,000 | $5,000 | $5,000 | $5,000 | $5,000 |
| Marketing Person | 0% | $3,000 | $3,000 | $3,000 | $3,000 | $3,000 | $3,000 | $3,000 | $3,000 | $3,000 | $3,000 | $3,000 | $3,000 |
| Other | 0% | $0 | $0 | $0 | $0 | $0 | $0 | $0 | $0 | $0 | $0 | $0 | $0 |
| Total People | 3 | 3 | 3 | 3 | 3 | 3 | 3 | 3 | 3 | 3 | 3 | 3 | |
| Total Payroll | $8,000 | $8,000 | $8,000 | $8,000 | $8,000 | $8,000 | $8,000 | $8,000 | $8,000 | $8,000 | $8,000 | $8,000 | |
| General Assumptions | |||||||||||||
| Month 1 | Month 2 | Month 3 | Month 4 | Month 5 | Month 6 | Month 7 | Month 8 | Month 9 | Month 10 | Month 11 | Month 12 | ||
| Plan Month | 1 | 2 | 3 | 4 | 5 | 6 | 7 | 8 | 9 | 10 | 11 | 12 | |
| Current Interest Rate | 10.00% | 10.00% | 10.00% | 10.00% | 10.00% | 10.00% | 10.00% | 10.00% | 10.00% | 10.00% | 10.00% | 10.00% | |
| Long-term Interest Rate | 10.00% | 10.00% | 10.00% | 10.00% | 10.00% | 10.00% | 10.00% | 10.00% | 10.00% | 10.00% | 10.00% | 10.00% | |
| Tax Rate | 30.00% | 30.00% | 30.00% | 30.00% | 30.00% | 30.00% | 30.00% | 30.00% | 30.00% | 30.00% | 30.00% | 30.00% | |
| Other | 0 | 0 | 0 | 0 | 0 | 0 | 0 | 0 | 0 | 0 | 0 | 0 | |
| Pro Forma Profit and Loss | |||||||||||||
| Month 1 | Month 2 | Month 3 | Month 4 | Month 5 | Month 6 | Month 7 | Month 8 | Month 9 | Month 10 | Month 11 | Month 12 | ||
| Sales | $0 | $17,000 | $19,000 | $21,000 | $24,000 | $24,000 | $27,000 | $27,000 | $29,000 | $31,000 | $28,000 | $26,000 | |
| Direct Cost of Sales | $0 | $6,000 | $7,000 | $8,000 | $9,000 | $9,000 | $10,000 | $10,000 | $12,000 | $12,500 | $11,500 | $10,000 | |
| Other Production Expenses | $0 | $0 | $0 | $0 | $0 | $0 | $0 | $0 | $0 | $0 | $0 | $0 | |
| Total Cost of Sales | $0 | $6,000 | $7,000 | $8,000 | $9,000 | $9,000 | $10,000 | $10,000 | $12,000 | $12,500 | $11,500 | $10,000 | |
| Gross Margin | $0 | $11,000 | $12,000 | $13,000 | $15,000 | $15,000 | $17,000 | $17,000 | $17,000 | $18,500 | $16,500 | $16,000 | |
| Gross Margin % | 0.00% | 64.71% | 63.16% | 61.90% | 62.50% | 62.50% | 62.96% | 62.96% | 58.62% | 59.68% | 58.93% | 61.54% | |
| Expenses | |||||||||||||
| Payroll | $8,000 | $8,000 | $8,000 | $8,000 | $8,000 | $8,000 | $8,000 | $8,000 | $8,000 | $8,000 | $8,000 | $8,000 | |
| Sales and Marketing and Other Expenses | $150 | $150 | $150 | $150 | $150 | $150 | $150 | $150 | $150 | $150 | $150 | $150 | |
| Depreciation | $238 | $238 | $238 | $238 | $238 | $238 | $238 | $238 | $238 | $238 | $238 | $238 | |
| Leased Equipment | $0 | $0 | $0 | $0 | $0 | $0 | $0 | $0 | $0 | $0 | $0 | $0 | |
| Utilities | $150 | $150 | $150 | $150 | $150 | $150 | $150 | $150 | $150 | $150 | $150 | $150 | |
| Insurance | $0 | $0 | $0 | $0 | $0 | $0 | $0 | $0 | $0 | $0 | $0 | $0 | |
| Rent | $1,000 | $1,000 | $1,000 | $1,000 | $1,000 | $1,000 | $1,000 | $1,000 | $1,000 | $1,000 | $1,000 | $1,000 | |
| Payroll Taxes | 15% | $1,200 | $1,200 | $1,200 | $1,200 | $1,200 | $1,200 | $1,200 | $1,200 | $1,200 | $1,200 | $1,200 | $1,200 |
| Other | $0 | $0 | $0 | $0 | $0 | $0 | $0 | $0 | $0 | $0 | $0 | $0 | |
| Total Operating Expenses | $10,738 | $10,738 | $10,738 | $10,738 | $10,738 | $10,738 | $10,738 | $10,738 | $10,738 | $10,738 | $10,738 | $10,738 | |
| Profit Before Interest and Taxes | ($10,738) | $262 | $1,262 | $2,262 | $4,262 | $4,262 | $6,262 | $6,262 | $6,262 | $7,762 | $5,762 | $5,262 | |
| EBITDA | ($10,500) | $500 | $1,500 | $2,500 | $4,500 | $4,500 | $6,500 | $6,500 | $6,500 | $8,000 | $6,000 | $5,500 | |
| Interest Expense | $417 | $417 | $417 | $417 | $417 | $417 | $417 | $417 | $417 | $417 | $417 | $417 | |
| Taxes Incurred | ($3,346) | ($46) | $254 | $554 | $1,154 | $1,154 | $1,754 | $1,754 | $1,754 | $2,204 | $1,604 | $1,454 | |
| Net Profit | ($7,808) | ($108) | $592 | $1,292 | $2,692 | $2,692 | $4,092 | $4,092 | $4,092 | $5,142 | $3,742 | $3,392 | |
| Net Profit/Sales | 0.00% | -0.64% | 3.11% | 6.15% | 11.22% | 11.22% | 15.15% | 15.15% | 14.11% | 16.59% | 13.36% | 13.05% | |
| Pro Forma Cash Flow | |||||||||||||
| Month 1 | Month 2 | Month 3 | Month 4 | Month 5 | Month 6 | Month 7 | Month 8 | Month 9 | Month 10 | Month 11 | Month 12 | ||
| Cash Received | |||||||||||||
| Cash from Operations | |||||||||||||
| Cash Sales | $0 | $4,250 | $4,750 | $5,250 | $6,000 | $6,000 | $6,750 | $6,750 | $7,250 | $7,750 | $7,000 | $6,500 | |
| Cash from Receivables | $0 | $0 | $425 | $12,800 | $14,300 | $15,825 | $18,000 | $18,075 | $20,250 | $20,300 | $21,800 | $23,175 | |
| Subtotal Cash from Operations | $0 | $4,250 | $5,175 | $18,050 | $20,300 | $21,825 | $24,750 | $24,825 | $27,500 | $28,050 | $28,800 | $29,675 | |
| Additional Cash Received | |||||||||||||
| Sales Tax, VAT, HST/GST Received | 0.00% | $0 | $0 | $0 | $0 | $0 | $0 | $0 | $0 | $0 | $0 | $0 | $0 |
| New Current Borrowing | $0 | $0 | $0 | $0 | $0 | $0 | $0 | $0 | $0 | $0 | $0 | $0 | |
| New Other Liabilities (interest-free) | $0 | $0 | $0 | $0 | $0 | $0 | $0 | $0 | $0 | $0 | $0 | $0 | |
| New Long-term Liabilities | $0 | $0 | $0 | $0 | $0 | $0 | $0 | $0 | $0 | $0 | $0 | $0 | |
| Sales of Other Current Assets | $0 | $0 | $0 | $0 | $0 | $0 | $0 | $0 | $0 | $0 | $0 | $0 | |
| Sales of Long-term Assets | $0 | $0 | $0 | $0 | $0 | $0 | $0 | $0 | $0 | $0 | $0 | $0 | |
| New Investment Received | $0 | $0 | $0 | $0 | $0 | $0 | $0 | $0 | $0 | $0 | $0 | $0 | |
| Subtotal Cash Received | $0 | $4,250 | $5,175 | $18,050 | $20,300 | $21,825 | $24,750 | $24,825 | $27,500 | $28,050 | $28,800 | $29,675 | |
| Expenditures | Month 1 | Month 2 | Month 3 | Month 4 | Month 5 | Month 6 | Month 7 | Month 8 | Month 9 | Month 10 | Month 11 | Month 12 | |
| Expenditures from Operations | |||||||||||||
| Cash Spending | $8,000 | $8,000 | $8,000 | $8,000 | $8,000 | $8,000 | $8,000 | $8,000 | $8,000 | $8,000 | $8,000 | $8,000 | |
| Bill Payments | ($430) | ($120) | $8,914 | $10,214 | $11,524 | $13,070 | $13,124 | $14,670 | $14,737 | $16,702 | $17,567 | $15,965 | |
| Subtotal Spent on Operations | $7,570 | $7,880 | $16,914 | $18,214 | $19,524 | $21,070 | $21,124 | $22,670 | $22,737 | $24,702 | $25,567 | $23,965 | |
| Additional Cash Spent | |||||||||||||
| Sales Tax, VAT, HST/GST Paid Out | $0 | $0 | $0 | $0 | $0 | $0 | $0 | $0 | $0 | $0 | $0 | $0 | |
| Principal Repayment of Current Borrowing | $0 | $0 | $0 | $0 | $0 | $0 | $0 | $0 | $0 | $0 | $0 | $0 | |
| Other Liabilities Principal Repayment | $0 | $0 | $0 | $0 | $0 | $0 | $0 | $0 | $0 | $0 | $0 | $0 | |
| Long-term Liabilities Principal Repayment | $0 | $0 | $0 | $0 | $0 | $0 | $0 | $0 | $0 | $0 | $0 | $0 | |
| Purchase Other Current Assets | $0 | $0 | $0 | $0 | $0 | $0 | $0 | $0 | $0 | $0 | $0 | $0 | |
| Purchase Long-term Assets | $0 | $0 | $0 | $0 | $0 | $0 | $0 | $0 | $0 | $0 | $0 | $0 | |
| Dividends | $0 | $0 | $0 | $0 | $0 | $0 | $0 | $0 | $0 | $0 | $0 | $0 | |
| Subtotal Cash Spent | $7,570 | $7,880 | $16,914 | $18,214 | $19,524 | $21,070 | $21,124 | $22,670 | $22,737 | $24,702 | $25,567 | $23,965 | |
| Net Cash Flow | ($7,570) | ($3,630) | ($11,739) | ($164) | $776 | $755 | $3,626 | $2,155 | $4,763 | $3,348 | $3,233 | $5,710 | |
| Cash Balance | $18,430 | $14,799 | $3,061 | $2,897 | $3,674 | $4,428 | $8,055 | $10,210 | $14,973 | $18,321 | $21,554 | $27,263 | |
| Pro Forma Balance Sheet | |||||||||||||
| Month 1 | Month 2 | Month 3 | Month 4 | Month 5 | Month 6 | Month 7 | Month 8 | Month 9 | Month 10 | Month 11 | Month 12 | ||
| Assets | Starting Balances | ||||||||||||
| Current Assets | |||||||||||||
| Cash | $26,000 | $18,430 | $14,799 | $3,061 | $2,897 | $3,674 | $4,428 | $8,055 | $10,210 | $14,973 | $18,321 | $21,554 | $27,263 |
| Accounts Receivable | $0 | $0 | $12,750 | $26,575 | $29,525 | $33,225 | $35,400 | $37,650 | $39,825 | $41,325 | $44,275 | $43,475 | $39,800 |
| Other Current Assets | $0 | $0 | $0 | $0 | $0 | $0 | $0 | $0 | $0 | $0 | $0 | $0 | $0 |
| Total Current Assets | $26,000 | $18,430 | $27,549 | $29,636 | $32,422 | $36,899 | $39,828 | $45,705 | $50,035 | $56,298 | $62,596 | $65,029 | $67,063 |
| Long-term Assets | |||||||||||||
| Long-term Assets | $20,000 | $20,000 | $20,000 | $20,000 | $20,000 | $20,000 | $20,000 | $20,000 | $20,000 | $20,000 | $20,000 | $20,000 | $20,000 |
| Accumulated Depreciation | $0 | $238 | $476 | $714 | $952 | $1,190 | $1,428 | $1,666 | $1,904 | $2,142 | $2,380 | $2,618 | $2,856 |
| Total Long-term Assets | $20,000 | $19,762 | $19,524 | $19,286 | $19,048 | $18,810 | $18,572 | $18,334 | $18,096 | $17,858 | $17,620 | $17,382 | $17,144 |
| Total Assets | $46,000 | $38,192 | $47,073 | $48,922 | $51,470 | $55,709 | $58,400 | $64,039 | $68,131 | $74,156 | $80,216 | $82,411 | $84,207 |
| Liabilities and Capital | Month 1 | Month 2 | Month 3 | Month 4 | Month 5 | Month 6 | Month 7 | Month 8 | Month 9 | Month 10 | Month 11 | Month 12 | |
| Current Liabilities | |||||||||||||
| Accounts Payable | $0 | $0 | $8,990 | $10,247 | $11,503 | $13,050 | $13,050 | $14,597 | $14,597 | $16,530 | $17,448 | $15,902 | $14,307 |
| Current Borrowing | $0 | $0 | $0 | $0 | $0 | $0 | $0 | $0 | $0 | $0 | $0 | $0 | $0 |
| Other Current Liabilities | $0 | $0 | $0 | $0 | $0 | $0 | $0 | $0 | $0 | $0 | $0 | $0 | $0 |
| Subtotal Current Liabilities | $0 | $0 | $8,990 | $10,247 | $11,503 | $13,050 | $13,050 | $14,597 | $14,597 | $16,530 | $17,448 | $15,902 | $14,307 |
| Long-term Liabilities | $50,000 | $50,000 | $50,000 | $50,000 | $50,000 | $50,000 | $50,000 | $50,000 | $50,000 | $50,000 | $50,000 | $50,000 | $50,000 |
| Total Liabilities | $50,000 | $50,000 | $58,990 | $60,247 | $61,503 | $63,050 | $63,050 | $64,597 | $64,597 | $66,530 | $67,448 | $65,902 | $64,307 |
| Paid-in Capital | $50,000 | $50,000 | $50,000 | $50,000 | $50,000 | $50,000 | $50,000 | $50,000 | $50,000 | $50,000 | $50,000 | $50,000 | $50,000 |
| Retained Earnings | ($54,000) | ($54,000) | ($54,000) | ($54,000) | ($54,000) | ($54,000) | ($54,000) | ($54,000) | ($54,000) | ($54,000) | ($54,000) | ($54,000) | ($54,000) |
| Earnings | $0 | ($7,808) | ($7,917) | ($7,325) | ($6,033) | ($3,341) | ($650) | $3,442 | $7,534 | $11,626 | $16,767 | $20,509 | $23,901 |
| Total Capital | ($4,000) | ($11,808) | ($11,917) | ($11,325) | ($10,033) | ($7,341) | ($4,650) | ($558) | $3,534 | $7,626 | $12,767 | $16,509 | $19,901 |
| Total Liabilities and Capital | $46,000 | $38,192 | $47,073 | $48,922 | $51,470 | $55,709 | $58,400 | $64,039 | $68,131 | $74,156 | $80,216 | $82,411 | $84,207 |
| Net Worth | ($4,000) | ($11,808) | ($11,917) | ($11,325) | ($10,033) | ($7,341) | ($4,650) | ($558) | $3,534 | $7,626 | $12,767 | $16,509 | $19,901 |

