
DocBuzz, Inc.
Executive Summary
DocBuzz, Inc. is a medical marketing company specializing in pharmaceutical, biotechnical and medical device detailing for the benefit of the medical community. DocBuzz, Inc. is the only company of its kind; a business especially designed for doctors and the medical community, owned and operated by practicing physicians.
The pharmaceutical market is one of the most profitable industries, with revenue in excess of $96.3 billion annually. The problem that the pharmaceutical industry has is simply time. Time for research and development, time for branding, time for marketing and sales, time to gain the trust and acceptance of the medical community. In this industry, we can equate time with money.
Two additional industries have similar situations with their products. Those industries are the biotech and the medical device companies. While the revenues are not as great as what one will find within the pharmaceutical industry, these companies face heavy competition within their own individual industries.
DocBuzz, Inc., has developed a method that allows all of these industries to benefit from prelaunch marketing, product branding, and postlaunch sales support–all accomplished with the direct intervention of practicing physicians. DocBuzz, Inc., gives the client companies the opportunity to market directly to the decision makers, establishing immediate credibility through our extensive network of physicians and other medical professionals. Providing live conferences, 24 hours a day, seven days a week, access to a myriad of current information on various pharmaceutical products, new biotech developments and medical devices, medical chat rooms, and online marketing make our e-detailing the most cost effective of any service offered.
The pharmaceutical, biotech and medical device industries will contract with DocBuzz, Inc., to provide marketing services, and because we are practicing physicians, we have immediate access to our colleagues. We can deliver these companies’ message directly to the decision makers for 75% of what these industries are currently budgeting. In addition, DocBuzz, Inc., by virtue of its unique incentive program will allow additional revenue to participating physicians and other medical practitioners.
DocBuzz has developed a winning strategy to provide the best and most up to date information to the medical community, while providing a method for these industries to announce, promote and market their products through respected practicing physicians. The individual professionals within the medical community benefit by receiving the most up to date industry information, all received via the Internet, and at the end of the e-detailing they will have the option to request samples, additional information on the product and/or the visit from a pharmaceutical company representative. Professionals on our medical panel can earn points by participating in our e-detailing and/or by referral of others who join our program.
1.1 Keys to Success
DocBuzz, Inc., has identified four key strategies that we feel are essential for success:
- Improve access of the prescribing doctor to the pharmaceuticals via newly developed Internet technology, to accelerate market acceptance of a product and to increase its prescribing pattern.
- DocBuzz, Inc., uses a grass root approach to recruit and retain participating prescribing medical professionals through a value incentive referral point program (VIRP). DocBuzz, Inc., as a physician owned and operated company, understands physician’s needs and offers, in addition to our unique VIRP system, other value added programs such as CME, physician cyber meeting places and other extensive point redemption options.
- DocBuzz, Inc. can provide evidence-based analysis for the pharmaceutical industry in order to justify the pharmaceutical investment in e-detailing.
- DocBuzz, Inc., anticipates aggressive, but controlled growth, in order to maintain the quality of our service.
1.2 Mission
DocBuzz, Inc., offers pharmaceutical, biotechnical and medical device manufacturers a reliable, high quality alternative to in-house resources for sales and marketing. DocBuzz, Inc., improves the return on sales and marketing investment by accelerating the physician learning curve on prelaunch, new, and existing products–through Web access to educational detailing and marketing research. In addition, DocBuzz, Inc., will benefit small and innovative biotechnology and pharmaceutical companies that do not have an extensive sales force to cover North America.
1.3 Objectives
- To establish ourselves as a premier pharmaceutical e-detailing company, targeting medical professionals–i.e. physicians, nurse practitioners, physician assistants, dentists, and podiatrists.
- We will offer value added services such as CME, current medical information updates, and physician meeting facilities (chat room and bulletin board).
- To hire staff both currently identified and unidentified to implement our business concept.
- To sign up 5% of the more than 650K prescribing medical professionals by year three, and provide 300K pharmaceutical detailing per year, by year three.
- To reach a break-even point of $35,936 by the end of year two.
Company Summary
Experienced physicians founded DocBuzz, Inc., as a company providing high-level expertise in e-detailing of pharmaceutical, biotechnical products and medical equipment to physicians and other medical professionals. It serves to capitalize the growing number of small and mid-sized companies as well as established larger companies to improve upon the awareness of pharmaceutical products and to increase the written prescription pattern of such products.
2.1 Company Ownership
DocBuzz, Inc., is a privately held Delaware corporation. Robert E. Rayder, MD, FAAP and Michael Y. Wu, MD, FAAP, are the founders and managing partners.
2.2 Start-up Summary
Total start-up expense (including legal cost, logo design, stationery and related expenses) comes to $99,000. The table below illustrates a complete breakdown of all start-up assets that are needed, as total start-up requirements. Currently, we have no short-term liabilities.

| Start-up Funding | |
| Start-up Expenses to Fund | $99,000 |
| Start-up Assets to Fund | $309,000 |
| Total Funding Required | $408,000 |
| Assets | |
| Non-cash Assets from Start-up | $5,000 |
| Cash Requirements from Start-up | $304,000 |
| Additional Cash Raised | $0 |
| Cash Balance on Starting Date | $304,000 |
| Total Assets | $309,000 |
| Liabilities and Capital | |
| Liabilities | |
| Current Borrowing | $0 |
| Long-term Liabilities | $0 |
| Accounts Payable (Outstanding Bills) | $0 |
| Other Current Liabilities (interest-free) | $0 |
| Total Liabilities | $0 |
| Capital | |
| Planned Investment | |
| Investor 1 | $158,000 |
| Investor 2 | $250,000 |
| Additional Investment Requirement | $0 |
| Total Planned Investment | $408,000 |
| Loss at Start-up (Start-up Expenses) | ($99,000) |
| Total Capital | $309,000 |
| Total Capital and Liabilities | $309,000 |
| Total Funding | $408,000 |
| Start-up | |
| Requirements | |
| Start-up Expenses | |
| Legal | $3,000 |
| Stationery etc. | $20,000 |
| Brochures | $7,500 |
| Consultants | $20,000 |
| Insurance | $2,500 |
| Rent | $10,000 |
| Research and Development | $5,000 |
| Expensed Equipment | $30,000 |
| Other | $1,000 |
| Total Start-up Expenses | $99,000 |
| Start-up Assets | |
| Cash Required | $304,000 |
| Other Current Assets | $5,000 |
| Long-term Assets | $0 |
| Total Assets | $309,000 |
| Total Requirements | $408,000 |
2.3 Company Locations and Facilities
DocBuzz, Inc., currently occupies a shared office space at 2476 North University Drive, Pembroke Pines, FL 33024. The current office provides sufficient space to launch the project; however, prior to implementation, separate facilities with easy access, and the ability to have the T-1 or T-4 connections will be required to implement our Internet program, which is the backbone of our business.
Services
DocBuzz, Inc., offers e-detailing of pharmaceutical products and augmentation of pharmaceutical companies sales forces. According to the IMS Health Report, pharmaceutical detailing is a 50 billion dollar a year industry. Detailing is the portion of the pharmaceutical sales organization that provides information on new pharmaceutical products, face-to-face meetings with physicians, physician assistants, and nurse practitioners. Detailing is vital as new products are introduced, because the pharmaceutical companies must then make the medical professionals aware of the products, the method of administration, side effects and a myriad of other information. DocBuzz, Inc. offers the pharmaceutical companies the ability use e-detailing, which offers all of the benefits of the standard method of detailing, but with this difference: DocBuzz, Inc., uses the Internet, websites, personal referral networks, conferences, and Web conferences to achieve effective results at a lower cost to the pharmaceutical companies.
3.1 Service Description
DocBuzz, Inc., provides physician assisted marketing and sales of pharmaceutical products. Our service is vital during the pharmaceutical companies’ introduction of new products, the prelaunch of those products and increasing the present market share of existing products. Our company is physician owned, therefore, we have the understanding of the physicians’ needs in the current medical environment. In addition, physicians are more inclined to make a positive commitment when speaking to another physician as opposed to a pharmaceutical sales representative.

DocBuzz, Inc., provides a support infrastructure to pharmaceutical companies’ sales representatives nationwide by offering 24 hour, seven day a week service through our online literature and sampling requests.
Our company represents client companies, as an extension of its already established pharmaceutical sales force, not as a replacement. As a physician owned company, we understand first-hand our client’s endeavor to reach the busy, hurried medical provider, and the frustration and failure of missed contacts. We offer an additional tool to insure that the pharmaceutical company’s message is delivered and that the expenditure time with the medical professional is more productive. The physician will not have the time to listen to pharmaceutical sales representative but will make the time to talk to a trusted member of the medical community. More importantly, the product recommendations are considered more credible since the recommendation is coming from a physician. By using our Internet sampling request, physicians will make their needs known to us, and in turn, we pass that information directly to the sales representative. This increases the productivity of both the sales representative and the physician.
One of the tasks of a pharmaceutical company is to provide educational descriptions of their products to targeted physicians. This is most cost effectively achieved by the Internet’s 24/7 access availability, and our unique incentive program (VIRP). By associating with DocBuzz, pharmaceutical representatives, a vital part of the industries marketing and sales, could offer email response or telephone the physician at a more convenient time 24 hours a day, seven days a week.
3.2 Sales Literature
Literature, articles, product descriptions for all of the companies products we represent, and all of the other information that a practicing physician or other medical professional needs to know, will be available for immediate access through our Internet site.
Introductory information about our company will also be placed on our website, but detailed information describing our company and its positioning will be mailed to the medical professional prior to a DocBuzz, Inc., representative telephone conference or visit to the client’s facility.
3.3 Competitive Comparison
The competition comes in several forms.
Eric Rule, a partner with Cooper & Lybrand’s Integrated Healthcare Consulting Services practice, said, “With competition intensifying in the world’s pharmaceutical markets, being the first to market is crucial to securing a product’s success”. In the article Survey: Strategic issues facing the pharmaceutical industry, printed in Pharmaceutical Representative, dated April 17, 2001, one hundred-fifty senior pharmaceutical and biotechnology industry executives in the United States and Canada rated time-to-market for new products and making strategic alliances successful as number one and three respectively out of a list of twenty-three of the most important issues that face the pharmaceutical, biotech and medical device industries. The pharmaceutical industry has been dependant on their own in-house sales and marketing representatives to insure that the introduction of new products is successful.
The pharmaceutical industry is using net techniques to keep the rising cost of marketing their products to the medical community under control. Pharmaceutical companies are actively seeking to form strategic alliances with physicians both individually and collectively. “When industry leaders tell you that timely development of new products is the top key issue for the fifth consecutive year, you can be sure they’re pulling out all the stops to get differentiated products to the market ahead of the competition,” said Erik Rule. Andersen Consulting produced the report How Much are Marketing and Sales Capabilities Really Worth? What Every Pharmaceutical Executive Should Know. This report illustrates that within the pharmaceutical market, product differentiation overall is very small, so any differentiation must be driven through marketing and sales. The report shows that “42% [of the difference in operating margin] is explained by marketing and sales capabilities performance.” The report continues, “There are lots of me-too products in the market with very little differentiation. It is the job of marketing and sales to drive the differentiation.” The pharmaceutical industry is feeling the pure economic pressure of the market place, their shareholders demand increased profits and everything the company does costs money. The pharmaceutical companies’ need to reduce sales and marketing expense, while increasing their sales, is forcing them to try new methods, which translates into additional competition for our company.
Andersen Consulting surveyed 68 senior marketing and sales executives representing 18 large pharmaceutical companies in North America. The finding illustrates the pressure that the industry is experiencing. The difference between an average performance operating margin and the high performance-operating margin is 42%. That is not much of a difference, until one realizes that this is a one billion dollar industry, and if DocBuzz could simply improve a companies marketing and sales capability by 30%, that would translate into an additional $135 million in operating margin. The pharmaceutical industry generates $93.6 billion annually.
Our greatest competition comes from the pharmaceutical industry itself. The competitive pressure within the industry provides the perfect climate for us to launch our services. The industry has to make marketing and strategic alliance decisions so quickly, that markets are being ignored and these markets, when combined, are huge. For example, currently there is no e-detailing to the thousands of Physician Assistants and Nurse Practitioners. Research indicates that there are approximately 650,000 physicians in the United States; however, there is at least twice that number of Physician Assistants and Nurse Practitioners in the United States. The DocBuzz, Inc., target market, in addition to physicians, is to the physician assistants and nurse practitioners.
DocBuzz, Inc., has identified four start-up companies that are in various stages of development. These companies are:
- RxCentric.com;
- Busydoctor.com;
- Hankyung.com (Korea only);
- Skila.com;
- PharmaDetailing.com;
- MyDrugRep.com.
These businesses are focusing on e-detailing to the physician, but are not actively marketing to the physician assistants or nurse practitioners. In addition, we are the only company that is physician owned and operated. This difference is significant because as practicing physicians, we have the ability to reach the medical decision maker. As physicians, we have strong credibility when making a recommendation to a colleague. This ability will translate into increased prescription pattern of pharmaceutical products that we recommend.
3.4 Technology
DocBuzz, Inc., will have complete e-detailing facilities with the ability to prepare and deliver interactive multimedia presentations. We will have the capabilities to provide live chat, and prerecorded video presentations on a private and secured site.
DocBuzz, Inc., facilities house complete e-detailing operations, including the ability to prepare and deliver customized multimedia presentations. The ability to provide this type of interactive service is vital since it is one aspect of our company that separates us from our competition. As technology improves, the services we offer to the pharmaceutical, biotech and medical devices companies will grow as we incorporate the new improved technology.
3.5 Future Services
Once we achieve adequate market share in the United States, we will expand our operations to include South America, Japan, Israel, and Europe.
3.6 Fulfillment
DocBuzz, Inc., will provide consulting, sales and marketing service to the pharmaceutical industry. The pharmaceutical companies will pay an upfront fee for our consulting service. In addition, DocBuzz, Inc., will generate additional income streams by selling products that our clients produce; retaining the difference between the wholesale and the retail price of the product.
Additional detailed information regarding the sales forecast, unit price, sales, direct unit cost and direct cost of sales is found in the Sales Strategy section.
Market Analysis Summary
Currently, the largest market segment is the pharmaceutical industry. In addition to pharmaceuticals, DocBuzz, Inc., will also target the fast growing biotechnical companies and medical device manufacturers. The market has demonstrated a sustained annual growth of approximately 11 percent. With this growth, the R and D costs will continue to increase. Through our prelaunch and marketing services, we will enable the pharmaceutical products to gain faster market share and increase their return on investment.
4.1 Market Segmentation
One of the most important marketing segments is the pharmaceutical industry, such as Pfizer, Glaxo-Welcome and Merck. Many companies have merged, acquiring controlling interest, forming strategic alliances, and placing others under exclusive contract and basically controlling the majority of this industry. DocBuzz, Inc., will work with these huge companies, but we will also work with the much smaller and lesser-known companies that have solid financial bases, but not the ability to overcome the budget and the in-house sales and marketing staff that the larger companies have. DocBuzz, Inc., will provide consultation, sales and marketing, and e-detailing support to all of these companies, regardless of size or market share.
Medical professionals comprise the key marketing component. Without this specific target market, the pharmaceutical, biotech and medical devices industries will disappear. All of our clients realize the importance of courting this one vital target market, the physician. DocBuzz, Inc., has a natural advantage in courting and delivering this segment for the benefit of all of the various markets we have targeted.
Biotech industry represents a smaller market in total revenue distributed for sales and marketing, compared to the pharmaceutical industry; however, this industry has shown a stable and quickly growing market.
Medical devices is the one sector that we will target that has the slowest growth. DocBuzz, Inc., is in a natural position to assist in the development of this industry, because we can open the doors that are closed to all but practicing members of the medical community. Companies that offer these services are vital to the medical community; however, until our company developed, this sector worked on the “old boy” network. Repairs are often sent to the manufacturer. The manufacturer provides long delays in returning the repaired equipment and it is often much more expensive than going to the companies that we represent.
Additionally, companies that are developing and marketing new medical devices need to have rapid entry into the market place. DocBuzz, Inc., provides this ability for the company that is manufacturing, conducting research and development, and any other company who needs to have immediate entry into the medical community. The marketing of service contracts will also increase through our efforts in the future.
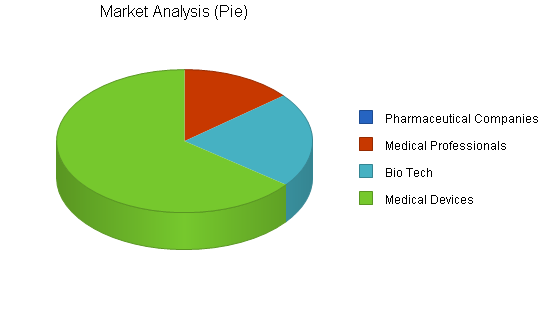
| Market Analysis | |||||||
| Year 1 | Year 2 | Year 3 | Year 4 | Year 5 | |||
| Potential Customers | Growth | CAGR | |||||
| Pharmaceutical Companies | 14% | 31 | 35 | 40 | 46 | 52 | 13.80% |
| Medical Professionals | 14% | 650,000 | 741,000 | 844,740 | 963,004 | 1,097,825 | 14.00% |
| Bio Tech | 17% | 1,000,000 | 1,170,000 | 1,368,900 | 1,601,613 | 1,873,887 | 17.00% |
| Medical Devices | 7% | 3,000,000 | 3,210,000 | 3,434,700 | 3,675,129 | 3,932,388 | 7.00% |
| Total | 10.39% | 4,650,031 | 5,121,035 | 5,648,380 | 6,239,792 | 6,904,152 | 10.39% |
4.2 Target Market Segment Strategy
The building of a successful Internet e-detailing site is paramount for DocBuzz, Inc., to provide the quantity and quality of service that will insure total success of our venture. Each of our target markets uses the access to information that the Internet provides. DocBuzz, Inc., provides the much needed up-to-date information to the medical professional, then provides additional service by providing a sales and marketing representative to work directly with them.
Each of our target markets has specific needs that are unique to their own industry. DocBuzz, Inc., has focused on the common needs that each of these markets share. In addition to providing the services that fill our target markets’ needs, we also provide an economic incentive for the companies to choose our company.
4.2.1 Market Trends
Escalation of cost will continue within the research and development and sales and marketing. Each of our target markets share the same rising cost of developing a product for the market place, and then the actual marketing of the finished product. DocBuzz, Inc., provides for the more cost effective method of marketing finished products to the market place. The use of e-detailing provides instant access to qualified and interested decision makers within the medical community.
Additionally, DocBuzz, Inc. works with the company to provide market branding, strategic marketing, prelaunch and postlaunch consulting. Our services provide speed and access 24 hours a day, seven days a week, with the ability to download product information immediately. DocBuzz, Inc., representatives will follow up with these busy professionals and secure the sales that our client companies are looking for, at about 75% of the current sales and marketing expense that the companies are currently experiencing.
4.2.2 Market Growth
According to IMS Health marketing surveys, the pharmaceutical companies are enjoying between 10-15 percent annual growth. Additionally, the biotech industry has an annual growth rate of approximately 14% and the medical device industry is growing at about 7% per annum. With e-detailing we can increase the growth further.
Strategy and Implementation Summary
The United States pharmaceutical market is the initial focus of DocBuzz, Inc., emphasizing the sale of pharmaceutical products to all targeted professionals. A special DocBuzz, Inc., liaison is assigned to the pharmaceutical company to evaluate their current market position, its strength and weaknesses. Then, DocBuzz, Inc., will design a complimentary e-marketing strategy and a targeted list of medical professional end users. Due to the shear amount of revenue that the pharmaceutical industry generates, this is the primary targeted industry. The quickly growing biotech and the less quick moving medical devices industries will receive similar service. Both of these industries require prelaunch marketing and focusing the medical community’s attention on the new products, the benefits that these new products will bring, and basically building market needs prior to the product’s official launch.
5.1 Competitive Edge
The pharmaceutical industry is now under increase pressure to improve profitability due to pressure from various non-pharmaceutical related entities. For example, traditionally the pharmaceutical industry is the body that will request changes of drug labeling (what the drug is approved for) such as prescription vs. over the counter, recently Well-Point a California HMO set a precedent by petitioning to the FDA to change three major top revenue generating prescription antihistamine to an over the counter status (Claritin, Zyrtec and Allegra). DocBuzz recognizes this development and will be in a position to assist the pharmaceutical industry to speed up through the use of prelaunch education and marketing to increase profit.
The key to successful e-detailing is an extensive, loyal and active medical professional. DocBuzz, Inc., is a physician owned company. This is a vital point. As practicing physicians, we know and understand the strategy to recruit and retain physicians. We have developed recruitment and retention tools, such as our unique VIRP, CME programs, chat rooms, live conferences and an extensive prize gallery. As practicing physicians, we better than anyone else, understand why a physician has certain prescribing habits and what will encourage that physician to change those habits.
Building this type of loyal network is a new business concept and several start-up companies are in various developmental stages that will provide similar services. These start-up companies’ strategy is to target the “top tier” pharmaceutical companies, with no other target markets. In addition to the “top tier” pharmaceutical companies, DocBuzz, Inc., also targets small- and medium-sized pharmaceutical, biotech and medical device companies. As a physician owned company, we have developed a unique retention program (VIRP) that caters to the needs of the physician.
Currently, there is no e-detailing to the thousands of ARNPs and PAs who prescribe millions of prescriptions yearly. DocBuzz, Inc., intends to market these significant physician extender as well. DocBuzz, Inc., plans on expanding our service to the thousands of physicians in training (interns, residents and medical students).
5.2 Marketing Strategy
DocBuzz, Inc., marketing strategy is the core of the main strategy:
- DocBuzz, Inc., will utilize the principal’s personal contacts within the pharmaceutical, biotech and medical device industry.
- All brochures and interactive CD presentations will be designed and created by DocBuzz, Inc.
- Personal telephone calls by one of the physicians will follow every mailing of material.
- Live presentations and question and answer sessions will be arranged by DocBuzz, Inc.
5.2.1 Pricing Strategy
DocBuzz, Inc., has developed a pricing strategy that provides a solid profit for our company, while providing good value for our client companies.
- The industry average per face-to-face-detailing is $200, with poor to moderate effectiveness.
- DocBuzz, Inc., provides e-detailing availability 24 hours a day, 7 days a week for the modest charge of $150 per e-detailing.
- DocBuzz, Inc., offers discounts for high volume clients (package discounts).
5.2.2 Promotion Strategy
We depend on our extensive network of physicians and other professional contacts within the medical community. As the technology and our client industries change, we will change our strategies.
Networking and Support:
- DocBuzz, Inc., will use contacts that are known to the principals of the company as a base on which to build our network core.
- DocBuzz, Inc., will use the Internet to deliver literature mailing requests and real time demonstrations.
- Literature mailing, phone sales, automated multimedia Power Point presentations, and personal visits by our principle physicians.
5.3 Sales Strategy
The specific sales strategy has been omitted due to critical internal information that is not for public disclosure. The specific sales strategy has been omitted due to critical internal information that is not for public disclosure. The specific sales strategy has been omitted due to critical internal information that is not for public disclosure. The specific sales strategy has been omitted due to critical internal information that is not for public disclosure. The specific sales strategy has been omitted due to critical internal information that is not for public disclosure.
5.3.1 Sales Forecast
The sales forecast monthly summary is included in the appendix. The annual sales projections are included here in the following table.


| Sales Forecast | |||
| Year 1 | Year 2 | Year 3 | |
| Sales | |||
| Pharaceutical Companies | $1,775,000 | $1,900,000 | $3,000,000 |
| Medical Professionals | $717,000 | $500,000 | $1,000,000 |
| Bio-Tech | $1,440,000 | $430,000 | $1,714,200 |
| Medical Devices | $600,000 | $750,000 | $850,000 |
| Other | $0 | $234,800 | $417,992 |
| Total Sales | $4,532,000 | $3,814,800 | $6,982,192 |
| Direct Cost of Sales | Year 1 | Year 2 | Year 3 |
| Pharaceutical Companies | $9,170 | $20,000 | $30,000 |
| Medical Professionals | $2,395 | $25,000 | $60,000 |
| Bio-Tech | $34,200 | $43,000 | $55,000 |
| Medical Devices | $24,000 | $24,000 | $24,000 |
| Other | $0 | $0 | $0 |
| Subtotal Direct Cost of Sales | $69,765 | $112,000 | $169,000 |
5.4 Strategic Alliances
- Professional groups such as the AMA and other specialty organizations.
- IMS Health (to capture individual data and physician prescription patterns).
- PEER GROUP is currently providing marketing/consulting through non-Internet media.
- Technology alliance (i.e. DELL, IBM, and ATT).
- Established Internet product distribution organizations–for example, Amazon.com, Buy.com, and various Travel sites.
- Other medical Internet sites for cross promotion.
5.5 Milestones
The table below indicates specific milestones that we feel are critical to our success. The reader will notice that we listed each specific milestone, start and end date, budget allocated (if any) the specific person responsible for the successful accomplishment. As each milestone is reached, it is deleted out of our plan, and replaced with a new milestone.
This is an example of why our business plan will never be complete, we view it as a living document that is in a constant state of change and growth. We meet on a monthly basis, to review our milestones, and meet with our strategic consultants on a monthly basis, until such time as the consultants can be replaced with our own employees.
| Milestones | |||||
| Milestone | Start Date | End Date | Budget | Manager | Department |
| Interview Plan Consultants | 3/4/2001 | 5/1/2001 | $0 | Mike Wu | Admin |
| Write Business Plan | 5/3/2001 | 6/3/2001 | $1,500 | DFN | Consultant |
| Presign Pharma companies | 5/20/2001 | 7/5/2001 | $600 | Mike Wu | Admin |
| Call Center Alliance | 5/1/5393 | 7/5/2001 | $0 | DFN | Consultant |
| Global-Outsource Call Center | 7/5/2001 | 12/30/2001 | $3,000 | Christian Rose | G-O President |
| Other | 5/1/2001 | 12/30/2001 | $0 | Dr. Rayner | Admin |
| Totals | $5,100 | ||||
Management Summary
The company recognizes that initially we have management gaps. The company is seeking to fill these positions, and should the company require the services of one or more of these positions, the company will hire a consultant to fill the role of a virtual executive as the immediate need presents itself.
Robert E. Rayder, MD, FAAP Founder and Principal
Michael Y. Wu, MD, FAAP Founder and Principal
Dr’s. Rayder and Wu are university-trained pediatricians with a combined 35 years experience in successful private practice. They have significant involvement in the medical and pharmaceutical communities. Both hold faculty positions in several university/medical schools.
CEO (TBA): We are actively searching a dynamic individual MBA with both pharmaceutical and Internet expertise to manage the overall operation of the company.
IT Director (TBA): The IT director will oversee the IT development of the company including Web development.
CFO (TBA): The CFO will be in charge of the overall finance of the company.
Marketing Director (TBA): The marketing director will develop and implement the marketing plan of the company.
6.1 Management Team Gaps
We realize that we have major management team gaps; however, those gaps will be filled on a temporary basis by a virtual management team. This team will be compensated for specific services that they have provided. Using this method, the company will not feel pressured to hire someone that may not be a good fit with our company simply because they are qualified to fill the position.
6.2 Personnel Plan
The table below, contains the details of our personal plan. For the positions filled by virtual management, we have simply listed the office title that person holds. When someone is hired by our company to fill one of these positions, their names will be inserted next to their title.
| Personnel Plan | |||
| Year 1 | Year 2 | Year 3 | |
| Dr. Wu | $75,000 | $75,000 | $82,500 |
| Dr. Rayder | $75,000 | $75,000 | $82,500 |
| CEO | $50,004 | $50,004 | $55,000 |
| IT Director | $39,996 | $39,996 | $44,000 |
| Marketing Director | $39,996 | $39,996 | $44,000 |
| Secretary | $22,800 | $23,500 | $25,000 |
| Secretary 2 | $0 | $22,800 | $23,500 |
| Secretary 3 | $0 | $22,800 | $23,500 |
| Bookkeepter | $0 | $0 | $22,800 |
| Secretary 4 | $0 | $0 | $22,800 |
| Secretary 5 | $0 | $0 | $28,000 |
| CFO | $50,004 | $50,004 | $55,000 |
| Total People | 7 | 9 | 12 |
| Total Payroll | $352,800 | $399,100 | $508,600 |
Financial Plan
We are looking to fund a total package of $836,000 to support our growth plan, management style and vision. This total package has been broken into three phases, which is important to note, since at any time the management may decide that further funding is not necessary.
Our three-year sales projection shown below, profit and loss statement, cash flow analysis and balance sheet herein supports this financial plan.
7.1 Important Assumptions
The table below summarizes key financial assumptions.
| General Assumptions | |||
| Year 1 | Year 2 | Year 3 | |
| Plan Month | 1 | 2 | 3 |
| Current Interest Rate | 10.00% | 10.00% | 10.00% |
| Long-term Interest Rate | 10.00% | 10.00% | 10.00% |
| Tax Rate | 30.00% | 30.00% | 30.00% |
| Other | 0 | 0 | 0 |
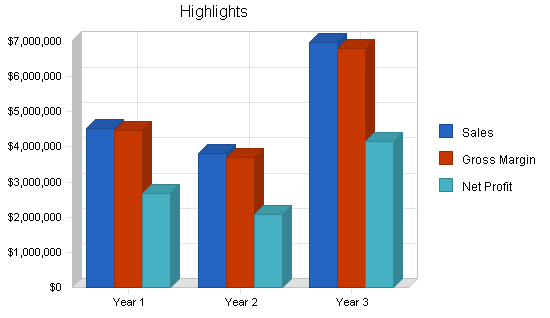
7.2 Key Financial Indicators
The following benchmark chart indicates our key financial indicators for the first three years. We project major growth in sales and operating expenses during times of expansion.

7.3 Break-even Analysis
The table below summarizes the break-even analysis. The break-even analysis has been calculated on the “burn rate” of the company. The company feels that this gives the investor a more accurate picture of the actual risk of the venture.

| Break-even Analysis | |
| Monthly Revenue Break-even | $55,836 |
| Assumptions: | |
| Average Percent Variable Cost | 2% |
| Estimated Monthly Fixed Cost | $54,976 |
7.4 Projected Profit and Loss
The table and charts below summarize the profit and loss for the first three fiscal years.


| Pro Forma Profit and Loss | |||
| Year 1 | Year 2 | Year 3 | |
| Sales | $4,532,000 | $3,814,800 | $6,982,192 |
| Direct Cost of Sales | $69,765 | $112,000 | $169,000 |
| Other Production Expenses | $0 | $0 | $0 |
| Total Cost of Sales | $69,765 | $112,000 | $169,000 |
| Gross Margin | $4,462,235 | $3,702,800 | $6,813,192 |
| Gross Margin % | 98.46% | 97.06% | 97.58% |
| Expenses | |||
| Payroll | $352,800 | $399,100 | $508,600 |
| Sales and Marketing and Other Expenses | $204,000 | $214,000 | $224,000 |
| Depreciation | $0 | $0 | $0 |
| Leased Equipment | $30,000 | $30,000 | $30,000 |
| Utilities | $0 | $0 | $0 |
| Insurance | $0 | $0 | $0 |
| Rent | $19,992 | $20,000 | $20,000 |
| Payroll Taxes | $52,920 | $59,865 | $76,290 |
| Other | $0 | $0 | $0 |
| Total Operating Expenses | $659,712 | $722,965 | $858,890 |
| Profit Before Interest and Taxes | $3,802,523 | $2,979,835 | $5,954,302 |
| EBITDA | $3,802,523 | $2,979,835 | $5,954,302 |
| Interest Expense | $0 | $0 | $0 |
| Taxes Incurred | $1,140,757 | $893,951 | $1,786,291 |
| Net Profit | $2,661,766 | $2,085,885 | $4,168,011 |
| Net Profit/Sales | 58.73% | 54.68% | 59.69% |
7.5 Projected Cash Flow
Cash flow projections are critical to our success. The monthly cash flow is shown in the illustration, with one bar representing cash flow per month and the other representing the monthly balance. The annual cash flow figures are included here on the following table.

| Pro Forma Cash Flow | |||
| Year 1 | Year 2 | Year 3 | |
| Cash Received | |||
| Cash from Operations | |||
| Cash Sales | $4,532,000 | $3,814,800 | $6,982,192 |
| Subtotal Cash from Operations | $4,532,000 | $3,814,800 | $6,982,192 |
| Additional Cash Received | |||
| Sales Tax, VAT, HST/GST Received | $0 | $0 | $0 |
| New Current Borrowing | $0 | $0 | $0 |
| New Other Liabilities (interest-free) | $0 | $0 | $0 |
| New Long-term Liabilities | $0 | $0 | $0 |
| Sales of Other Current Assets | $0 | $0 | $0 |
| Sales of Long-term Assets | $0 | $0 | $0 |
| New Investment Received | $0 | $0 | $0 |
| Subtotal Cash Received | $4,532,000 | $3,814,800 | $6,982,192 |
| Expenditures | Year 1 | Year 2 | Year 3 |
| Expenditures from Operations | |||
| Cash Spending | $352,800 | $399,100 | $508,600 |
| Bill Payments | $1,395,906 | $1,342,043 | $2,225,381 |
| Subtotal Spent on Operations | $1,748,706 | $1,741,143 | $2,733,981 |
| Additional Cash Spent | |||
| Sales Tax, VAT, HST/GST Paid Out | $0 | $0 | $0 |
| Principal Repayment of Current Borrowing | $0 | $0 | $0 |
| Other Liabilities Principal Repayment | $0 | $0 | $0 |
| Long-term Liabilities Principal Repayment | $0 | $0 | $0 |
| Purchase Other Current Assets | $0 | $0 | $0 |
| Purchase Long-term Assets | $0 | $0 | $0 |
| Dividends | $0 | $0 | $0 |
| Subtotal Cash Spent | $1,748,706 | $1,741,143 | $2,733,981 |
| Net Cash Flow | $2,783,294 | $2,073,657 | $4,248,211 |
| Cash Balance | $3,087,294 | $5,160,951 | $9,409,162 |
7.6 Projected Balance Sheet
The balance sheet shows healthy growth of net worth and strong financial position. The monthly estimates are included in the appendix.
| Pro Forma Balance Sheet | |||
| Year 1 | Year 2 | Year 3 | |
| Assets | |||
| Current Assets | |||
| Cash | $3,087,294 | $5,160,951 | $9,409,162 |
| Other Current Assets | $5,000 | $5,000 | $5,000 |
| Total Current Assets | $3,092,294 | $5,165,951 | $9,414,162 |
| Long-term Assets | |||
| Long-term Assets | $0 | $0 | $0 |
| Accumulated Depreciation | $0 | $0 | $0 |
| Total Long-term Assets | $0 | $0 | $0 |
| Total Assets | $3,092,294 | $5,165,951 | $9,414,162 |
| Liabilities and Capital | Year 1 | Year 2 | Year 3 |
| Current Liabilities | |||
| Accounts Payable | $121,528 | $109,300 | $189,500 |
| Current Borrowing | $0 | $0 | $0 |
| Other Current Liabilities | $0 | $0 | $0 |
| Subtotal Current Liabilities | $121,528 | $109,300 | $189,500 |
| Long-term Liabilities | $0 | $0 | $0 |
| Total Liabilities | $121,528 | $109,300 | $189,500 |
| Paid-in Capital | $408,000 | $408,000 | $408,000 |
| Retained Earnings | ($99,000) | $2,562,766 | $4,648,651 |
| Earnings | $2,661,766 | $2,085,885 | $4,168,011 |
| Total Capital | $2,970,766 | $5,056,651 | $9,224,662 |
| Total Liabilities and Capital | $3,092,294 | $5,165,951 | $9,414,162 |
| Net Worth | $2,970,766 | $5,056,651 | $9,224,662 |
7.7 Business Ratios
The following table shows the projected business ratios. We expect to maintain healthy ratios for profitability, risk, and return. Industry profile ratios based on the Standard Industrial Classification (SIC) code 8742, Management Consulting Services, are shown for comparison.
| Ratio Analysis | ||||
| Year 1 | Year 2 | Year 3 | Industry Profile | |
| Sales Growth | 0.00% | -15.83% | 83.03% | 8.60% |
| Percent of Total Assets | ||||
| Other Current Assets | 0.16% | 0.10% | 0.05% | 46.70% |
| Total Current Assets | 100.00% | 100.00% | 100.00% | 74.90% |
| Long-term Assets | 0.00% | 0.00% | 0.00% | 25.10% |
| Total Assets | 100.00% | 100.00% | 100.00% | 100.00% |
| Current Liabilities | 3.93% | 2.12% | 2.01% | 42.80% |
| Long-term Liabilities | 0.00% | 0.00% | 0.00% | 17.20% |
| Total Liabilities | 3.93% | 2.12% | 2.01% | 60.00% |
| Net Worth | 96.07% | 97.88% | 97.99% | 40.00% |
| Percent of Sales | ||||
| Sales | 100.00% | 100.00% | 100.00% | 100.00% |
| Gross Margin | 98.46% | 97.06% | 97.58% | 0.00% |
| Selling, General & Administrative Expenses | 39.73% | 42.39% | 37.88% | 83.50% |
| Advertising Expenses | 1.32% | 1.83% | 1.15% | 1.20% |
| Profit Before Interest and Taxes | 83.90% | 78.11% | 85.28% | 2.60% |
| Main Ratios | ||||
| Current | 25.45 | 47.26 | 49.68 | 1.59 |
| Quick | 25.45 | 47.26 | 49.68 | 1.26 |
| Total Debt to Total Assets | 3.93% | 2.12% | 2.01% | 60.00% |
| Pre-tax Return on Net Worth | 128.00% | 58.93% | 64.55% | 4.40% |
| Pre-tax Return on Assets | 122.97% | 57.68% | 63.25% | 10.90% |
| Additional Ratios | Year 1 | Year 2 | Year 3 | |
| Net Profit Margin | 58.73% | 54.68% | 59.69% | n.a |
| Return on Equity | 89.60% | 41.25% | 45.18% | n.a |
| Activity Ratios | ||||
| Accounts Payable Turnover | 12.49 | 12.17 | 12.17 | n.a |
| Payment Days | 27 | 32 | 24 | n.a |
| Total Asset Turnover | 1.47 | 0.74 | 0.74 | n.a |
| Debt Ratios | ||||
| Debt to Net Worth | 0.04 | 0.02 | 0.02 | n.a |
| Current Liab. to Liab. | 1.00 | 1.00 | 1.00 | n.a |
| Liquidity Ratios | ||||
| Net Working Capital | $2,970,766 | $5,056,651 | $9,224,662 | n.a |
| Interest Coverage | 0.00 | 0.00 | 0.00 | n.a |
| Additional Ratios | ||||
| Assets to Sales | 0.68 | 1.35 | 1.35 | n.a |
| Current Debt/Total Assets | 4% | 2% | 2% | n.a |
| Acid Test | 25.45 | 47.26 | 49.68 | n.a |
| Sales/Net Worth | 1.53 | 0.75 | 0.76 | n.a |
| Dividend Payout | 0.00 | 0.00 | 0.00 | n.a |
Appendix
| Sales Forecast | |||||||||||||
| Month 1 | Month 2 | Month 3 | Month 4 | Month 5 | Month 6 | Month 7 | Month 8 | Month 9 | Month 10 | Month 11 | Month 12 | ||
| Sales | |||||||||||||
| Pharaceutical Companies | 0% | $100,000 | $125,000 | $130,000 | $135,000 | $140,000 | $145,000 | $150,000 | $155,000 | $160,000 | $165,000 | $170,000 | $200,000 |
| Medical Professionals | 0% | $30,000 | $60,000 | $120,000 | $150,000 | $20,000 | $22,000 | $30,000 | $35,000 | $40,000 | $50,000 | $70,000 | $90,000 |
| Bio-Tech | 0% | $30,000 | $30,000 | $30,000 | $30,000 | $30,000 | $30,000 | $300,000 | $300,000 | $300,000 | $300,000 | $30,000 | $30,000 |
| Medical Devices | 0% | $50,000 | $50,000 | $50,000 | $50,000 | $50,000 | $50,000 | $50,000 | $50,000 | $50,000 | $50,000 | $50,000 | $50,000 |
| Other | 0% | $0 | $0 | $0 | $0 | $0 | $0 | $0 | $0 | $0 | $0 | $0 | $0 |
| Total Sales | $210,000 | $265,000 | $330,000 | $365,000 | $240,000 | $247,000 | $530,000 | $540,000 | $550,000 | $565,000 | $320,000 | $370,000 | |
| Direct Cost of Sales | Month 1 | Month 2 | Month 3 | Month 4 | Month 5 | Month 6 | Month 7 | Month 8 | Month 9 | Month 10 | Month 11 | Month 12 | |
| Pharaceutical Companies | $150 | $100 | $100 | $120 | $300 | $500 | $700 | $900 | $1,200 | $1,500 | $1,700 | $1,900 | |
| Medical Professionals | $150 | $150 | $150 | $150 | $150 | $160 | $160 | $175 | $200 | $250 | $250 | $450 | |
| Bio-Tech | $400 | $400 | $800 | $900 | $1,000 | $1,300 | $15,000 | $2,000 | $2,500 | $3,000 | $3,200 | $3,700 | |
| Medical Devices | $2,000 | $2,000 | $2,000 | $2,000 | $2,000 | $2,000 | $2,000 | $2,000 | $2,000 | $2,000 | $2,000 | $2,000 | |
| Other | $0 | $0 | $0 | $0 | $0 | $0 | $0 | $0 | $0 | $0 | $0 | $0 | |
| Subtotal Direct Cost of Sales | $2,700 | $2,650 | $3,050 | $3,170 | $3,450 | $3,960 | $17,860 | $5,075 | $5,900 | $6,750 | $7,150 | $8,050 | |
| Personnel Plan | |||||||||||||
| Month 1 | Month 2 | Month 3 | Month 4 | Month 5 | Month 6 | Month 7 | Month 8 | Month 9 | Month 10 | Month 11 | Month 12 | ||
| Dr. Wu | 0% | $6,250 | $6,250 | $6,250 | $6,250 | $6,250 | $6,250 | $6,250 | $6,250 | $6,250 | $6,250 | $6,250 | $6,250 |
| Dr. Rayder | 0% | $6,250 | $6,250 | $6,250 | $6,250 | $6,250 | $6,250 | $6,250 | $6,250 | $6,250 | $6,250 | $6,250 | $6,250 |
| CEO | 0% | $4,167 | $4,167 | $4,167 | $4,167 | $4,167 | $4,167 | $4,167 | $4,167 | $4,167 | $4,167 | $4,167 | $4,167 |
| IT Director | 0% | $3,333 | $3,333 | $3,333 | $3,333 | $3,333 | $3,333 | $3,333 | $3,333 | $3,333 | $3,333 | $3,333 | $3,333 |
| Marketing Director | 0% | $3,333 | $3,333 | $3,333 | $3,333 | $3,333 | $3,333 | $3,333 | $3,333 | $3,333 | $3,333 | $3,333 | $3,333 |
| Secretary | 0% | $1,900 | $1,900 | $1,900 | $1,900 | $1,900 | $1,900 | $1,900 | $1,900 | $1,900 | $1,900 | $1,900 | $1,900 |
| Secretary 2 | 0% | $0 | $0 | $0 | $0 | $0 | $0 | $0 | $0 | $0 | $0 | $0 | $0 |
| Secretary 3 | 0% | $0 | $0 | $0 | $0 | $0 | $0 | $0 | $0 | $0 | $0 | $0 | $0 |
| Bookkeepter | 0% | $0 | $0 | $0 | $0 | $0 | $0 | $0 | $0 | $0 | $0 | $0 | $0 |
| Secretary 4 | 0% | $0 | $0 | $0 | $0 | $0 | $0 | $0 | $0 | $0 | $0 | $0 | $0 |
| Secretary 5 | 0% | $0 | $0 | $0 | $0 | $0 | $0 | $0 | $0 | $0 | $0 | $0 | $0 |
| CFO | 0% | $4,167 | $4,167 | $4,167 | $4,167 | $4,167 | $4,167 | $4,167 | $4,167 | $4,167 | $4,167 | $4,167 | $4,167 |
| Total People | 7 | 7 | 7 | 7 | 7 | 7 | 7 | 7 | 7 | 7 | 7 | 7 | |
| Total Payroll | $29,400 | $29,400 | $29,400 | $29,400 | $29,400 | $29,400 | $29,400 | $29,400 | $29,400 | $29,400 | $29,400 | $29,400 | |
| General Assumptions | |||||||||||||
| Month 1 | Month 2 | Month 3 | Month 4 | Month 5 | Month 6 | Month 7 | Month 8 | Month 9 | Month 10 | Month 11 | Month 12 | ||
| Plan Month | 1 | 2 | 3 | 4 | 5 | 6 | 7 | 8 | 9 | 10 | 11 | 12 | |
| Current Interest Rate | 10.00% | 10.00% | 10.00% | 10.00% | 10.00% | 10.00% | 10.00% | 10.00% | 10.00% | 10.00% | 10.00% | 10.00% | |
| Long-term Interest Rate | 10.00% | 10.00% | 10.00% | 10.00% | 10.00% | 10.00% | 10.00% | 10.00% | 10.00% | 10.00% | 10.00% | 10.00% | |
| Tax Rate | 30.00% | 30.00% | 30.00% | 30.00% | 30.00% | 30.00% | 30.00% | 30.00% | 30.00% | 30.00% | 30.00% | 30.00% | |
| Other | 0 | 0 | 0 | 0 | 0 | 0 | 0 | 0 | 0 | 0 | 0 | 0 | |
| Pro Forma Profit and Loss | |||||||||||||
| Month 1 | Month 2 | Month 3 | Month 4 | Month 5 | Month 6 | Month 7 | Month 8 | Month 9 | Month 10 | Month 11 | Month 12 | ||
| Sales | $210,000 | $265,000 | $330,000 | $365,000 | $240,000 | $247,000 | $530,000 | $540,000 | $550,000 | $565,000 | $320,000 | $370,000 | |
| Direct Cost of Sales | $2,700 | $2,650 | $3,050 | $3,170 | $3,450 | $3,960 | $17,860 | $5,075 | $5,900 | $6,750 | $7,150 | $8,050 | |
| Other Production Expenses | $0 | $0 | $0 | $0 | $0 | $0 | $0 | $0 | $0 | $0 | $0 | $0 | |
| Total Cost of Sales | $2,700 | $2,650 | $3,050 | $3,170 | $3,450 | $3,960 | $17,860 | $5,075 | $5,900 | $6,750 | $7,150 | $8,050 | |
| Gross Margin | $207,300 | $262,350 | $326,950 | $361,830 | $236,550 | $243,040 | $512,140 | $534,925 | $544,100 | $558,250 | $312,850 | $361,950 | |
| Gross Margin % | 98.71% | 99.00% | 99.08% | 99.13% | 98.56% | 98.40% | 96.63% | 99.06% | 98.93% | 98.81% | 97.77% | 97.82% | |
| Expenses | |||||||||||||
| Payroll | $29,400 | $29,400 | $29,400 | $29,400 | $29,400 | $29,400 | $29,400 | $29,400 | $29,400 | $29,400 | $29,400 | $29,400 | |
| Sales and Marketing and Other Expenses | $17,000 | $17,000 | $17,000 | $17,000 | $17,000 | $17,000 | $17,000 | $17,000 | $17,000 | $17,000 | $17,000 | $17,000 | |
| Depreciation | $0 | $0 | $0 | $0 | $0 | $0 | $0 | $0 | $0 | $0 | $0 | $0 | |
| Leased Equipment | $2,500 | $2,500 | $2,500 | $2,500 | $2,500 | $2,500 | $2,500 | $2,500 | $2,500 | $2,500 | $2,500 | $2,500 | |
| Utilities | $0 | $0 | $0 | $0 | $0 | $0 | $0 | $0 | $0 | $0 | $0 | $0 | |
| Insurance | $0 | $0 | $0 | $0 | $0 | $0 | $0 | $0 | $0 | $0 | $0 | $0 | |
| Rent | $1,666 | $1,666 | $1,666 | $1,666 | $1,666 | $1,666 | $1,666 | $1,666 | $1,666 | $1,666 | $1,666 | $1,666 | |
| Payroll Taxes | 15% | $4,410 | $4,410 | $4,410 | $4,410 | $4,410 | $4,410 | $4,410 | $4,410 | $4,410 | $4,410 | $4,410 | $4,410 |
| Other | $0 | $0 | $0 | $0 | $0 | $0 | $0 | $0 | $0 | $0 | $0 | $0 | |
| Total Operating Expenses | $54,976 | $54,976 | $54,976 | $54,976 | $54,976 | $54,976 | $54,976 | $54,976 | $54,976 | $54,976 | $54,976 | $54,976 | |
| Profit Before Interest and Taxes | $152,324 | $207,374 | $271,974 | $306,854 | $181,574 | $188,064 | $457,164 | $479,949 | $489,124 | $503,274 | $257,874 | $306,974 | |
| EBITDA | $152,324 | $207,374 | $271,974 | $306,854 | $181,574 | $188,064 | $457,164 | $479,949 | $489,124 | $503,274 | $257,874 | $306,974 | |
| Interest Expense | $0 | $0 | $0 | $0 | $0 | $0 | $0 | $0 | $0 | $0 | $0 | $0 | |
| Taxes Incurred | $45,697 | $62,212 | $81,592 | $92,056 | $54,472 | $56,419 | $137,149 | $143,985 | $146,737 | $150,982 | $77,362 | $92,092 | |
| Net Profit | $106,627 | $145,162 | $190,382 | $214,798 | $127,102 | $131,645 | $320,015 | $335,964 | $342,387 | $352,292 | $180,512 | $214,882 | |
| Net Profit/Sales | 50.77% | 54.78% | 57.69% | 58.85% | 52.96% | 53.30% | 60.38% | 62.22% | 62.25% | 62.35% | 56.41% | 58.08% | |
| Pro Forma Cash Flow | |||||||||||||
| Month 1 | Month 2 | Month 3 | Month 4 | Month 5 | Month 6 | Month 7 | Month 8 | Month 9 | Month 10 | Month 11 | Month 12 | ||
| Cash Received | |||||||||||||
| Cash from Operations | |||||||||||||
| Cash Sales | $210,000 | $265,000 | $330,000 | $365,000 | $240,000 | $247,000 | $530,000 | $540,000 | $550,000 | $565,000 | $320,000 | $370,000 | |
| Subtotal Cash from Operations | $210,000 | $265,000 | $330,000 | $365,000 | $240,000 | $247,000 | $530,000 | $540,000 | $550,000 | $565,000 | $320,000 | $370,000 | |
| Additional Cash Received | |||||||||||||
| Sales Tax, VAT, HST/GST Received | 0.00% | $0 | $0 | $0 | $0 | $0 | $0 | $0 | $0 | $0 | $0 | $0 | $0 |
| New Current Borrowing | $0 | $0 | $0 | $0 | $0 | $0 | $0 | $0 | $0 | $0 | $0 | $0 | |
| New Other Liabilities (interest-free) | $0 | $0 | $0 | $0 | $0 | $0 | $0 | $0 | $0 | $0 | $0 | $0 | |
| New Long-term Liabilities | $0 | $0 | $0 | $0 | $0 | $0 | $0 | $0 | $0 | $0 | $0 | $0 | |
| Sales of Other Current Assets | $0 | $0 | $0 | $0 | $0 | $0 | $0 | $0 | $0 | $0 | $0 | $0 | |
| Sales of Long-term Assets | $0 | $0 | $0 | $0 | $0 | $0 | $0 | $0 | $0 | $0 | $0 | $0 | |
| New Investment Received | $0 | $0 | $0 | $0 | $0 | $0 | $0 | $0 | $0 | $0 | $0 | $0 | |
| Subtotal Cash Received | $210,000 | $265,000 | $330,000 | $365,000 | $240,000 | $247,000 | $530,000 | $540,000 | $550,000 | $565,000 | $320,000 | $370,000 | |
| Expenditures | Month 1 | Month 2 | Month 3 | Month 4 | Month 5 | Month 6 | Month 7 | Month 8 | Month 9 | Month 10 | Month 11 | Month 12 | |
| Expenditures from Operations | |||||||||||||
| Cash Spending | $29,400 | $29,400 | $29,400 | $29,400 | $29,400 | $29,400 | $29,400 | $29,400 | $29,400 | $29,400 | $29,400 | $29,400 | |
| Bill Payments | $2,466 | $74,522 | $91,098 | $110,571 | $119,559 | $83,580 | $89,110 | $180,387 | $174,755 | $178,383 | $180,868 | $110,609 | |
| Subtotal Spent on Operations | $31,866 | $103,922 | $120,498 | $139,971 | $148,959 | $112,980 | $118,510 | $209,787 | $204,155 | $207,783 | $210,268 | $140,009 | |
| Additional Cash Spent | |||||||||||||
| Sales Tax, VAT, HST/GST Paid Out | $0 | $0 | $0 | $0 | $0 | $0 | $0 | $0 | $0 | $0 | $0 | $0 | |
| Principal Repayment of Current Borrowing | $0 | $0 | $0 | $0 | $0 | $0 | $0 | $0 | $0 | $0 | $0 | $0 | |
| Other Liabilities Principal Repayment | $0 | $0 | $0 | $0 | $0 | $0 | $0 | $0 | $0 | $0 | $0 | $0 | |
| Long-term Liabilities Principal Repayment | $0 | $0 | $0 | $0 | $0 | $0 | $0 | $0 | $0 | $0 | $0 | $0 | |
| Purchase Other Current Assets | $0 | $0 | $0 | $0 | $0 | $0 | $0 | $0 | $0 | $0 | $0 | $0 | |
| Purchase Long-term Assets | $0 | $0 | $0 | $0 | $0 | $0 | $0 | $0 | $0 | $0 | $0 | $0 | |
| Dividends | $0 | $0 | $0 | $0 | $0 | $0 | $0 | $0 | $0 | $0 | $0 | $0 | |
| Subtotal Cash Spent | $31,866 | $103,922 | $120,498 | $139,971 | $148,959 | $112,980 | $118,510 | $209,787 | $204,155 | $207,783 | $210,268 | $140,009 | |
| Net Cash Flow | $178,134 | $161,078 | $209,502 | $225,029 | $91,041 | $134,020 | $411,490 | $330,213 | $345,845 | $357,217 | $109,732 | $229,991 | |
| Cash Balance | $482,134 | $643,212 | $852,715 | $1,077,744 | $1,168,785 | $1,302,805 | $1,714,295 | $2,044,508 | $2,390,353 | $2,747,570 | $2,857,303 | $3,087,294 | |
| Pro Forma Balance Sheet | |||||||||||||
| Month 1 | Month 2 | Month 3 | Month 4 | Month 5 | Month 6 | Month 7 | Month 8 | Month 9 | Month 10 | Month 11 | Month 12 | ||
| Assets | Starting Balances | ||||||||||||
| Current Assets | |||||||||||||
| Cash | $304,000 | $482,134 | $643,212 | $852,715 | $1,077,744 | $1,168,785 | $1,302,805 | $1,714,295 | $2,044,508 | $2,390,353 | $2,747,570 | $2,857,303 | $3,087,294 |
| Other Current Assets | $5,000 | $5,000 | $5,000 | $5,000 | $5,000 | $5,000 | $5,000 | $5,000 | $5,000 | $5,000 | $5,000 | $5,000 | $5,000 |
| Total Current Assets | $309,000 | $487,134 | $648,212 | $857,715 | $1,082,744 | $1,173,785 | $1,307,805 | $1,719,295 | $2,049,508 | $2,395,353 | $2,752,570 | $2,862,303 | $3,092,294 |
| Long-term Assets | |||||||||||||
| Long-term Assets | $0 | $0 | $0 | $0 | $0 | $0 | $0 | $0 | $0 | $0 | $0 | $0 | $0 |
| Accumulated Depreciation | $0 | $0 | $0 | $0 | $0 | $0 | $0 | $0 | $0 | $0 | $0 | $0 | $0 |
| Total Long-term Assets | $0 | $0 | $0 | $0 | $0 | $0 | $0 | $0 | $0 | $0 | $0 | $0 | $0 |
| Total Assets | $309,000 | $487,134 | $648,212 | $857,715 | $1,082,744 | $1,173,785 | $1,307,805 | $1,719,295 | $2,049,508 | $2,395,353 | $2,752,570 | $2,862,303 | $3,092,294 |
| Liabilities and Capital | Month 1 | Month 2 | Month 3 | Month 4 | Month 5 | Month 6 | Month 7 | Month 8 | Month 9 | Month 10 | Month 11 | Month 12 | |
| Current Liabilities | |||||||||||||
| Accounts Payable | $0 | $71,507 | $87,424 | $106,544 | $116,775 | $80,715 | $83,090 | $174,566 | $168,815 | $172,273 | $177,198 | $106,419 | $121,528 |
| Current Borrowing | $0 | $0 | $0 | $0 | $0 | $0 | $0 | $0 | $0 | $0 | $0 | $0 | $0 |
| Other Current Liabilities | $0 | $0 | $0 | $0 | $0 | $0 | $0 | $0 | $0 | $0 | $0 | $0 | $0 |
| Subtotal Current Liabilities | $0 | $71,507 | $87,424 | $106,544 | $116,775 | $80,715 | $83,090 | $174,566 | $168,815 | $172,273 | $177,198 | $106,419 | $121,528 |
| Long-term Liabilities | $0 | $0 | $0 | $0 | $0 | $0 | $0 | $0 | $0 | $0 | $0 | $0 | $0 |
| Total Liabilities | $0 | $71,507 | $87,424 | $106,544 | $116,775 | $80,715 | $83,090 | $174,566 | $168,815 | $172,273 | $177,198 | $106,419 | $121,528 |
| Paid-in Capital | $408,000 | $408,000 | $408,000 | $408,000 | $408,000 | $408,000 | $408,000 | $408,000 | $408,000 | $408,000 | $408,000 | $408,000 | $408,000 |
| Retained Earnings | ($99,000) | ($99,000) | ($99,000) | ($99,000) | ($99,000) | ($99,000) | ($99,000) | ($99,000) | ($99,000) | ($99,000) | ($99,000) | ($99,000) | ($99,000) |
| Earnings | $0 | $106,627 | $251,789 | $442,170 | $656,968 | $784,070 | $915,715 | $1,235,730 | $1,571,694 | $1,914,081 | $2,266,373 | $2,446,884 | $2,661,766 |
| Total Capital | $309,000 | $415,627 | $560,789 | $751,170 | $965,968 | $1,093,070 | $1,224,715 | $1,544,730 | $1,880,694 | $2,223,081 | $2,575,373 | $2,755,884 | $2,970,766 |
| Total Liabilities and Capital | $309,000 | $487,134 | $648,212 | $857,715 | $1,082,744 | $1,173,785 | $1,307,805 | $1,719,295 | $2,049,508 | $2,395,353 | $2,752,570 | $2,862,303 | $3,092,294 |
| Net Worth | $309,000 | $415,627 | $560,789 | $751,170 | $965,968 | $1,093,070 | $1,224,715 | $1,544,730 | $1,880,694 | $2,223,081 | $2,575,373 | $2,755,884 | $2,970,766 |

