
Zenergy Medical Industries
Executive Summary
This business plan has been developed to present our company to prospective supplier partners, employers, and investors. Zenergy Medical Industries is a start-up company focused initially on distribution of leading brands of therapeutic systems for use by residents of Homecare and Assisted Living facilities at risk of complications from X disease. After establishing a market presence with this product niche, we will expand to offer other products related to further treating and managing complications of the disease.
The market is currently served poorly and inconsistently by a patchwork of local pharmacies and distributors. We will offer a regional, and ultimately national, network of clinical sales professionals, which will make us the partner of choice for large, geographically diverse Homecare and Assisted Living (A.L.) chains, and will make us attractive to potential supplier partners.
Market Potential
The two major market opportunities are “at risk” residents with the disease in Homecare and Assisted Living. There are an estimated 345,784 Homecare at risk residents, with a potential $59.6 million revenue, and an estimated 66,671 Assisted Living at risk residents, with a potential for $17.6 million in revenue.
Competitive Advantage
The product technology is available to all players in this market. We will differentiate ourselves by adding value through our distribution strategy and channels, and our comprehensive product lines and programs that make working with us incredibly easy. We are uniquely positioned to gain market share in this segment due to our corporate account relationships, our ability to build a regional (ultimately national) field clinical sales team quickly, and our ability to create compelling marketing programs. The competition is largely smaller, more local distributors and pharmacists who are not approaching this market in a sophisticated or coordinated way.
Strategy
- Using relationships with decision makers at major homecare chains to gain unique access to sell into their facilities. This will allow us to provide “pre-qualified” sales opportunities to our field-based clinical sales team.
- Effectively building a strong national clinical sales team capable of building strong relationships with clinical decision makers at the facility level.
- Creating marketing strategies and tactics to position ourselves as leaders in providing clinical product solutions to help facilities manage the complications of disease.
- Gaining distribution relationships with a unique combination of top suppliers to build a comprehensive line of product solutions for managing the complications of the disease. We will create an effective channel of distribution that will be indispensable to suppliers as a cost effective way for them to penetrate the post-acute market.
We will utilize the therapeutic system offering as the means to gain entrance into the market and build our organization. Then we will add complimentary products for managing complications of the disease, followed by other products related to managing complications of heart disease and aging.
Financial Summary
The owners will invest personal savings in the business. We are seeking an additional short-term (3 year) loans, to supplement initial cash flows from sales for the first year. We anticipate a first year net profit. This should grow substantialy by year three. By the end of year three, Zenergy Medical Industries will have a very respectable net worth.
Objectives
- To achieve the sales growth targets by month six and by end of year one. Aggressive gains in market share and average monthly revenues in year two.
- To grow the contracted sales team to seven field clinical sales reps by month eight and to 25 field clinical sales reps by year three.
- To achieve net profit in year one, increasing in year two, by containing costs and meeting sales goals.
- To begin paying Vice Presidents a regular salary starting in year two.
- To maintain 90 day customer satisfaction survey results (% who would definitely repurchase and definitely recommend us) at 98% or higher.
Mission
We provide post-acute-care facilities with product solutions to help manage complications of X disease. We take pride in helping to alleviate patient suffering associated with these conditions.
Keys to Success
- We offer a comprehensive line of innovative, top quality products.
- We provided unequaled clinical support on a regional (national) level to post acute facilities.
- We have close relationships with key decision makers in top post acute chains, and with key administrators and clinicians at the facility level.
- We do an exceptional job of articulating the value of our products and solutions.We position ourselves in a clear, powerful, and memorable way in the marketplace.
- We have an organization with a unique spirit that makes people eager to join us or do business with us. Once people join us, they can’t imagine working anywhere else.

Company Summary
Zenergy Medical Industries will be seen by post-acute-care providers as THE source for product solutions to manage the complications of X disease.
We are a start-up company that will initially distribute a full line of disease therapies and medications, followed by additional complimentary products that fit with our strategy. Zenergy Medical Industries’ headquarters will be in Charleston, S.C.
Our source of differentiation will be in our distribution and marketing strategies. We will leverage our corporate account relationships and create marketing programs to drive demand for our products solutions at the corporate level. We will establish a unique network of clinical sales professionals, first in the Southeast, then nationwide, who will then build relationships at the facility level by providing value-added service and expertise to caregivers.
Regulatory Issues
As distributors, our only relevant compliance issues are to stay in compliance with CMS’s supplier standards as regulated by the DMERCs and to stay in compliance with HIPAA regulations regarding patient data.
Company Ownership
Zenergy Medical Industries is a division of Finkelstein and Acropolis, LLC., which is equally owned by Acropolis, Finkelstein, and Aktum.
Capital for start-up costs will be provided out of private funds from Acropolis, Finkelstein, and Aktum. Zenergy Medical Industries will also seek an SBA Micro-Loan to supplement the private funding provided by the three managing executives.
Start-up Summary
The key elements in the start-up plan for the company are:
- Create the strategic business plan.
- Establish a corporate identity and positioning strategy.
- Establish a location and place of doing business.
- Obtain a Medicare provider number.
- Build a field clinical sales organization focused initially on the Southern U.S.
- Define key business processes for ordering, billing, reimbursement, record keeping, customer satisfaction tracking, etc.
- Build relationships with key decision makers in targeted Homecare and Assisted Living chains.
- Costs of raising capital through private placement.
More specifically, start-up requirements include the following:
- Legal fees to draw up employment agreements and various company legal documents.
- Office supplies and stationery to purchase business cards and stationery with the new company’s information; this is also intended to cover basic office supplies (pens, paper, calculators, files, etc.)
- Initial cost to obtain appropriate general liability insurance policy of $300K on our facility.
- Rent (1 month rent and 1 month deposit @ $450 per month).
- Office equipment lease – computer, printer/copier/scanner/fax machine.
- Telecommunications – Cost of DSL internet connection, phone line listed under company name in directory assistance; purchase of phone.
- Accounting – For 7-8 hours to get our bookkeeping processes in place (accounts payable to suppliers, lessors, etc., accounts receivable from Medicare and patient co-pay, commission payout system, basic journal entry system for recording orders, collections, etc.
- Surety bond – per National Supplier Clearinghouse Customer Service Group, this requirement has been waived (verified with Kimberly on 2/8/05, and Bonnie on 2/9/05).
- Marketing Materials – Purchase desktop brochure software and brochure quality paper, secure marketing materials from manufacturers, create a basic website, license use of any research articles, and create our own flyers and brochures for corporate account use, facility use, and use to recruit sales people.
- Other – Unanticipated expenses.
- Start-up assets – Working capital; product inventory; office furniture (file cabinet, desk, book shelf).


| Start-up | |
| Requirements | |
| Start-up Expenses | |
| Legal | $500 |
| Stationery and Office Supplies | $250 |
| Liability Insurance | $60 |
| Rent | $900 |
| Office Equipment Leases | $125 |
| Telecommunications | $320 |
| Accounting | $150 |
| Surety Bond | $0 |
| Marketing Materials | $500 |
| Travel | $0 |
| Other | $500 |
| Total Start-up Expenses | $3,305 |
| Start-up Assets | |
| Cash Required | $9,500 |
| Start-up Inventory | $2,500 |
| Other Current Assets | $275 |
| Long-term Assets | $0 |
| Total Assets | $12,275 |
| Total Requirements | $15,580 |
Products
Zenergy Medical Industries sells disease therapy systems for use by homecare and assisted living residents who have been diagnosed with an ICD-9 code of X disease.
At no additional charge to the resident, we provide value-added services like initial consultations, management of all paperwork for order placement, billing and reimbursement, training on the system upon delivery, and management of annual reorder processes.
Over time, we will contract with leading suppliers to distribute additional complimentary products for managing the complications of the disease.
Market Analysis Summary
Our primary customers are elderly residents living in homecare or post-acute care facilities and at risk for complications from X disease. These residents can be divided into two major markets: homecare residents, and assisted living residents, and they fit in one of three broad payor classifications for the costs of their stay: Medicare, Private Pay, or Medicaid.
A profile of the homecare market today:
- There are 16,121 facilities with 1,683,068 patients.
- Average utilization rate is 85.6%, which translates to an average of 1,440,768 patients.
- Disease prevalence is estimated at 18% in the general population of people over the age of 60. One Medicare survey estimated the prevalence within homecare at 24%. In the overall population it is generally estimated that diagnosed cases of the disease represent only about 70% of the true total number of these patients in the country, so these are probably conservative numbers.
- About 12% of residents are covered by Medicare, another 20% by private sources (family, personal assets, private insurance, managed care); the remaining 68% are covered under Medicaid.
- 60-70% of these patients suffer from related symptoms, which places them at higher risk for complications (ulcers, other problems, etc.).
- 15-25% of these patients will suffer from complications during their lifetime.
- 86,000 surgeries occur per year; an estimated 50% of these are considered preventable. The cost of managing these complications has been estimated at anywhere from $2000-$13,500 per year and up to $27,000 overall for the two years following surgery.
Based on these statistics, the market size is estimated as follows:
| Homecare “At Risk” Segment | – |
| total # of Homecare residents | 1,440,768 |
| X Homecare disease prevalence rate | 24% |
| # of these patients in payor category | 345,784 |
| X % with related symptoms | 65% |
| # of at risk these patients in Homecare market | 224,760 |
| X reimbursement per year | $264.04 |
| Homecare Revenue potential | $59,345,524 |
A profile of the Assisted Living market today:
- There are 32,886 facilities with 987,000 beds.
- Average occupancy rate is 80%, which translates to an average of 789,000 residents.
- Disease prevalence is estimated at 18% in the general population of people over the age of 60. One Assisted Living survey estimated the prevalence within Assisted Living facilities at 13%. In the overall population it is generally estimated that diagnosed cases of disease represent only about 70% of the true total number of these patients in the country, so these are probably conservative numbers.
- About 91% of residents are covered private sources (family, personal assets, private insurance, managed care); the remaining 9% are covered under Medicaid.
- 60-70% of these patients suffer from related symptoms, which places them at higher risk for complications.
- 15-25% of these patients will suffer from complications during their lifetime.
- 86,000 surgeries occur per year; an estimated 50% of these are considered preventable. The cost of managing these complications has been estimated at anywhere from $2000-$13,500 per year and up to $27,000 overall for the two years following surgery.
Based on these statistics, the market size is estimated as follows:
| AL “At Risk” Segment | – |
| total # of AL residents | 789,000 |
| X AL disease prevalence rate | 13% |
| # of these patients in payor category | 102,570 |
| X % with related symptoms | 65% |
| # of at risk these patients in AL market | 66,671 |
| X reimbursement per year | $264.04 |
| AL Revenue potential | $17,603,678 |
Elderly and diseased growth projections:
Between 2002 and 2020 it is projected that the overall population with the disease will grow 44% driven by increased heart disease, an aging population, and above average growth in segments of the population considered most at risk (African American and Hispanic).
The Homecare and AL markets will continue to grow due to continued growth in the elderly population (65+), which is projected by the Census Bureau to grow from 34.7 million in 2000 to 53.2 million by 2020, a total increase of 53%.
During that same period, the total number of elderly patients with the disease is projected to grow from 4.6 million to 10.6 million, a total increase of 130%.
All of these dynamics will drive demand for products to manage complications of disease.
Market Segmentation
Our three highest priority target markets will be:
- “At risk” residents in Homecare chains.
- “At risk” residents in AL chains.
With Homecare and AL chains, we can leverage our relationships at the corporate office level to more efficiently gain access to the member facilities.
| Homecare – top 50 chains | – |
| total # of Homecare residents | 375,000 |
| X disease prevalence rate | 24% |
| # of these patients in Homecare top 50 chains | 90,000 |
| X % with related symptoms | 65% |
| # of at risk patients in Homecare top 50 chains | 58,500 |
| X reimbursement per year | $264.04 |
| Homecare Revenue potential | $15,446,340 |
| Assisted Living – top 30 chains | – |
| total # of AL residents | 167,700 |
| X disease prevalence rate | 13% |
| # of these patients in AL top 30 chains | 21,801 |
| X % with related symptoms | 65% |
| # of at risk patients in AL top 30 chains | 14,171 |
| X reimbursement per year | $264.04 |
| Assisted Living Revenue potential | $3,741,618 |

| Market Analysis | |||||||
| Year 1 | Year 2 | Year 3 | Year 4 | Year 5 | |||
| Potential Customers | Growth | CAGR | |||||
| LTC at risk | 2% | 224,760 | 229,255 | 233,840 | 238,517 | 243,287 | 2.00% |
| AL at risk | 4% | 66,671 | 69,338 | 72,112 | 74,996 | 77,996 | 4.00% |
| Total | 2.47% | 291,431 | 298,593 | 305,952 | 313,513 | 321,283 | 2.47% |
Target Market Segment Strategy
Geographically, we will focus on facilities located in the Southern U.S. that fit within our two top priority segments.
Our model will be to leverage our relationships with these chains to get easier and faster access at the facility level for our field clinical sales team. This should allow us to achieve economies in marketing, promotions, and sales costs, and should allow our field sales team to be more efficient in working only with highly qualified facilities.
The Southern U.S. DMERC Region C will be our geographic focus because the prevalence rates for the disease tend to be higher in the Southern U.S. (5 of the top 10 states, ranked in order of prevalence rates, are in the Southern U.S.) and there tends to be a high number of chain facilities located in this region.
We will begin by targeting Homecare and A.L. chains with the majority of their facilities located in Tennessee, North Carolina, South Carolina, Alabama, Georgia, and Florida in year one, then we will expand further into Virginia, Louisiana, Mississippi, Oklahoma, and Texas in years two and three. In years three and four we will expand across the country into other DMERC regions to create a national presence. Of course, our field reps will also call on non-chain accounts within their territories where opportunities arise, but our strategic focus will be on trying to leverage corporate account relationships to open doors at the facility level for the field reps.
Demographic trends indicate that the larger African American and Hispanic populations in this region will cause prevalence rates to continue to grow at above average rates over the next 20 years.
Industry Analysis
Our industry is Durable Medical Equipment, Prosthetics, Orthotics, and Supplies (DMEPOS), focusing on the elder care markets.
The elder care market will be impacted by conflicting sets of dynamics. Consumer preference, payor desire for lower costs, and advances in pharmaceuticals, non-invasive surgery, assistive devices, telemedicine, and remote monitoring will continue to allow more elderly patients to be cared for in their homes. However, the continued growth in the elderly population and continued increase in heart disease, disease, Alzheimer’s, and associated disease states will force an older and sicker resident population into institutional settings due to the intensity of care required to manage these disease states.
The net effect is difficult to predict, but it would appear likely that Homecare census will remain flat or experience slight growth (1-3% per year), while Assisted Living will likely continue to experience slightly stronger growth (3-5% per year).
HIDA estimates that the Durable Medical Equipment (DME) market’s revenue has grown 4-5% per year from 2002-2004; while total national spending on Elder care grew approximately 5% per year during that period. HIDA also estimated that total distributed medical product sales from 2001-2003 grew approximately 5% per year.
These revenue growth rates may decelerate somewhat over the next several years as the industry struggles to find ways to control costs, so we conservatively estimate that growth rates in the DME institutional elder care market will probably be in the 3% per year range.
Competition and Buying Patterns
The market is currently served inconsistently and, in some areas poorly, by a variety of players including pharmacies, DME manufacturers, rehab facilities and therapists, and local dealers/distributors who lack a national presence, a clear marketing strategy, and the ability to leverage corporate chain relationships. Their field sales team mainly functions as order takers, going out and visiting facilities, targeting only residents they believe are covered under Medicare part B or an equivalent private pay coverage, then submitting orders for these residents.
Our growth will not come entirely from overall market growth, but also from taking market share away from our competitors. The market is very fragmented; CMS estimates that 95% of DMEs generate less than $350,000 per year in annual billings and 99% generate less than $5 million. We will grow in part due to the underlying trends specific to growth in disease prevalence, but also by consolidating a fragmented market by creating a regional (then a national) clinical sales channel that provides a source of competitive advantage.
One study in 1995 indicated that utilization of the Medicare therapeutic disease benefit was extremely low and could be boosted substantially via the use of a coordinated marketing approach. We believe that the combination of market dynamics along with our sales and marketing approach should allow us to grow revenue in this market rapidly over the next three years.
Currently, residents may elect to purchase therapeutic disease systems for several different reasons:
- A medical exam may prompt the resident’s physician to prescribe therapeutic systems.
- A local DME, dealer, or distributor may recommend therapeutic systems for a resident with Medicare coverage.
- The resident may be prompted to purchase therapeutic systems after receiving a direct mail piece, viewing a television advertisement, viewing a brochure, or through word-of-mouth.
- A disease-related complication may prompt them to purchase therapeutic systems.
Currently, no one effectively approaches this market on a regional or national level with the type of strategy that we have outlined in this plan.
Strategy and Implementation Summary
The key element in our strategy is to market to Homecare and Assisted Living corporate account chains in the Southeast, where we are likely to see the highest level of arthritic residents covered under Medicare Part B. We will create a program that offers a solution to improve disease care at no cost and minimal time commitment to the corporate office or the individual facilities.
To do this we will leverage our corporate account relationships to open the door, and use our marketing expertise to build a compelling program. This will allow our field sales team to be much more efficient in prospecting, improving their “hit ratio” on each facility visit.
We will grow to seven experienced clinical reps in year one, and expand to 25 by year three. We will be unique in that we will have a large scale team of contracted clinical pros in the field, making us attractive to chains who can use us as their one source for products supporting the complications of X disease. At the same time we will develop streamlined internal processes to maximize cash flow through fast reimbursement, and we will develop supplier relationships with manufacturers of other products that are a good strategic fit.
The therapeutic system product line will be our initial entry into this market, then we will leverage the market presence this gives us to expand to other complimentary products for managing complications of the disease.
Competitive Edge
Through our combined 50 years of healthcare industry sales and marketing experience, we have built industry relationships and networks that we will leverage to build our business. Our competitive edge lies in four major areas:
- Our relationships with decision makers at homecare chains.
- Our ability to effectively build a strong national clinical sales team.
- Our ability to build a comprehensive long-range marketing strategy and create a compelling therapeutic system program.
- Our ability to secure distribution relationships with a unique combination of leading suppliers by creating a very effective channel of distribution that will make us indispensible.
Marketing Strategy
As mentioned previously, our primary market is residents of homecare agencies and post-acute care facilities who are covered and considered to be highly at risk for complications. Initially, we will focus on serving these patients in facilities that are part of Homecare or Assisted Living chains in the Southern U.S.
Our success is dependent on building a strong field clinical sales team that can build relationships at the facility level, successfully leveraging of national account relationships, and effectively marketing the value proposition that our therapeutic system program can offer to both the resident and the facility.
We will utilize the therapeutic system offering as the means to gain entrance into the market and build our organization. Then we will add complimentary products for managing complications of the disease, followed by other products related to managing complications of heart disease and aging.
Our key to marketing success will be to effectively manage the building of our brand platform in the market place, which will consist of the following elements:
- Brand Vision – our envisioned future of the brand is to be THE national source for product solutions to manage the complications of X disease in the elderly.
- Brand Attributes – Partners, problem solvers, fast on our feet, flexible and easy to work with.
- Brand Essence – the shared soul of the brand, the spark of which is present in every experience a customer has with our products, will be “Problem Solving” and “Compassionate.” This will be the core of our organization, driving the type of people we hire and the type of behavior we expect.
- Brand Image – the outside world’s overall perception of our organization will be that we are clinical pros who are alleviating the complications of X disease in the elderly.
- Brand Promise – our concise statement of what we do, why we do it, and why customers should do business with us will be, “To alleviate pain and suffering in patients with X disease.”
- Positioning Statement – Our positioning statement is: “For Homecare Providers who want solutions to manage the complications of X disease in their residents, we offer a unique portfolio of product solutions and clinical support that allows providers to alleviate resident suffering. This provides caregivers with peace of mind and a sense of pride and satisfaction. Unlike our competitors, we focus first on understanding the needs of caregivers to residents, then we scour the market to find the most innovative products, and deliver them with a team of compassionate clinical professionals”.
Image
Our company name will be Zenergy Medical Industries. This reflects the passion and problem solving that are to be the essence of our brand. Our tagline will be more specific to our initial focus on disease related products:
Zenergy Medical Industries: “Alleviating the pain of disease.”
Our logo and color scheme will be finalized by our “go live date” of May 7th.
The communications strategy we will use in year 1 to build our brand platform will include the following items:
- Website – featuring product line information, research, testimonials, cost benefit analysis, frequently asked questions, and medicare reimbursement information. This website will be used as a tool for both our sales team and our customers.
- Presentations, brochures and mailers geared to the facility level (ideally, distributed by the corporate office as part of an initiative to prevent complications of disease) explaining the benefits of our product as part of a comprehensive care plan.
- Presentations and brochures geared to the corporate account decision maker explaining the benefits of our program in terms of positive outcomes, reduced cost from complications, and reduced risk of lawsuits or negative survey events.
- A presentation and recruiting brochure geared to prospective sales people that emphasizes the benefits of joining our organization.
- Training materials that help every employee deliver our brand message in a consistent manner.
Message Matrices
These six elements described above combine to create our brand platform, from which we can develop our marketing message to our target segments. The key questions to answer in our marketing message will be, for each key segment:
- Who is the key decision maker or influencer?
- What do they want or need? What problem do they need to solve?
- What do we offer to satisfy the need or solve the problem?
- What are the key messages – benefits (emotional or tangible) of our offering?
- What are the proof points, success stories, research, to support our key messages?
We will use these questions to develop four specific tactical level message matrices for our target market segments – primarily Homecare chains at the corporate level, Assisted Living chains at the corporate level, and Homecare and Assisted Living facilities. We will also develop a similar message matrix for our prospective employees. These message matrices will be used as templates/guidelines in developing sales and marketing pieces for these specific market segments. They will ensure continuity between our brand vision and the tactical marketing communication efforts we undertake on a daily basis.
Message Matrix for Homecare Chain Corporate Offices:
| Key Decision Maker or Influencer | VP of Procurement, VP of Clinical, VP of Risk Management |
| What do they need? | Ways to reduce risk; improve outcomes and quality of life for arthritic residents at no cost to the facility and with minimal effort on their part |
| What do we offer? | Products at no cost to them that help reduce risk of complications and surgery in arthritic residents. Program for care that is easy for them to adopt. Management of the entire process. |
| What are the tangible benefits? | Improved outcomes, improved quality of life, and reduced costs (complications) in arthritic residents. |
| What are the emotional benefits? | They create a reputation as a “Center of Excellence”. They feel like innovators and shrewd business people. They have a sense of pride and satisfaction, and gain piece of mind. |
| Proof, research, success stories | Research articles, testimonials, manufacturer success stories. |
Message Matrix for Homecare Facilities:
| Key Decision Maker or Influencer | DON, Administrator, Resident, Family members, Physicians |
| What do they need? | Greater comfort, and prevention of disease related complications. Reduced risk of ulcers, infections, and surgeries. Reduced costs (complications) and improved outcomes and quality of life. Compliance with Corporate mandated programs. |
| What do we offer? | A clear, simple program of care; an easy buying process with the assessment, ordering, and fitting of systems managed by us with no cost, hassles, or excessive paperwork for the facility. |
| What are the tangible benefits? | Greater resident satisfaction; improved comfort and outcomes; reduced complications (cost) and risk of adverse complications |
| What are the emotional benefits? | Happier residents and family. Peace of mind. A sense of satisfaction and pride from being proactive caregivers. A sense that they provide something special that residents could not get at other facilities. |
| Proof, research, success stories | Research articles, testimonials, manufacturer success stories. |
Message Matrix for Internal Organizational Team:
| Key Decision Maker or improved | Field based clinical sales representatives; receptionists |
| What do they need? | Good income potential, flexible hours with good family vs. career balance; freedom to be entrepreneurs; the ability to “make a difference” in improved and in providing input to shape the direction of the company; the desire to belong to a great organization and get in on the ground floor. |
| What do we offer? | Flexible hours and independence. A good compensation plan; a great organization with a growing product line; the opportunity to make a difference in improved and in shaping an organization from the ground floor. |
| What are the tangible benefits? | A nice income with flexible hours. Long range potential as part of a growing organization. The opportunity to gain clinical sales experience. |
| What are the emotional benefits? | To feel valued and valuable. To make a difference in organization and in their company. To love their job and company. to make a nice income without sacrificing family life/personal life. |
| Proof, research, success stories | Research articles, testimonials, manufacturer success stories. |
Sales Strategy
Sales Strategy:
Our sales strategy will be to call on Homecare and Assisted Living chains doing business in the Southeast to educate them on the benefits of a Therapeutic System program. We will seek to gain their support in allowing our field clinicians to visit their facilities to meet with residents that are at risk for complications of X disease.
We will be uniquely positioned to gain market share within our target segments because of our:
- National account relationships which will open the door to pre-qualified sales opportunities at the facility level
- Large-scale field clinical sales presence, which will provide comprehensive coverage of facilities across the entire Southeast, and eventually the entire country.
- Powerful compelling marketing programs that will present a compelling cost-benefit story for chains, facilities, and residents.
We will seek to do a comprehensive assessment of all at-risk residents in a facility, then we will utilize different sales strategies based on their payor status, which will fit into one of the following classifications:
- Medicare part B will reimburse for the product. This is an easy sell because Medicare part B will reimburse for 80% of the cost of the product.
- Private insurance will reimburse for the product. This may require gaining a contract with the private insurer in order to qualify for reimbursement.
- The resident or their family must be willing to pay for the product. This will require demonstrating to the resident and/or family members the benefits of enhanced comfort and safety, and reduced risk of complications by using our product (which can cost thousands of dollars) compared to $264 per year for therapeutic systems (as part of an overall program of care).
- The facility is willing to pay for the product out of the per diem reimbursement they receive for the resident from either Medicare, Medicaid, private insurance, or other private sources. This will require demonstrating the value to the facility in reduced risk, enhanced resident comfort, and potential savings of costs associated with complications that can run to $2,000-13,500 per year for two years.
Pricing:
Medicare reimbursement for standard systems is set at $264.04 per year, with 80% covered by Medicare part B and the remaining 20% being a co-pay that is the responsibility of the resident.
Our compensation plan will be a straight 16% commission paid when we receive reimbursement for delivered product. We anticipate 30-45 day payment cycles from Medicare. We will utilize an experienced Medicare part B biller to ensure correct submissions to Medicare and help us maximize cash flow by shortening reimbursement cycles and maximizing collection of 20% copay amounts. We plan to coordinate the order, reimbursement and other record keeping processes out of a central office located initially in Charleston, SC.
Sales Forecast
Our sales in year one are calculated using the following assumptions:
- Seven reps are hired, in May, June, August, September, October, November, and December
- For the first 12 months each rep is in their territory, it is assumed they will generate increasing unit volume each month. The rate of increase in unit sales slows in later months because more time is devoted to servicing the clients who were sold earlier in the year, leaving less available time to drive new unit volume. Units per rep tops out at a max capacity of 50 units per rep per month.
- Net sales are calculated using the average sales price of $211.32, which is 80% of the total sales which are based on the $264.04 Medicare approved rate.
Our direct costs in year one are calculated using the following assumptions:
- $65 per unit cost.
- Shipping is estimated at 5% of total sales.
- Medicare part B billing is estimated at $9.50 per unit, which is the “intermediate” service package from our planned part B billing service.
- Commissions are estimated at 20% of net sales.
Our sales in year two are calculated using the following assumptions:
- Seven reps hired in year one following the 12 month ramp up to max monthly capacity of 50 units.
- Eight new reps hired follow the 12 month ramp up.
Our direct costs in year two are calculated using the following assumptions:
- $67 per unit cost.
- Shipping is estimated at 5% of total sales.
- Medicare part B billing is estimated at $10.00 per unit, which is the “intermediate” service package from our planned part B billing service.
- Commissions are estimated at 20% of net sales.
Our sales in year three are calculated using the following assumptions:
- Fifteen reps hired in years one and two following the 12 month ramp up to max monthly capacity of 50 units.
- Ten new reps hired follow the 12 month ramp up.
Our direct costs in year three are calculated using the following assumptions:
- $69 per unit cost.
- Shipping is estimated at 5% of total sales.
- Medicare part B billing is estimated at $10.50 per unit, which is the “intermediate” service package from our planned part B billing service.
- Commissions are estimated at 20% of net sales.


| Sales Forecast | |||
| Year 1 | Year 2 | Year 3 | |
| Sales | |||
| Therapy System | $458,374 | $1,670,845 | $3,408,228 |
| Other | $0 | $0 | $0 |
| Total Sales | $458,374 | $1,670,845 | $3,408,228 |
| Direct Cost of Sales | Year 1 | Year 2 | Year 3 |
| Inventory Used | $112,840 | $454,930 | $834,900 |
| Other | $0 | $0 | $0 |
| Subtotal Direct Cost of Sales | $112,840 | $454,930 | $834,900 |
Recruitment and Training
Recruitment:
We will focus on contracting with clinicians (LPN, RN, OT, PT, or RT) with two or more years of sales or customer service experience, who desire part-time or flexible work schedules and are willing to work under contract employee status. They will have minimum call activity requirements of three to five calls per week, and we anticipate that the average revenue generated per year will be approximately $120,000 for someone working 15-20 hours per week and meeting the minimum sales call guidelines. Over time we will add additional products related to supporting the complications of X disease. Mitch Finkelstein has been involved in clinical salesforce management and recruiting for 15+ years in this area, and Yanni Acropolis has 15+ years of clinical sales experience in the Southeast as well. We plan to leverage our relationships in the clinical sales arena to recruit top caliber sales reps, focusing first in the Southeast. Our goal in year one will be to fill at least seven positions by December 1st in the following territories:
- Tennessee – Chattanooga, Knoxville, Memphis, Nashville
- North Carolina – Charlotte, Raleigh, Greensboro,
- South Carolina – Charleston
- Florida – Miami, Tampa, Orlando, Jacksonville
- Georgia – Atlanta
The remaining unfilled territories will be filled early in year two, and we also begin to look at the following markets for years two and three to reach at least 25 territories by early in year three.
- Alabama – Birmingham
- Texas – Dallas, San Antonio, Houston
- Mississippi – Jackson, Gulfport
- Louisiana – Baton Rouge, New Orleans
- Oklahoma – Tulsa, Oklahoma City
- Arkansas – Little Rock, Fort Smith
- Virginia – Richmond, Norfolk
Training:
The product is straightforward and limited in scope (initially), and we will be hiring clinicians with experience in the post-acute marketplace who are generally familiar with Medicare reimbursement, so we anticipate the ramp-up time to full productivity to be brief (30-60 days). Training will be provided in the following areas:
- A review of the company strategy, their job expectations, and our internal processes for ordering, billing, collecting, commissions, record keeping, etc. (one-half day required)
- Product-related training from the manufacturer (one day required)
- Reimbursement-related training from the appropriate DMERC Region C ombudsman (one-half to full day required)
- A review of the basics of disease care, ideally conducted by a qualified physicians (one-half to full day required)
Sales Process
Sales Process at Facility Level:
- Qualified Medicare residents must have an disease diagnosis.
- Resident must have one of the following conditions:
- [Proprietary and Confidential Information Removed.]
- Resident must be currently being treated under a comprehensive disease care plan by a physician. The patients medical records must reflect the need for the care.
- To place an order, the sales rep must submit:
- A statement of certifying physician for therapeutic systems form reviewed and signed by the M.D. or D.O. overseeing the disease treatment plan.
- A signed prescription form from the prescribing physician (M.D., or D.O.).
- An order for the systems signed and dated by the physician.
- A completed Medicare claim form (HCFA 1500).
- To be successfully reimbursed under Medicare part B requires all the documentation above, plus demonstrated evidence of attempts to collect the 20% co-pay, proof of delivery documentation, and an electronically filed HCFA 1500 form including the prescribing physician’s name and UPIN number.
- Medicare part B will pay 80% towards the allowable reimbursement on one system (HCPCS code L3500). The resident pays the remaining 20%. Medicare will reimburse for one new system every year. The DMERC REgion C reimbursement for this is $264.04, of which $211.32 will be billed to Medicare and the remainder is billed to the resident. Typical reimbursement time is estimated at 30-60 days.
- For Private Pay, or Medicaid residents, we must gain a commitment either from a) the resident’s private insurer, b) the resident or their family, or c) the facility to reimburse for this product, by explaining the cost/benefit proposition of investing $264 in therapeutic systems to help avoid the risk of complications or surgery which can cost $2,000 – $13,500 to treat per incident over a two year period.
We plan to contract with an experienced part B biller who will, for a flat charge per every six line items on an order, handle the electronic claims submission, and the billing and collection of co-pay amounts. This will minimize the time our field sales people spend chasing paperwork, and allow them to maximize their time spent building relationships, selling, and providing extraordinary service.
Milestones
Notes relating to some of the key milestones:
- Determine cash needs and draw up partnership:
- We estimate $15,580 will be required to fund start-up and initial operations. Finkelstein, Acropolis, and Aktum plan to contribute equally to fund these cash needs and Finkelstein will create a partnership agreement with a plan for financially accounting for the investment capital.
- Find part B biller and sign agreement: this biller will be our EDI filer as well.
- Rent facility:
- Sign lease agreement with target of 3 months guaranteed, 90 day out clause, out clause if provider number delayed or we move operations out of state.
- Secure computer, printer, DSL line, phone and phone line, answering system as back-up to forward calls the receptionist misses, secure filing system, office furniture, signage with company name and hours of operation.
- Sign supply contracts with Lotus Industries and Sutra Corp.: must show that we can order product directly on credit terms (not COD) and receive immediately, reducing need for inventory.
- Get inventory and samples: enough to demonstrate the range of products offered. Create starter kits for reps with product samples, name tags, lab coats, a heat gun, and DPM training.
- Get liability insurance: we will see if landlord’s policy covers us adequately (we will need a copy of the entire policy with the specific verbiage showing we are covered under their facility insurance for at least $300K).
- Create forms, checklist, processes:
- Forms – certificate of necessity, prescription, product order form with patient info, proof of delivery, CMS reimbursement form.
- Checklist – an easy to follow list of things the rep must cover (paperwork, reviewing Medicare reimbursement and the resident’s co-pay, warranty, etc.)
- Processes – flow chart the order, reimbursement, and complaint processes with electronic tracking sheets.
- Review with Yanni’s wife: make sure the forms make sense and we haven’t missed anything.
- Train receptionist: she needs to know how to handle calls or in-person inquiries, and be properly coached for the initial site inspection and what to do if there is a random inspection later.
- Create audit/QA process: define process for auditing field Medicare claims to ensure only legitimate claims are being processed.
- Create sales recruitment packet:
- Hiring profile and job description.
- Compensation plan and employment contract.
- Territories defined with listings of accounts.
- Recruitment brochure and PowerPoint presentation. This will include a letter, press release, and corporate marketing brochure.
- Receive provider number: this is estimated to take 60 days if we have everything right the first time.
- Begin recruiting reps: identify top priority territories and begin to network.
- Seven reps contracted: goal is to hire one by the first of the month in April, May, June, August, September, October, November.
- Sales training program (to be done in the first 30 days):
- Product training by the manufacturers.
- Reimbursement training by the ombudsman.
- Order process training by the management team.
- Company orientation from the management team.
- Basics of anatomy, pathology, and therapeutic system fitting from MD consultants in each major market.
- Identify corporate account targets: determine which key chains have the biggest presence in our initial seven territories.
- First Marketing pieces:
- Mailers to be distributed by the corporate accounts to the member facilities.
- Mailers directly to other facilities in the initial seven territories.
- Brochures for use by facilities or corporate offices.

| Milestones | |||||
| Milestone | Start Date | End Date | Budget | Manager | Department |
| Train receptionist on correct protocols | 3/1/2005 | 3/7/2005 | $0 | Finkelstein | Department |
| Create Audit/QA process for checking for bad Medicare claims | 3/1/2005 | 3/7/2005 | $0 | Steiner | Department |
| Complete Business plan | 2/15/2005 | 3/18/2005 | $0 | Aktum | Department |
| Resolve open issues for regulatory applications | 2/15/2005 | 3/18/2005 | $0 | Mutka | Department |
| Define Company Name, Logo, Tag line, Brand Platform | 2/15/2005 | 3/18/2005 | $0 | Aktum | Department |
| Determine cash needs and draw up partnership agreement | 2/15/2005 | 3/18/2005 | $0 | Finkelstein | Department |
| Obtain business license | 2/25/2005 | 3/18/2005 | $0 | Finkelstein | Department |
| Sign agreement with a Medicare part B biller service | 2/25/2005 | 3/18/2005 | $0 | Finkelstein | Department |
| Set up a checkbook and establish accountant relationship | 2/25/2005 | 3/18/2005 | $0 | Finkelstein | Department |
| Rent facility, get Furn/Comp/print/fax/phone/files/DSL line | 3/1/2005 | 3/18/2005 | $0 | Finkelstein | Department |
| Sign supplier contracts | 3/1/2005 | 3/18/2005 | $0 | Acropolis | Department |
| Get liability insurance | 3/1/2005 | 3/18/2005 | $0 | Finkelstein | Department |
| Sales info packet – territories/comp/contract/job descript/recruitment piece | 3/1/2005 | 3/18/2005 | $0 | Aktum | Department |
| Get inventory and samples – create starter kits for reps | 3/7/2005 | 3/18/2005 | $0 | Acropolis | Department |
| Create forms, checklist order/reimb/complaint processes | 3/7/2005 | 3/18/2005 | $0 | Aktum | Department |
| Submit forms to CMS | 3/7/2005 | 3/18/2005 | $0 | Mutka | Department |
| Review forms/checklists/processes with Yanni’s wife | 3/14/2005 | 3/18/2005 | $0 | Aktum | Department |
| Sales training program – product, reimb, order process, strategy, recuit docs | 8/26/2009 | 4/1/2005 | $0 | Aktum | Department |
| Identify target corporate accounts | 8/26/2009 | 4/1/2005 | $0 | Acropolis | Department |
| Site inspection | 3/7/2005 | 4/30/2005 | $0 | Steiner | Department |
| Begin recruiting sales team members | 3/1/2005 | 5/1/2005 | $0 | Finkelstein | Department |
| Receive provider number | 3/7/2005 | 5/7/2005 | $0 | Team | Department |
| Officially “go live” selling to facilities | 5/7/2005 | 5/8/2005 | $0 | Team | Department |
| Send out first marketing pieces (mailer); website goes live | 5/7/2005 | 5/30/2005 | $0 | Aktum | Department |
| Hire 7 field reps in prime markets | 4/1/2005 | 12/1/2005 | $0 | Finkelstein | Department |
| Call on targeted corporate accounts | 4/1/2005 | 12/1/2005 | $0 | Acropolis | Department |
| Identify future product lines; become fabulously wealthy | 8/1/2005 | 12/31/2005 | $0 | Team | Department |
| Totals | $0 | ||||
Web Plan Summary
Our website will be informational and will serve as a repository for the organization through password-accessible pages where we will update critical company information.
The Web pages viewable by the public will be designed to be extremely fast and easy to use, and will enhance our brand image as, “clinical pros with a variety of product solutions for the complications of X disease in the elderly.” It will feature the following content:
- Product information.
- Contact info for the representative who covers their area.
- Information about comprehensive programs.
- Research articles with the latest on disease care.
- Links to disease websites and to our suppliers’ websites.
- Customer testimonials and sales success stories.
- Information about Medicare guidelines for the therapeutic system program.
- Progressively expanded content relevant to homecare and post-acute care and the complications of disease.
- Links to other disease product companies.
- Possible customer Web portals to allow corporate office executives to track progress of member facilities in implementing a therapeutic system program.
Website Marketing Strategy
We will attempt to drive customers and sales reps to use the website as our primary source of communicating company information and any other relevant information on disease, the market, reimbursement, etc. We will explore using Web portals as a means to get corporate office decision makers to drive program compliance.
Development Requirements
We will develop a very basic website using standard packages and doing the development work in-house. We will target going live with the basic site by early May, then we will enhance the site as we go along.
Management Summary
Zenergy Medical Industries is being founded by three individuals with a combined 50+ years of healthcare sales and marketing experience.
Mitch Finkelstein:
More than 20 years of clinical sales and technical service specializing in disease care prevention and treatment across the healthcare continuum. Served as Area VP of Sales at A Company for the Homecare market, managing 70+ clinical sales people across six regions in the eastern U.S. Earned Regional Director of the year honors in XXXX and President’s Council honors in XXXXX. Went on to serve as VP of Sales and Marketing for the B Company, a start-up electronic documentation software provider focused on outpatient facilities, before joining C Company as Director of Corporate Accounts.
Yanni Acropolis, RN:
Over 20 years of experience in nursing and clinical sales, specializing in disease care prevention and treatment in the post-acute marketplace. Over six years of experience in post-acute corporate account sales and GPO sales. Yanni was consistently a top performer with ISS and then A Company, which was rated a top healthcare salesforce in the U.S. in a best practices study commissioned by Selling Power Magazine and earned their 1995 World Class Sales Award. Yanni also served as Director of Corporate Accounts at D Company, and most recently served as Executive Director for Corporate Accounts at C Company, a leader in documentation, charting, and training systems for the post-acute marketplace. Yanni received his RN from XXXX in XXXX and his B.S. from XXXX in XXXX.
Ekim Aktum, MBA:
Over 15 years of experience in the healthcare marketplace in sales, marketing, product development, and business unit leadership across all segments of the healthcare continuum. During his 11 years at A Company, he lead a start up capital equipment business unit in the Homecare market for five years. Served as VP of Sales and Marketing at E Company, a leader in exam lights, tables and equipment management systems before taking the role as Senior VP of Sales and Marketing at C Company. Ekim has a B.S. in Business from XXXXX and an MBA in Marketing from XXXXX.
Personnel Plan
The three founding management team members will be our sole employees during the start-up phase until we go live at the beginning of May. They will not take a salary until the second year, because they will be under a profit sharing agreement.
Starting May 1 we will add one sales rep per month starting on the first of each month in May, June, August, September, October, November, and December. We will continue contracting more representatives in 2006 to reach 15 salespeople by mid-year, and then 25 by mid-year 2007. Our sales team members will be contract employees paid straight commission, with no expenses reimbursed or benefits. As contracted labor, their commissions are listed with other non-inventory costs of sales in the Profit and Loss.
Our sales team will be recruited from our network of contacts within the arena of post-acute-care clinical salespeople.
Beginning in September of 2005, we will hire a part-time office manager from a temp agency at $12 per hour for 20 hours per week. This will move to 30 hours per week in year two and 40 hours per week in year three.
| Personnel Plan | |||
| Year 1 | Year 2 | Year 3 | |
| VP of Marketing and General Manager | $0 | $75,000 | $80,000 |
| VP of Corporate Account Sales | $0 | $75,000 | $80,000 |
| VP of Field Clinical Sales | $0 | $75,000 | $80,000 |
| Office Manager | $6,720 | $18,720 | $24,960 |
| Total People | 4 | 4 | 4 |
| Total Payroll | $6,720 | $243,720 | $264,960 |
Financial Plan
Our Start-up requirements for cash, inventory, expenses and assets will see us through the first year, as we hire our contracted sales representatives and secure increasing market share. Even with our conservative estimates, based on market research and the industry knowledge of the the founders, we will far surpass the break-even point from the first month of sales. This financial advantage is largely a result of the deferred salaries of the principals, who will take salaries starting in the second year based on the success of the business (projections below).
Our commission structure for contracted sales representatives, along with our shipping methods, means that our variable costs always exceed our fixed costs – we have low overhead, and are investing in low-risk face-to-face sales time to generate profits. Rent, travel for the founders, and payroll for our part-time office manager are the largest operating expenses. With a qualified medical biller, we should collect quickly on reimbursements, and maintain a positive cash balance throughout.
We will repay the initial loan within three years, at 10% interest. If sales go better than projected, we may pay it off sooner. We do not expect future rounds of investment or loans, since the business will be self-sustaining by the end of year one. By the end of the third year, Zenergy will have a respectable net worth.
Start-up Funding
As mentioned previously, we plan to personally invest to cover portion of the initial start-up costs for the business. For the first year, our requirements will be met as follows:
- Private funding from Aktum, Finkelstein, and Acropolis.
- An SBA Micro-Loan.
- Cash generated from ongoing operations beginning in months three through six.
We will seek credit terms of 60 days from our suppliers until we build up sufficient cash flow to be able to accept net 30 terms.
| Start-up Funding | |
| Start-up Expenses to Fund | $3,305 |
| Start-up Assets to Fund | $12,275 |
| Total Funding Required | $15,580 |
| Assets | |
| Non-cash Assets from Start-up | $2,775 |
| Cash Requirements from Start-up | $9,500 |
| Additional Cash Raised | $0 |
| Cash Balance on Starting Date | $9,500 |
| Total Assets | $12,275 |
| Liabilities and Capital | |
| Liabilities | |
| Current Borrowing | $5,000 |
| Long-term Liabilities | $0 |
| Accounts Payable (Outstanding Bills) | $0 |
| Other Current Liabilities (interest-free) | $0 |
| Total Liabilities | $5,000 |
| Capital | |
| Planned Investment | |
| Owner | $10,580 |
| Investor | $0 |
| Additional Investment Requirement | $0 |
| Total Planned Investment | $10,580 |
| Loss at Start-up (Start-up Expenses) | ($3,305) |
| Total Capital | $7,275 |
| Total Capital and Liabilities | $12,275 |
| Total Funding | $15,580 |
Important Assumptions
We are assuming the following key points:
- We will submit our application to CMS by March 7 and receive a Medicare provider number in 60 days.
- We will successfully recruit field clinical sales reps per our schedule to reach seven reps by December 2005 with the first reps coming on line to begin selling in May.
- We will be able to successfully leverage our corporate account relationships to drive business for the field sales force.
- We will successfully secure supplier agreements with X Industries and Y Corporation with favorable credit terms (60 days) at the outset; and with availability of product samples, marketing materials, and token inventory at no cost or a nominal cost.
- We will be able to routinely receive reimbursement from the DMERCs in 30-45 days.
| General Assumptions | |||
| Year 1 | Year 2 | Year 3 | |
| Plan Month | 1 | 2 | 3 |
| Current Interest Rate | 10.00% | 10.00% | 10.00% |
| Long-term Interest Rate | 10.00% | 10.00% | 10.00% |
| Tax Rate | 30.00% | 30.00% | 30.00% |
| Other | 0 | 0 | 0 |
Break-even Analysis
The following table and chart show our break-even point in the first year, when the three VPs are deferring compensation. With a low monthly fixed cost and variable costs (including commission and shipping), we need to sell per month the amount calculated below to break even. Market research and previous experience assures us that we will easily surpass the break-even point even in our first month of sales.

| Break-even Analysis | |
| Monthly Revenue Break-even | $3,312 |
| Assumptions: | |
| Average Percent Variable Cost | 25% |
| Estimated Monthly Fixed Cost | $2,497 |
Projected Profit and Loss
Notes on Profit and Loss statement for year one:
- Non-inventory Costs of Goods Sold are tracked at the top of the table. These are variable costs, such as commission and shipping.
- Low payroll expense in the first year- all reps will be contract employees paid straight commission, no expenses or benefits. The managers will not take a salary in the first year, but will take salaries in the second and third years dependent upon first year performance and profits. The only personnel in year one is our part-time office manager.
- Marketing and promotion expenses will include website management; creation and printing of custom “program overview” flyers for corporate accounts to distribute to member facilities, mailers to go to facilities in a reps major MSA, and any other sales collateral that must be developed.
- Rent assumes $450 per month lease.
- Telecommunications of $200 per month assumes primary phone line with call forwarding and answering machine capabilities, tied-in to a receptionist, with a number listed under our business name in directory assistance; DSL internet line; phone card for long-distance calling.
- General Liability insurance assumes $30 per month to cover the place of business.
- Legal expenses include drafting of initial start-up documents and contracts, with minimal additional work on a monthly basis.
- Accounting assumes $20 per hour and seven hours per month to close the books, handle commissions, etc.
- Stationery and office supplies includes business cards and stationery, files, miscellaneous supplies, etc.
- Travel – left unbudgeted at this time.
- Equipment assumes $1,000 purchase up-front during start-up phase.
- Other – unanticipated expenses.
- Note: 10% of profits will be allocated to repay initial cash investments by Acropolis, Finkelstein, and Aktum at 5% simple interest. 10% of profits will be paid to Finkelstein and Acropolis to cover corporate overhead costs.
Notes on Years two and three growth assumptions:
- Increase stationery and office supplies (.52%), telecommunications (.52%), marketing (.65%), legal (.26%) and accounting (.39%) as a consistent % of sales.
- 10% per year increase in rent associated with need for more services and facility related growth.
- 20% per year growth in liability insurance.
- Equipment lease expense doubles each year associated with rapid sales growth and expansion.
- 10% per year growth in miscellaneous expenses.
- Travel grows to $15,000 in year two and $25,000 in year three for increased recruitment, management, and corporate account sales calls.


| Pro Forma Profit and Loss | |||
| Year 1 | Year 2 | Year 3 | |
| Sales | $458,374 | $1,670,845 | $3,408,228 |
| Direct Cost of Sales | $112,840 | $454,930 | $834,900 |
| Shipping/Handling | $22,919 | $83,542 | $170,411 |
| Medicare Part B Billing | $16,043 | $66,834 | $136,329 |
| Uncollectible Accounts Reserve | $91,675 | $334,169 | $681,646 |
| Sales Commission | $73,340 | $267,335 | $545,316 |
| Total Cost of Sales | $316,816 | $1,206,810 | $2,368,603 |
| Gross Margin | $141,558 | $464,035 | $1,039,625 |
| Gross Margin % | 30.88% | 27.77% | 30.50% |
| Expenses | |||
| Payroll | $6,720 | $243,720 | $264,960 |
| Marketing/Promotion | $3,000 | $10,860 | $22,153 |
| Depreciation | $0 | $0 | $0 |
| Rent | $5,400 | $5,940 | $6,534 |
| Telecommunications | $2,400 | $8,688 | $17,723 |
| General Liability Insurance | $360 | $432 | $518 |
| Legal Expenses | $1,200 | $4,344 | $8,861 |
| Accounting Expenses | $1,800 | $6,516 | $13,292 |
| Stationery and Office Supplies | $2,400 | $8,688 | $17,723 |
| Travel | $5,000 | $15,000 | $25,000 |
| Office Equipment | $480 | $960 | $1,920 |
| Payroll Taxes | $0 | $0 | $0 |
| Other | $1,200 | $1,320 | $1,452 |
| Total Operating Expenses | $29,960 | $306,468 | $380,136 |
| Profit Before Interest and Taxes | $111,598 | $157,567 | $659,489 |
| EBITDA | $111,598 | $157,567 | $659,489 |
| Interest Expense | $418 | $9,653 | $17,685 |
| Taxes Incurred | $33,354 | $44,374 | $192,541 |
| Net Profit | $77,826 | $103,540 | $449,263 |
| Net Profit/Sales | 16.98% | 6.20% | 13.18% |
Projected Cash Flow
Because of the relatively quick ramp-up process for sales people, and our relatively low start-up expenses, we believe we can start generating very positive cash flow within the first year. This is all contingent on achieving our expense targets for rent, insurance and other “fixed” items, plus contracting and training new sales reps per our plan and achieving successful reimbursement cycles from the DMERCs.

| Pro Forma Cash Flow | |||
| Year 1 | Year 2 | Year 3 | |
| Cash Received | |||
| Cash from Operations | |||
| Cash Sales | $22,919 | $83,542 | $170,411 |
| Cash from Receivables | $326,558 | $1,299,253 | $2,825,063 |
| Subtotal Cash from Operations | $349,477 | $1,382,796 | $2,995,474 |
| Additional Cash Received | |||
| Sales Tax, VAT, HST/GST Received | $0 | $0 | $0 |
| New Current Borrowing | $0 | $0 | $0 |
| New Other Liabilities (interest-free) | $0 | $0 | $0 |
| New Long-term Liabilities | $0 | $200,000 | $0 |
| Sales of Other Current Assets | $0 | $0 | $0 |
| Sales of Long-term Assets | $0 | $0 | $0 |
| New Investment Received | $0 | $0 | $0 |
| Subtotal Cash Received | $349,477 | $1,582,796 | $2,995,474 |
| Expenditures | Year 1 | Year 2 | Year 3 |
| Expenditures from Operations | |||
| Cash Spending | $6,720 | $243,720 | $264,960 |
| Bill Payments | $327,576 | $1,333,044 | $2,647,144 |
| Subtotal Spent on Operations | $334,296 | $1,576,764 | $2,912,104 |
| Additional Cash Spent | |||
| Sales Tax, VAT, HST/GST Paid Out | $0 | $0 | $0 |
| Principal Repayment of Current Borrowing | $1,650 | $1,650 | $1,700 |
| Other Liabilities Principal Repayment | $0 | $0 | $0 |
| Long-term Liabilities Principal Repayment | $0 | $12,000 | $24,000 |
| Purchase Other Current Assets | $0 | $0 | $0 |
| Purchase Long-term Assets | $0 | $0 | $0 |
| Dividends | $0 | $0 | $0 |
| Subtotal Cash Spent | $335,946 | $1,590,414 | $2,937,804 |
| Net Cash Flow | $13,531 | ($7,619) | $57,670 |
| Cash Balance | $23,031 | $15,412 | $73,082 |
Projected Balance Sheet
The Balance Sheet reflects the fact that many of our Assets will be tied up in Accounts Receivable; billing correctly and promptly, and following up on unpaid reimbursement claims, will be critical to the Cash balance. The Starting Balances are the requirements from the Start-up table and the Start-up Funding. By the end of the first year, we will increase the net worth of the business handsomely. Net Worth will continue to rise dramatically as we secure a higher market share and continue to contain costs.
| Pro Forma Balance Sheet | |||
| Year 1 | Year 2 | Year 3 | |
| Assets | |||
| Current Assets | |||
| Cash | $23,031 | $15,412 | $73,082 |
| Accounts Receivable | $108,897 | $396,946 | $809,700 |
| Inventory | $19,695 | $79,403 | $145,723 |
| Other Current Assets | $275 | $275 | $275 |
| Total Current Assets | $151,898 | $492,036 | $1,028,780 |
| Long-term Assets | |||
| Long-term Assets | $0 | $0 | $0 |
| Accumulated Depreciation | $0 | $0 | $0 |
| Total Long-term Assets | $0 | $0 | $0 |
| Total Assets | $151,898 | $492,036 | $1,028,780 |
| Liabilities and Capital | Year 1 | Year 2 | Year 3 |
| Current Liabilities | |||
| Accounts Payable | $63,447 | $113,695 | $226,876 |
| Current Borrowing | $3,350 | $1,700 | $0 |
| Other Current Liabilities | $0 | $0 | $0 |
| Subtotal Current Liabilities | $66,797 | $115,395 | $226,876 |
| Long-term Liabilities | $0 | $188,000 | $164,000 |
| Total Liabilities | $66,797 | $303,395 | $390,876 |
| Paid-in Capital | $10,580 | $10,580 | $10,580 |
| Retained Earnings | ($3,305) | $74,521 | $178,061 |
| Earnings | $77,826 | $103,540 | $449,263 |
| Total Capital | $85,101 | $188,641 | $637,904 |
| Total Liabilities and Capital | $151,898 | $492,036 | $1,028,780 |
| Net Worth | $85,101 | $188,641 | $637,904 |
Business Ratios
Our comparison industry is Medical Equipment and Supplies, SIC Code 5047.03. Because we are a start-up, our sales growth rates will be much higher than the industry, especially given that we are competing in a small niche with fragmented competition. We have constructed our operation to keep start-up capital requirements to a minimum, building much of our expense into our variable cost structure (sales compensation, reimbursement/collections,) or farming it out (legal, accounting).
Because we do not have a retail storefront or extensive distribution facilities, our fixed overhead costs are extremely low. None of our three managing executives are on the payroll in the first year, and our sales team will be contract reps on straight commission. We have farmed out all legal, accounting, and reimbursement/collections to outside services to keep overhead and risk to a minimum.
As a result, we will have extremely favorable margins, SG&A, and current/quick ratios compared to industry standards.
| Ratio Analysis | ||||
| Year 1 | Year 2 | Year 3 | Industry Profile | |
| Sales Growth | n.a. | 264.52% | 103.98% | 4.75% |
| Percent of Total Assets | ||||
| Accounts Receivable | 71.69% | 80.67% | 78.70% | 29.09% |
| Inventory | 12.97% | 16.14% | 14.16% | 37.55% |
| Other Current Assets | 0.18% | 0.06% | 0.03% | 20.32% |
| Total Current Assets | 100.00% | 100.00% | 100.00% | 86.96% |
| Long-term Assets | 0.00% | 0.00% | 0.00% | 13.04% |
| Total Assets | 100.00% | 100.00% | 100.00% | 100.00% |
| Current Liabilities | 43.97% | 23.45% | 22.05% | 42.28% |
| Long-term Liabilities | 0.00% | 38.21% | 15.94% | 10.98% |
| Total Liabilities | 43.97% | 61.66% | 37.99% | 53.26% |
| Net Worth | 56.03% | 38.34% | 62.01% | 46.74% |
| Percent of Sales | ||||
| Sales | 100.00% | 100.00% | 100.00% | 100.00% |
| Gross Margin | 30.88% | 27.77% | 30.50% | 30.41% |
| Selling, General & Administrative Expenses | 13.90% | 21.58% | 17.32% | 15.33% |
| Advertising Expenses | 0.00% | 0.00% | 0.00% | 1.03% |
| Profit Before Interest and Taxes | 24.35% | 9.43% | 19.35% | 2.74% |
| Main Ratios | ||||
| Current | 2.27 | 4.26 | 4.53 | 1.86 |
| Quick | 1.98 | 3.58 | 3.89 | 0.84 |
| Total Debt to Total Assets | 43.97% | 61.66% | 37.99% | 57.79% |
| Pre-tax Return on Net Worth | 130.64% | 78.41% | 100.61% | 5.85% |
| Pre-tax Return on Assets | 73.19% | 30.06% | 62.38% | 13.87% |
| Additional Ratios | Year 1 | Year 2 | Year 3 | |
| Net Profit Margin | 16.98% | 6.20% | 13.18% | n.a |
| Return on Equity | 91.45% | 54.89% | 70.43% | n.a |
| Activity Ratios | ||||
| Accounts Receivable Turnover | 4.00 | 4.00 | 4.00 | n.a |
| Collection Days | 42 | 58 | 68 | n.a |
| Inventory Turnover | 11.65 | 9.18 | 7.42 | n.a |
| Accounts Payable Turnover | 6.16 | 12.17 | 12.17 | n.a |
| Payment Days | 27 | 23 | 23 | n.a |
| Total Asset Turnover | 3.02 | 3.40 | 3.31 | n.a |
| Debt Ratios | ||||
| Debt to Net Worth | 0.78 | 1.61 | 0.61 | n.a |
| Current Liab. to Liab. | 1.00 | 0.38 | 0.58 | n.a |
| Liquidity Ratios | ||||
| Net Working Capital | $85,101 | $376,641 | $801,904 | n.a |
| Interest Coverage | 267.30 | 16.32 | 37.29 | n.a |
| Additional Ratios | ||||
| Assets to Sales | 0.33 | 0.29 | 0.30 | n.a |
| Current Debt/Total Assets | 44% | 23% | 22% | n.a |
| Acid Test | 0.35 | 0.14 | 0.32 | n.a |
| Sales/Net Worth | 5.39 | 8.86 | 5.34 | n.a |
| Dividend Payout | 0.00 | 0.00 | 0.00 | n.a |
Appendix
| Sales Forecast | |||||||||||||
| Month 1 | Month 2 | Month 3 | Month 4 | Month 5 | Month 6 | Month 7 | Month 8 | Month 9 | Month 10 | Month 11 | Month 12 | ||
| Sales | |||||||||||||
| Therapy System | 0% | $0 | $5,281 | $10,562 | $15,842 | $23,236 | $31,685 | $41,190 | $51,752 | $58,353 | $66,274 | $74,195 | $80,004 |
| Other | 0% | $0 | $0 | $0 | $0 | $0 | $0 | $0 | $0 | $0 | $0 | $0 | $0 |
| Total Sales | $0 | $5,281 | $10,562 | $15,842 | $23,236 | $31,685 | $41,190 | $51,752 | $58,353 | $66,274 | $74,195 | $80,004 | |
| Direct Cost of Sales | Month 1 | Month 2 | Month 3 | Month 4 | Month 5 | Month 6 | Month 7 | Month 8 | Month 9 | Month 10 | Month 11 | Month 12 | |
| Inventory Used | $0 | $1,300 | $2,600 | $3,900 | $5,720 | $7,800 | $10,140 | $12,740 | $14,365 | $16,315 | $18,265 | $19,695 | |
| Other | $0 | $0 | $0 | $0 | $0 | $0 | $0 | $0 | $0 | $0 | $0 | $0 | |
| Subtotal Direct Cost of Sales | $0 | $1,300 | $2,600 | $3,900 | $5,720 | $7,800 | $10,140 | $12,740 | $14,365 | $16,315 | $18,265 | $19,695 | |
| Personnel Plan | |||||||||||||
| Month 1 | Month 2 | Month 3 | Month 4 | Month 5 | Month 6 | Month 7 | Month 8 | Month 9 | Month 10 | Month 11 | Month 12 | ||
| VP of Marketing and General Manager | 0% | $0 | $0 | $0 | $0 | $0 | $0 | $0 | $0 | $0 | $0 | $0 | $0 |
| VP of Corporate Account Sales | 0% | $0 | $0 | $0 | $0 | $0 | $0 | $0 | $0 | $0 | $0 | $0 | $0 |
| VP of Field Clinical Sales | 0% | $0 | $0 | $0 | $0 | $0 | $0 | $0 | $0 | $0 | $0 | $0 | $0 |
| Office Manager | 0% | $0 | $0 | $0 | $0 | $0 | $960 | $960 | $960 | $960 | $960 | $960 | $960 |
| Total People | 3 | 3 | 3 | 3 | 3 | 4 | 4 | 4 | 4 | 4 | 4 | 4 | |
| Total Payroll | $0 | $0 | $0 | $0 | $0 | $960 | $960 | $960 | $960 | $960 | $960 | $960 | |
| Pro Forma Profit and Loss | |||||||||||||
| Month 1 | Month 2 | Month 3 | Month 4 | Month 5 | Month 6 | Month 7 | Month 8 | Month 9 | Month 10 | Month 11 | Month 12 | ||
| Sales | $0 | $5,281 | $10,562 | $15,842 | $23,236 | $31,685 | $41,190 | $51,752 | $58,353 | $66,274 | $74,195 | $80,004 | |
| Direct Cost of Sales | $0 | $1,300 | $2,600 | $3,900 | $5,720 | $7,800 | $10,140 | $12,740 | $14,365 | $16,315 | $18,265 | $19,695 | |
| Shipping/Handling | 5% | $0 | $264 | $528 | $792 | $1,162 | $1,584 | $2,060 | $2,588 | $2,918 | $3,314 | $3,710 | $4,000 |
| Medicare Part B Billing | 4% | $0 | $185 | $370 | $554 | $813 | $1,109 | $1,442 | $1,811 | $2,042 | $2,320 | $2,597 | $2,800 |
| Uncollectible Accounts Reserve | 20% | $0 | $1,056 | $2,112 | $3,168 | $4,647 | $6,337 | $8,238 | $10,350 | $11,671 | $13,255 | $14,839 | $16,001 |
| Sales Commission | 16% | $0 | $845 | $1,690 | $2,535 | $3,718 | $5,070 | $6,590 | $8,280 | $9,336 | $10,604 | $11,871 | $12,801 |
| Total Cost of Sales | $0 | $3,650 | $7,300 | $10,950 | $16,060 | $21,900 | $28,470 | $35,770 | $40,332 | $45,807 | $51,282 | $55,297 | |
| Gross Margin | $0 | $1,631 | $3,262 | $4,892 | $7,176 | $9,785 | $12,720 | $15,982 | $18,021 | $20,467 | $22,913 | $24,707 | |
| Gross Margin % | 0.00% | 30.88% | 30.88% | 30.88% | 30.88% | 30.88% | 30.88% | 30.88% | 30.88% | 30.88% | 30.88% | 30.88% | |
| Expenses | |||||||||||||
| Payroll | $0 | $0 | $0 | $0 | $0 | $960 | $960 | $960 | $960 | $960 | $960 | $960 | |
| Marketing/Promotion | $250 | $250 | $250 | $250 | $250 | $250 | $250 | $250 | $250 | $250 | $250 | $250 | |
| Depreciation | $0 | $0 | $0 | $0 | $0 | $0 | $0 | $0 | $0 | $0 | $0 | $0 | |
| Rent | $450 | $450 | $450 | $450 | $450 | $450 | $450 | $450 | $450 | $450 | $450 | $450 | |
| Telecommunications | $200 | $200 | $200 | $200 | $200 | $200 | $200 | $200 | $200 | $200 | $200 | $200 | |
| General Liability Insurance | $30 | $30 | $30 | $30 | $30 | $30 | $30 | $30 | $30 | $30 | $30 | $30 | |
| Legal Expenses | $100 | $100 | $100 | $100 | $100 | $100 | $100 | $100 | $100 | $100 | $100 | $100 | |
| Accounting Expenses | $150 | $150 | $150 | $150 | $150 | $150 | $150 | $150 | $150 | $150 | $150 | $150 | |
| Stationery and Office Supplies | $200 | $200 | $200 | $200 | $200 | $200 | $200 | $200 | $200 | $200 | $200 | $200 | |
| Travel | $0 | $0 | $0 | $0 | $0 | $0 | $0 | $1,000 | $1,000 | $1,000 | $1,000 | $1,000 | |
| Office Equipment | $40 | $40 | $40 | $40 | $40 | $40 | $40 | $40 | $40 | $40 | $40 | $40 | |
| Payroll Taxes | 15% | $0 | $0 | $0 | $0 | $0 | $0 | $0 | $0 | $0 | $0 | $0 | $0 |
| Other | $100 | $100 | $100 | $100 | $100 | $100 | $100 | $100 | $100 | $100 | $100 | $100 | |
| Total Operating Expenses | $1,520 | $1,520 | $1,520 | $1,520 | $1,520 | $2,480 | $2,480 | $3,480 | $3,480 | $3,480 | $3,480 | $3,480 | |
| Profit Before Interest and Taxes | ($1,520) | $111 | $1,742 | $3,372 | $5,656 | $7,305 | $10,240 | $12,502 | $14,541 | $16,987 | $19,433 | $21,227 | |
| EBITDA | ($1,520) | $111 | $1,742 | $3,372 | $5,656 | $7,305 | $10,240 | $12,502 | $14,541 | $16,987 | $19,433 | $21,227 | |
| Interest Expense | $42 | $40 | $39 | $38 | $37 | $35 | $34 | $33 | $32 | $30 | $29 | $28 | |
| Taxes Incurred | ($469) | $21 | $511 | $1,000 | $1,686 | $2,181 | $3,062 | $3,741 | $4,353 | $5,087 | $5,821 | $6,360 | |
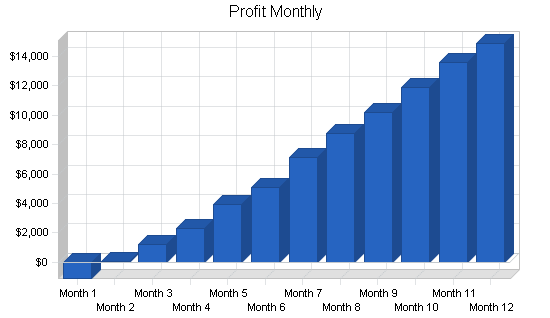
| Net Profit | ($1,093) | $49 | $1,192 | $2,334 | $3,934 | $5,089 | $7,144 | $8,729 | $10,156 | $11,870 | $13,583 | $14,840 | |
| Net Profit/Sales | 0.00% | 0.93% | 11.28% | 14.73% | 16.93% | 16.06% | 17.34% | 16.87% | 17.41% | 17.91% | 18.31% | 18.55% | |
| Pro Forma Cash Flow | |||||||||||||
| Month 1 | Month 2 | Month 3 | Month 4 | Month 5 | Month 6 | Month 7 | Month 8 | Month 9 | Month 10 | Month 11 | Month 12 | ||
| Cash Received | |||||||||||||
| Cash from Operations | |||||||||||||
| Cash Sales | $0 | $264 | $528 | $792 | $1,162 | $1,584 | $2,060 | $2,588 | $2,918 | $3,314 | $3,710 | $4,000 | |
| Cash from Receivables | $0 | $0 | $2,676 | $7,693 | $12,709 | $18,796 | $26,355 | $34,917 | $44,482 | $52,509 | $59,449 | $66,974 | |
| Subtotal Cash from Operations | $0 | $264 | $3,204 | $8,485 | $13,871 | $20,380 | $28,415 | $37,504 | $47,400 | $55,823 | $63,158 | $70,974 | |
| Additional Cash Received | |||||||||||||
| Sales Tax, VAT, HST/GST Received | 0.00% | $0 | $0 | $0 | $0 | $0 | $0 | $0 | $0 | $0 | $0 | $0 | $0 |
| New Current Borrowing | $0 | $0 | $0 | $0 | $0 | $0 | $0 | $0 | $0 | $0 | $0 | $0 | |
| New Other Liabilities (interest-free) | $0 | $0 | $0 | $0 | $0 | $0 | $0 | $0 | $0 | $0 | $0 | $0 | |
| New Long-term Liabilities | $0 | $0 | $0 | $0 | $0 | $0 | $0 | $0 | $0 | $0 | $0 | $0 | |
| Sales of Other Current Assets | $0 | $0 | $0 | $0 | $0 | $0 | $0 | $0 | $0 | $0 | $0 | $0 | |
| Sales of Long-term Assets | $0 | $0 | $0 | $0 | $0 | $0 | $0 | $0 | $0 | $0 | $0 | $0 | |
| New Investment Received | $0 | $0 | $0 | $0 | $0 | $0 | $0 | $0 | $0 | $0 | $0 | $0 | |
| Subtotal Cash Received | $0 | $264 | $3,204 | $8,485 | $13,871 | $20,380 | $28,415 | $37,504 | $47,400 | $55,823 | $63,158 | $70,974 | |
| Expenditures | Month 1 | Month 2 | Month 3 | Month 4 | Month 5 | Month 6 | Month 7 | Month 8 | Month 9 | Month 10 | Month 11 | Month 12 | |
| Expenditures from Operations | |||||||||||||
| Cash Spending | $0 | $0 | $0 | $0 | $0 | $960 | $960 | $960 | $960 | $960 | $960 | $960 | |
| Bill Payments | $36 | $1,221 | $5,093 | $9,938 | $15,018 | $21,342 | $27,973 | $35,734 | $44,803 | $49,079 | $55,601 | $61,737 | |
| Subtotal Spent on Operations | $36 | $1,221 | $5,093 | $9,938 | $15,018 | $22,302 | $28,933 | $36,694 | $45,763 | $50,039 | $56,561 | $62,697 | |
| Additional Cash Spent | |||||||||||||
| Sales Tax, VAT, HST/GST Paid Out | $0 | $0 | $0 | $0 | $0 | $0 | $0 | $0 | $0 | $0 | $0 | $0 | |
| Principal Repayment of Current Borrowing | $0 | $150 | $150 | $150 | $150 | $150 | $150 | $150 | $150 | $150 | $150 | $150 | |
| Other Liabilities Principal Repayment | $0 | $0 | $0 | $0 | $0 | $0 | $0 | $0 | $0 | $0 | $0 | $0 | |
| Long-term Liabilities Principal Repayment | $0 | $0 | $0 | $0 | $0 | $0 | $0 | $0 | $0 | $0 | $0 | $0 | |
| Purchase Other Current Assets | $0 | $0 | $0 | $0 | $0 | $0 | $0 | $0 | $0 | $0 | $0 | $0 | |
| Purchase Long-term Assets | $0 | $0 | $0 | $0 | $0 | $0 | $0 | $0 | $0 | $0 | $0 | $0 | |
| Dividends | $0 | $0 | $0 | $0 | $0 | $0 | $0 | $0 | $0 | $0 | $0 | $0 | |
| Subtotal Cash Spent | $36 | $1,371 | $5,243 | $10,088 | $15,168 | $22,452 | $29,083 | $36,844 | $45,913 | $50,189 | $56,711 | $62,847 | |
| Net Cash Flow | ($36) | ($1,107) | ($2,039) | ($1,603) | ($1,298) | ($2,072) | ($669) | $661 | $1,486 | $5,633 | $6,447 | $8,127 | |
| Cash Balance | $9,464 | $8,356 | $6,317 | $4,714 | $3,417 | $1,345 | $676 | $1,337 | $2,823 | $8,456 | $14,904 | $23,031 | |
| Pro Forma Balance Sheet | |||||||||||||
| Month 1 | Month 2 | Month 3 | Month 4 | Month 5 | Month 6 | Month 7 | Month 8 | Month 9 | Month 10 | Month 11 | Month 12 | ||
| Assets | Starting Balances | ||||||||||||
| Current Assets | |||||||||||||
| Cash | $9,500 | $9,464 | $8,356 | $6,317 | $4,714 | $3,417 | $1,345 | $676 | $1,337 | $2,823 | $8,456 | $14,904 | $23,031 |
| Accounts Receivable | $0 | $0 | $5,017 | $12,375 | $19,732 | $29,097 | $40,402 | $53,178 | $67,425 | $78,379 | $88,830 | $99,867 | $108,897 |
| Inventory | $2,500 | $2,500 | $2,200 | $2,600 | $3,900 | $5,720 | $7,800 | $10,140 | $12,740 | $14,365 | $16,315 | $18,265 | $19,695 |
| Other Current Assets | $275 | $275 | $275 | $275 | $275 | $275 | $275 | $275 | $275 | $275 | $275 | $275 | $275 |
| Total Current Assets | $12,275 | $12,239 | $15,848 | $21,568 | $28,622 | $38,509 | $49,822 | $64,269 | $81,777 | $95,842 | $113,877 | $133,310 | $151,898 |
| Long-term Assets | |||||||||||||
| Long-term Assets | $0 | $0 | $0 | $0 | $0 | $0 | $0 | $0 | $0 | $0 | $0 | $0 | $0 |
| Accumulated Depreciation | $0 | $0 | $0 | $0 | $0 | $0 | $0 | $0 | $0 | $0 | $0 | $0 | $0 |
| Total Long-term Assets | $0 | $0 | $0 | $0 | $0 | $0 | $0 | $0 | $0 | $0 | $0 | $0 | $0 |
| Total Assets | $12,275 | $12,239 | $15,848 | $21,568 | $28,622 | $38,509 | $49,822 | $64,269 | $81,777 | $95,842 | $113,877 | $133,310 | $151,898 |
| Liabilities and Capital | Month 1 | Month 2 | Month 3 | Month 4 | Month 5 | Month 6 | Month 7 | Month 8 | Month 9 | Month 10 | Month 11 | Month 12 | |
| Current Liabilities | |||||||||||||
| Accounts Payable | $0 | $1,057 | $4,767 | $9,444 | $14,314 | $20,418 | $26,792 | $34,245 | $43,175 | $47,233 | $53,548 | $59,549 | $63,447 |
| Current Borrowing | $5,000 | $5,000 | $4,850 | $4,700 | $4,550 | $4,400 | $4,250 | $4,100 | $3,950 | $3,800 | $3,650 | $3,500 | $3,350 |
| Other Current Liabilities | $0 | $0 | $0 | $0 | $0 | $0 | $0 | $0 | $0 | $0 | $0 | $0 | $0 |
| Subtotal Current Liabilities | $5,000 | $6,057 | $9,617 | $14,144 | $18,864 | $24,818 | $31,042 | $38,345 | $47,125 | $51,033 | $57,198 | $63,049 | $66,797 |
| Long-term Liabilities | $0 | $0 | $0 | $0 | $0 | $0 | $0 | $0 | $0 | $0 | $0 | $0 | $0 |
| Total Liabilities | $5,000 | $6,057 | $9,617 | $14,144 | $18,864 | $24,818 | $31,042 | $38,345 | $47,125 | $51,033 | $57,198 | $63,049 | $66,797 |
| Paid-in Capital | $10,580 | $10,580 | $10,580 | $10,580 | $10,580 | $10,580 | $10,580 | $10,580 | $10,580 | $10,580 | $10,580 | $10,580 | $10,580 |
| Retained Earnings | ($3,305) | ($3,305) | ($3,305) | ($3,305) | ($3,305) | ($3,305) | ($3,305) | ($3,305) | ($3,305) | ($3,305) | ($3,305) | ($3,305) | ($3,305) |
| Earnings | $0 | ($1,093) | ($1,044) | $148 | $2,482 | $6,416 | $11,505 | $18,649 | $27,378 | $37,534 | $49,404 | $62,987 | $77,826 |
| Total Capital | $7,275 | $6,182 | $6,231 | $7,423 | $9,757 | $13,691 | $18,780 | $25,924 | $34,653 | $44,809 | $56,679 | $70,262 | $85,101 |
| Total Liabilities and Capital | $12,275 | $12,239 | $15,848 | $21,568 | $28,622 | $38,509 | $49,822 | $64,269 | $81,777 | $95,842 | $113,877 | $133,310 | $151,898 |
| Net Worth | $7,275 | $6,182 | $6,231 | $7,423 | $9,757 | $13,691 | $18,780 | $25,924 | $34,653 | $44,809 | $56,679 | $70,262 | $85,101 |


