
Medquip, Inc.
Executive Summary
Medquip, Inc. is a medical device development company that intends to design, patent, and market medical devices related to endoscopic surgical niche markets. Three devices have already been designed with the participation of leading physicians and surgeons in gastroenterology. Seven patents are initially incorporated. The company projects $16 million in sales in year three. The company expects to have $50 million in revenue by year five. Patent applications on its first three market entries have already been accomplished using a top patent law firm.
The market segments are clearly defined and all are subject to a high growth trend. One market is projected to exceed $160 million in the next three years. That is the endoscopic variceal ligation market. One of the founders of Medquip participated in the design of the current market leader in that field and has improved upon the product significantly. Another market addresses a well-defined and unanswered need in endoscopic surgery: the clearing of fundal pools of blood and tissue during surgical procedures. A new and innovative design has been created to answer the needs of surgeons.
This market should begin at $20 million but could expand to several hundred million as soon as approvals are obtained for many varied surgical procedures. Medquip intends to license this technology to a larger company. The company becomes mature in year three. The company is potentially profitable in year one only if a proposed licensing agreement can be closed.
Mission
The mission of Medquip, Inc. is to design, develop, and market new patented technologies in the medical device field. The technologies will fill market niches that each account for a minimum of $20 million dollars in potential sales. Each technology will fill a current need in medical procedure by improving upon an existing technology or device, or by designing a device to serve a need that is clearly defined and acknowledged by medical professionals. Each product shall be priced to appeal to a managed-care market that stresses lowest cost of total treatment parameters.
Keys to Success
The keys to success for Medquip, Inc. are as follows:
- Initial capitalization obtained.
- All patent applications filed.
- The ability to generate early revenue from non-regulated markets in Europe.
- Licensing at least one technology and application to a major medical device corporation.
- Getting low interest loans and/or grants to fully fund product development and prototype manufacture.
- Recruiting top-notch CEO prior to second round financing and market roll-out.
- Successful 510k approval from FDA to market Visi-Band in the U.S.
- Successful implementation of sales and marketing plan to U.S. managed care market to obtain a minimum 10% market share in the second full year to generate $16 million in revenue.
- Increased product development and continued market share gains to produce a $50 million revenue company by year five.
Objectives
The principal objectives of Medquip, Inc. are as follows:
- To achieve a 10% market penetration in the endoscopic variceal ligation market by year three.
- To achieve $16 million in revenue by year three.
- To raise $1 million in private seed capital in the first six months.
- To win low interest loans and grants from the government of Puerto Rico totaling $1.2 million in year one.
- To license its technology for the obliteration/suction/irrigation market for $1 million dollars in year one.
Company Summary
Medquip, Inc. will develop and market endoscopic medical devices through multiple distribution channels both foreign and domestic. The company is currently developing its patent-applied technologies to final product and approval stage. It is also seeking to establish its corporate identity in the medical products field. Growth strategy calls for one joint venture license as well as the following objectives:
- Complete the patent process.
- Establish corporate identity, brand names, trademarks.
- Establish a medical advisory board.
- Build staff, infrastructure, and retain consultants for trial and compliance issues.
- Conduct animal trials.
- Prepare for FDA clinical trials.
- Continue R & D and product development.
- Explore options for 2nd round financing (venture capital, corporate alliance, licensing, public offering) to maximize value to shareholders.
Note: Management believes that accelerated FDA approval process will be available on the band ligation device since it involves only modifications on an existing, approved device. There is past precedent in 510k approvals (in an average of 3 months) in documented cases.
Start-up Summary
The key elements in the Start-up plan for Medquip, Inc. are:
- The legal expense for filing all patent applications.
- The establishment of Corporate Identity.
- The location and place of doing business.
- Funding of additional capital raising alternatives.
- Salary for the two key managers and founders.
- Formulation of Strategic Plan. Costs of raising capital through private placement.
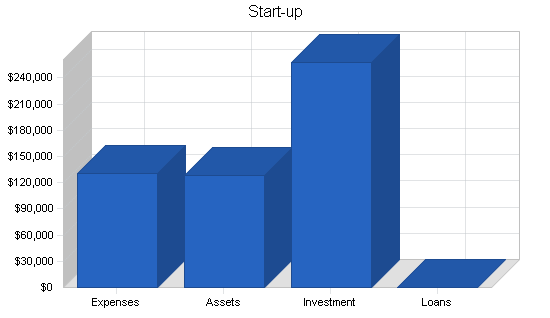
$215,000 was raised from the initial two investors for these purposes. This funding came in in early 1998 and these tasks have either been completed successfully or are in the final process of completion. These are treated purely as start-up expenses by this plan. $128,000 is treated as cash-on-hand as of the start of this plan on January 1, 1998. The remainder of the start-up capital required as well as capital required for the continuation of operations in the first six months will be provided by selling the shares in the private placement. The capital obtained from these sales is expected to total an additional $850,000 and the plan calls for this cash to be infused in May and June, 1998.
| Start-up Funding | |
| Start-up Expenses to Fund | $130,000 |
| Start-up Assets to Fund | $128,000 |
| Total Funding Required | $258,000 |
| Assets | |
| Non-cash Assets from Start-up | $0 |
| Cash Requirements from Start-up | $128,000 |
| Additional Cash Raised | $0 |
| Cash Balance on Starting Date | $128,000 |
| Total Assets | $128,000 |
| Liabilities and Capital | |
| Liabilities | |
| Current Borrowing | $0 |
| Long-term Liabilities | $0 |
| Accounts Payable (Outstanding Bills) | $0 |
| Other Current Liabilities (interest-free) | $0 |
| Total Liabilities | $0 |
| Capital | |
| Planned Investment | |
| Investor 1 | $150,000 |
| Investor 2 | $65,000 |
| Investor 3 | $29,000 |
| Investor 4 | $14,000 |
| Additional Investment Requirement | $0 |
| Total Planned Investment | $258,000 |
| Loss at Start-up (Start-up Expenses) | ($130,000) |
| Total Capital | $128,000 |
| Total Capital and Liabilities | $128,000 |
| Total Funding | $258,000 |
| Start-up | |
| Requirements | |
| Start-up Expenses | |
| Legal | $50,000 |
| Stationery etc. | $2,000 |
| Consultants | $3,000 |
| Insurance | $3,000 |
| Rent | $9,300 |
| Custom CAD software | $5,700 |
| Logo Design | $1,000 |
| Management Salaries | $56,000 |
| Total Start-up Expenses | $130,000 |
| Start-up Assets | |
| Cash Required | $128,000 |
| Start-up Inventory | $0 |
| Other Current Assets | $0 |
| Long-term Assets | $0 |
| Total Assets | $128,000 |
| Total Requirements | $258,000 |
Company Ownership
Medquip, Inc. is a South State “C” corporation.
Its founding shareholders are:
Eric Smith (2,545,000 shares)
Timothy Jones (500,000 shares)
At the date of this plan, two additional shareholders are of record:
Arthur C. Clark (50,000 shares)
Genesis Corp. (14,000 shares)
Company Locations and Facilities
Medquip, Inc. business offices are at 1234 Main Street, Anytown, U.S.A. Phone is …. Fax is …. These offices are leased month-to-month on a temporary basis. This business plan calls for the establishment of corporate offices, R&D facilities, and prototype and small-run manufacturing facilities. These facilities are to be located in Puerto Rico with 10,000 sq. ft. initially expandable to 30,000 sq.ft. Rental costs in Puerto Rico range from $1.75 to $4.00 per sq. ft. Currently available space in Puerto Rico may also be used on a joint-venture basis to be negotiated.
Products
Medquip, Inc. will initially market three distinct products.
- The Visi-Band, a disposable device that is used in endoscopic variceal ligation procedures.
- The Visi-Gator, a partially disposable device that is used to remove blood clots during various endoscopic surgical procedures.
- The Visi-Lyser, a suction/irrigation device for laparoscopic procedures.
The technology used in these products is the subject of seven patents in the application process.
These three product areas may be more generally defined as follows:
- Endoscopy Devices–used for esophageal variceal ligation, hemorrhoidal ligation.
The Visi-Band: Consisting of ligating bands with greater stretchability and grip (Super-Elastic bands incorporated into a multi-band dispensing device). - Endoscopy Devices–used for lysis (tissue dissolving).
The Visi-Gator: Consisting of a rotary cutting tool to clear fundal pools of blood in the stomach. - Endoscopy Devices–used for suction/irrigation and tissue removal.
The Visi-Lyser: Consisting of a suction/irrigation tool to remove tissue effectively.
Product Description
A detailed and technical description of the Medquip, Inc. initial product line follows:

Multiple Ligating Band Dispenser:
The Visi-Band
Application is endoscopic variceal ligation which is a rapidly growing surgical procedure quickly replacing sclerotherapy for the removal of polyps in both upper and lower gastro-intestinal exploration.
Scope: This innovation applies to the internal technology of ligating bands independent of the dispenser or delivery system. Visi-Band is a pre-loaded delivery device for applying multiple ligating bands remotely from the distal tip of an endoscope. (The leading current product in this category is the Speedband made by Boston Scientific).
Clinical Advantages: A perceived clinical advantage of these bands is ligation of a greater range of tissue sizes with a single band. These ligating bands stretch easily over the largest tissue to be ligated and yet will grip securely even the tiniest tissue to be removed. These bands can have an inner diameter near zero so that even tiny varices are gripped firmly.
Current State of the Art Technology: Market-leading bands today are molded of homogeneous rubber materials. Material properties of elasticity have limited the stretch of conventional ligating bands to a range of about seven-fold. A typical market-leading band for esophageal variceal ligation has an inner diameter of 1.8mm. This band can stretch to a maximum inner diameter of 12.4 mm to ligate a varix. This maximum size roughly corresponds to the endoscope diameter. A varix of 1.8 mm would not be ligated because the band would be loose around the tissue.
Medquip Technology: The Super-Elastic Band innovation effectively engineers the band material stresses in a way that increases the apparent stretchability of the band many times. We have created bands with proximate zero inner diameters, which can be stretched at least as large as conventional bands with large inner diameters. Bands created with this technology can also hold their elasticity for longer periods of time. The basis of our technology is an internal compressive pre-stress at the band inner diameter. This can be achieved in at least five practical ways covered in our patent documentation. The true zero inner diameter band is a result of the compressive forces creating small scale creasing or wrinkling which fill the band interior. Bands made to date exhibit an effective elasticity of 20 times and more versus the seven times stretch in the market-leading band.
Medquip ligation devices should have an unprecedented and superior range of application to meet ligation requirements. Super-Elastic Bands can mean fewer special sized devices to manufacture, purchase, specify, and stock. This fits well in a managed-care environment through lower costs with inherent clinical advantages. Medquip and the health care system could benefit from higher volumes of a smaller number of different products.
Further Clinical Advantages:
- Visi-Band is designed for multiple band ligations with a single scope insertion.
- Visi-Band delivers maximum visibility with zero “tunnel vision” during insertion and exploration, a limitation of all competitors.
- Visi-Band delivers maximum mobility by being nearly flush with the distal end of the endoscope during insertion and exploration.
- Visi-Band should be significantly faster to install to the endoscope by having many fewer assembly parts and steps than the competition.
- Visi-Band is smaller in diameter than Speedband for patient acceptance and comfort.
- Visi-Band patient entry is smoother and protected at all times from miss-fires by a smooth, transparently clear outer shield.
- Visi-Band can ligate smaller varices with the super-elastic bands as described above.
- Visi-Band can be supplied in a single configuration with multiple bands, seven or eight, at a cost similar to the competition’s three or six band unit.
Note: Today’s multiple ligating band dispensers release bands off a tube at the distal endoscope end with typically two filaments for each band. This tube is at least as long as the endoscope diameter and creates severe “tunnel vision” because the bands typically cover the outside surface of the clear plastic tube. This added length also reduces the mobility of the distal tip. Each filament must be precisely assembled and triggered for each band. Bands exposed on the outside of the tube are prone to miss-fire as evidenced by a clear shield with instruction to remove just prior to insertion into the patient. A conically tapered dispenser is typical and necessary to help bands roll off the distal end. This taper increases the diameter of the ligating unit. Installation is a complex, multiple step process often involving a separate ligating unit, handle unit, a trip wire, scope fastener, and irrigation catheter. Actuating a competitive unit can cause the distal tip to move from the tension of the trip wire.
Medquip Technology: The Medquip Visi-Band multiple band ligator is planned to have two components, the ligating unit and handle. The Ligating Unit comprises a clear tubular base with bands stretched around the distal end, a clear sleeve outside of and concentric with the base, and a trip tube which passes through the biopsy channel of the scope. The ligating unit mounts in a retracted position around and substantially flush with the distal tip of the endoscope. The ligating unit is placed on the distal tip of the scope by pushing the trip tube through the biopsy channel. The handle is then snapped on the free end of the trip tube. The unit is extended distally prior to ligation, and the sleeve is moved axially to load then deliver a single band at a time. No individual filaments are required for each band so manufacturing cost is low. The unit is “digitally” actuated by repeated axial motion of the sleeve rather than small incremental displacements. The tip of the scope should not move because a compressive force in the tube cancels the tension in the trip wire internal to the trip tube.
Summary of advantages over currently available products:
- Better visibility due to side-mounting of band dispensing device.
- Smaller band, more stretch, enabling banding of smaller varices.
- Internal loading of bands, enabling protection (bands are not dislodged).
- Capable of carrying more bands (8 vs. 6).
- Significant reduction in manufacturing and assembly costs.
Lysis (tissue dissolving) Rotary Cutting/Suction Tool:
The Visi-Gator
Applications include the removal of blood clot and stray tissue during suction irrigation in laparoscopic surgery, examination of bleeding ulcers in the stomach, hematoma, clot in the fallopian tube, or cerebral aneurysm. Current solutions employ crude tubes that incorporate a few holes for anti-clogging combined with drug treatments which are largely ineffective.
Scope: An uncleared fundal pool of retained blood in the stomach precludes complete visualization of the stomach in 5.6% of cases of acute upper gastrointestinal bleeding. According to an October 1997 article in Gastrointestinal Endoscopy: “In conclusion, the results of this study provide evidence that the inability to clear a fundal pool of blood at the time of emergent upper endoscopy for acute UGI bleeding is associated with substantial morbidity and mortality and … Aggressive mechanical and/or pharmacological measures to clear the fundus of blood are warranted in patients undergoing urgent endoscopy for acute UGI bleeding.”
Clinical Advantages: The Visi-Gator tool may be inserted from the outside into the biopsy channel of the endoscope as needed. The scope does not need to be withdrawn to install and use the Visi-Gator.
Current State of the Art Technology: Lavage with suction is frequently ineffective due to clot integrity and clogging of suction channels. High-pressure water jets penetrate beyond the clot, potentially penetrating and damaging soft tissues.
Medquip Technology: Visi-Gator is a thin, ultra-flexible, spring-like device that is introduced through the biopsy channel to the distal end of the endoscope. High-speed rotations of one or more of many concentric spiral elements both drive rotating lysing filaments and positively pump solids and liquids out. Centripetal force expands and stiffens the filaments from a stored position during insertion to a generally planar and circular path. Vacuum may also be applied. A hollow central channel may also be provided for irrigation, access, or other therapy.
Further Clinical Advantages:
- Visi-Gator clot dissolving aggressiveness varies from mild to intense and is proportional to the adjustable input speed control.
- Visi-Gator actively draws fluid and solids up through the biopsy channel with a positive pumping action.
- Visi-Gator continues to dissolve solids even as they pass through the biopsy channel.
- Visi-Gator will tend to be non-clogging and self-cleaning.
- Visi-Gator does not rub high-speed surfaces against the biopsy channel and cause high rates of wear.
- Visi-Gator provides a central channel for clear water irrigation, additional suction or other therapy.
- Visi-Gator motor driver is envisioned to be reusable. The fluid path and lysis head is likely to be disposable.
- Visi-Gator dissolving action and lysing head is transparent. One can see through the scope real time in the zone of clot lysis continuously as the lysing progresses.
- Visi-Gator appears to be capable of rapid clot lysis yet is gentle to tissue.
- Visi-Gator tip is soft and pliant to flex over any non-clot tissues.
- Visi-Gator lysis zone is generally a defined planar disc perpendicular to the axis of the distal end of the scope.
- Visi-Gator allows lysis not to penetrate beyond the disc boundaries.
Suction Irrigation Device for General Laparoscopic Surgery: (incorporated into Visi-Gator):
The Visi-Lyser
Scope: Visi-Lyser suction irrigation device includes a self contained, stand-alone suction/irrigation device to aid the surgeon during laparoscopic surgical procedures.
Clinical Advantages: Lysis of the clot or tissue at the entry point, which will tend to be clog resistant. A likely disposable fluid path and reusable power head.
Current State of the Art Technology: Conventional suction irrigation devices are prone to clog when presented with a clot during surgery.
Medquip Technology: Similar to the Visi-Gator tool with the lysing filaments contained within a perforated suction tube.
Note: The Visi-Lyser is designed to work with the Visi-Gator in laparoscopic procedures but may also be used by itself in distinct procedures.
One embodiment inserts into the working channel of an endoscope as an accessory. A flexible spiral spring-like element rotates at several thousand RPM inside of a close spiral spring tube of opposite hand wind. A tiny motor on the outside proximal end of the endoscope spins the spiral element. Liquid or solid material inside the spiral element windings is drawn from distal to proximal positions by the interaction of the rotating and stationary spiral geometry. Suction is preferably applied at the proximal end of the spiral element before the motor. At the distal end of the spiral element, a generally spherical ball tip covers the spiral end to protect soft tissues from the spiral screwing into tissue and causing trauma. Projecting from the tip is a single or multiple of filaments, which spin at the high speed of the spiral element. The filaments lyse the unwanted clot or soft tissue fragments, depending on speed of rotation, diameter, material, and construction details. The filaments may optionally be extended or retracted from the outside to lyse differing diameters or body cavity sections. Rotation speed of the motor is a direct way to control aggressiveness of lysis dynamically from the outside. A flexible tube may be placed at the center of the rotating spiral element to carry water or saline to flush the cavity being lysed. A single or multiple of apertures near the distal end of the water tube may spray a jet sideways to clear potential clogs. The water center tube is preferentially not rotating.
In a second embodiment, designed for suction irrigation of a surgical site, the rotating filaments and spiral are placed in a tube with small apertures. The filaments rotating inside server to lyse clot and tissue which would normally clog the apertures. A rotating jet of water inside could also serve to clear any clogs. The spiral element could also be present inside.
Advantages over currently available products: No Products Currently Available.
Note: A variety of medical journal articles and research studies are available that cover both potential product areas.
Patent searches and filings are under way with Sidley and Austin. Opinion is that as many as seven distinct patents may be available and obtainable on the three devices cumulatively. Mr. Smith has assigned these patents (as obtained) and any future issued patents in the medical device arena to Medquip, Inc.
Competitive Comparison
The leading product currently available in the endoscopic variceal ligation market is the Speedband made by Boston Scientific. Other product entries are from C.R. Bard and Wilson-Cook. The Speedband from the Microvasive division of Boston Scientific is far and away the market leader with an estimated 60% market share. The Six Shooter from Wilson-Cook has a 20% market share. Rapid-Fire made by C.R. Bard has a 10% market share. All of the devices are disposable (single patient use).
Eric Smith, a founder of Medquip and the developer of Medquip’s patented technologies had significant participation in the design of the Speedband. He is aware of both its strengths and shortcomings. The Visi-Band is a much improved product in a rapidly growing market application. Many of the product advantages were highlighted in the previous section of this plan. To summarize the key advantages:
- Band itself enables smaller varices to be banded.
- Smaller hole plus more stretch in band.
- Device has better field of view.
- Device has better mobility.
- Bands are fired internally vs. externally.
- Significant cost reductions in mfg.
The Visi-Gator and the Visi-Lyser represent an entirely new application with no current competition. Their use can potentially range from stomach procedures to heart procedures and a variety of other surgical procedures. Together they solve the well documented and acknowledged problem of lack of visibility in endoscopic procedures where blood clots are involved. The Visi-Lyser also allows an improved and more efficient means of removing fundal pools of clotted blood and tissue.
Sales Literature
Sales literature for Medquip, Inc. remains to be developed.
Sourcing
Primary raw materials needed for Medquip products are as follows:
- Molded plastic parts.
- The tooling and molds (capital expenditure).
- Band material (polymer).
- Small electric motor.
All of these components are easily sourced and multiple suppliers have been identified. In addition, injection molders have been identified to manufacture the molded components for Medquip products. There are multiple potential sources.
A potential source for additional research and design help and compliance is Valnet in Puerto Rico.
Medquip will perform final assembly and distribution from its own facility in Puerto Rico or utilizing contract manufacturing depending on the extent of financial support from the government of Puerto Rico.
Technology
Sidley and Austin is patent attorney for Medquip, Inc. Seven patents have been authored and filed. All patents take into account both offensive and defensive postures in their claims. Opinion of legal counsel is strong and firm that all of Medquip’s patent applications are enforceable and defensible.
The principal areas (general descriptions) of the patents applied for are as follows:
- The ligating band itself.
- The movable dispenser.
- The dispenser itself.
- Two additional alternative dispensers.
- The tissue dissolving device.
- The transporting catheter.
- The dispenser control device.
Care has been taken to take into account all potential claims of the inventions as well as to protect them from possible competition from other technologies (including inferior ones). All patent application documents are available for examination by potential investors. The first document is entitled “A ligating structure having greater stretchability, greater shelf life, and greater ligating characteristics and method of manufacture.” It lists more than 40 independent claims.
Also available is the assignment of all patents in the medical device field (above listed and future developed) by Eric Smith to Medquip, Inc. The first four patents listed above relate to the Visi-Band. The last two relate to the Visi-Gator.
Trademark application has been filed on the name Medquip. Trademark applications are in process on the names Visi-Band, Visi-Gator, and Visi-Lyser. No conflicts or other use of these names has been found in an initial search.
Future Products
Plans for future development by Medquip include additional ideas and technologies to be created by Eric Smith as VP of R&D for Medquip. In addition Medquip may seek to acquire technologies developed by others once it attains sufficient capitalization to do so. It is the objective of Medquip to both innovate and market its products. Once an industry reputation has been achieved and marketing channels opened expansion into other medical device areas becomes potentially rewarding.
A recent article in Red Herring indicates the bio-tech field in general is a current hotbed of activity and most of the companies involved are early-stage development companies.
Market Analysis Summary
The two key factors influencing discussion of Medquip Inc.’s market are the medical procedures and product usage statistics and the customer or chain of distribution considerations.
In both cases the trends are upwards in the favor of Medquip. Banding is growing rapidly replacing sclerotherapy and managed care stresses lowest cost of total treatment. The following sections explain how both offer great market potential to Medquip.
Market Segmentation
The potential customers of Medquip, Inc. are both domestic and foreign.
Domestic customers include managed care groups, hospital buying groups, physician groups, independent physicians, and other (catalogues) and medical supply houses. The market is dominated by managed care groups. More than 50% of all purchases of medical devices are made by these groups and that is forecast to reach 75% by the year 2000.
The foreign market includes many of the above segments but also includes key distributors. For example, only four distributors are required to penetrate the European, Middle Eastern, African, Central and South American and Japanese markets. These distributors have already been identified.
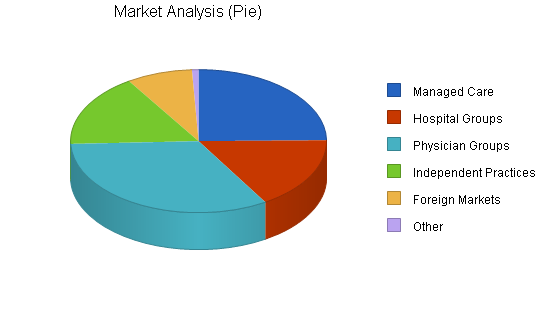
The following chart illustrates the approximate total number of these buying groups that exist. But initial concentration may be more defined by targeting the largest 50 customers in each segment. This data is clearly definable and available.
| Market Analysis | |||||||
| Year 1 | Year 2 | Year 3 | Year 4 | Year 5 | |||
| Potential Customers | Growth | CAGR | |||||
| Managed Care | 25% | 300 | 375 | 469 | 586 | 733 | 25.02% |
| Hospital Groups | 10% | 200 | 220 | 242 | 266 | 293 | 10.02% |
| Physician Groups | 10% | 400 | 440 | 484 | 532 | 585 | 9.97% |
| Independent Practices | 0% | 200 | 200 | 200 | 200 | 200 | 0.00% |
| Foreign Markets | 50% | 100 | 150 | 225 | 338 | 507 | 50.06% |
| Other | 0% | 10 | 10 | 10 | 10 | 10 | 0.00% |
| Total | 17.77% | 1,210 | 1,395 | 1,630 | 1,932 | 2,328 | 17.77% |
Industry Analysis
The health care industry in the United States has been dominated by managed care and hospital buying groups. Lowest total cost treatment has been the evolution of the pricing model. Medquip is ideally positioned to capitalize on this trend. There has been a rapid trend to endoscopic variceal ligation from the previous norm of sclerotherapy for the following reasons:
- Fewer post-op complications.
- Better control of bleeding.
- Lower risk of re-bleeding.
- Reduction of over-all treatment cost.
- Positioned ideally for managed care.
- Current research studies available.
The growth of banding has been as high as 30% per quarter according to IMI. The top 25 to 50 customers in each market category may account for as much as 70% of the potential business, making it easy to target customers with a multi-channel tiered strategy. The foreign markets may be penetrated initially with as few as four key distributors.
Competition and Buying Patterns
Large companies with established brand names and distribution patterns have a distinct advantage in the medical device arena. But new small companies are succeeding on a regular basis dependent on their technology and its over-all cost-of-treatment advantages. Product cost in and of itself is not paramount but education and training are. The product must deliver performance as promised in order to do a procedure more effectively with the fewest complications.
Time saving and effectiveness are the key economic parameters. Medquip will succeed based upon the capability of its products. They are already competitively priced…except they are more effective. After initial market resistance to any new product, Medquip’s products can grow to dominate a market segment…in this case distinct surgical applications.
Variceal ligation is a huge and growing market. The market for the band dispenser is a currently existing one with accurate, up-to-date data from IMI. This clearly defined market represents one of the fastest growing segments in the medical device industry. The reason is that doctors are transitioning rapidly from the old and traditional sclerotherapy surgical protocol to banding procedures.
The entire endoscopic market is a $1 billion annual market. Nationally, upper GI endoscopy accounts for more than 1.2 million procedures per year according to MDI. The trend from endoscopic sclerotherapy (ES) to endoscopic variceal ligation (EVL) has been rapid.
In dollars the Endoscopy–Misc. Supplies category has been growing by 30% per quarter. The most recent qtr. ending June ‘97 was $18.8 million (IMI). The market segment exceeds $70 million in annual sales. This growth can be pegged almost exclusively to the market share gained by EVL at the expense of ES. Best estimates indicate that the percent of EVL procedures to total procedures is still in the 30% to 40% range. Thus, the potential market for EVL could be as high as $180 million.
Main Competitors
The most important competitor to be considered is Microvasive (Boston Scientific). Its strengths are its reputation, current market position, and its entrenched loyalty among physicians using its products. Its weakness is that it is not particularly innovative, normally depending on other companies to develop and perfect its technologies. This makes it vulnerable to a new, improved entry.
Eric Smith did significant design work for the company that perfected the Speedband for Microvasive. He is well aware of the performance gaps in the product.
Industry Participants
The major companies in the endoscopic device field directly competitive with Medquip proposed products are Microvasive (Boston Scientific), Bard, and Wilson-Cook. No manufacturer has a product competitive with the Visi-Gator although a company like Johnson and Johnson could be a likely joint venture partner or licensee.
Managed care providers such as Humana, Kaiser, Blue Cross, etc. are easily identified. Hospital groups are also easily identified as are physician groups.
However, buying methods are diverse, and there is significant overlap of decision making between these segments. That is why it is imperative that Medquip have an experienced CEO and an experienced Sales and Marketing Manager to effectively attack these channels.
Distribution Patterns
Distribution patterns in the health care industry are such that the large buying groups dictate what products are used for certain procedures throughout their sphere of influence. Thus, our products could be mandated or forced out for thousands of patients due to their health plan or hospital group. Others recommend several alternatives which require physician education and intervention, similar to pharmaceuticals.
Distributors are key for foreign markets.
Strategy and Implementation Summary
Medquip, Inc. will pursue specific, definable, market segments with a multi-tiered, multi-channel approach. We will leverage our technologies with a licensing agreement in one key area and a direct sales and distribution strategy in the other using established distributors.
We will look to foreign markets first with established distributors for initial revenue. Domestic revenue will follow. Large groups and plans will be targeted first.
Marketing Strategy
Marketing will follow from industry and trade and physician awareness campaigns to specific executions directed at specific customer segments. The top tier of 20 to 30 customers in each segment will be attacked first. Only a few sales hits in these top tiers will enable achievement of targeted forecasts. Medquip will achieve its initial sales goals from direct and distributed sales of the Visi-Band. This product is targeted first since it is an existing, well-defined market and 510k approval is anticipated. Worldwide sales through distributors will provide needed cash flow.
Promotion Strategy
Public relations, industry media, will help in over-all industry awareness plans. Feature articles and product reviews will help launch awareness. Direct mail to buying groups and ads in trade publications will help with buyer impressions. Finally, all will be integrated with physician materials and training video tapes once approval has been obtained to increase point-of-surgery usage.
Medquip has already worked closely with physicians to design its products. The importance of working with physicians is well known. As an outgrowth of our Physician Advisory Board, Medquip will actively recruit allied physicians with sponsored events and seminars. Every major market area will be targeted. An annual event will also be sponsored.
Pricing Strategy
Pricing for the Visi-Band is $250 per unit. Terms are 2% 10 days, net 30. All collections in this plan for cash flow purposes are based on an average 45 day collection span. Our 80% gross margin allows for factoring receivables if that should become viable or necessary.
A 30% discount will be offered to distributors. Quantity discounts are not included but remain possible in negotiations with major buying groups.
The Visi-Gator is priced in two components:
- The motorized unit at $1,000.
- The cutting/irrigation/suction component at $200 (disposable).
Note: These are suggested retail prices. They represent ten times our estimated cost of manufacture. However, the strategy is to license these products for a 10% royalty. Pricing would be negotiated with the licensee.
Sales Strategy
Medquip’s sales strategy is to open foreign markets on a limited basis at the end of ’98. To fully exploit them in ’99 along with initial penetration of the US market with the Visi-Band (assuming 510k approval). Then to grow both markets in 2000 up to a 10% penetration.
Additionally, the strategy is to license the Visi-Gator to a major company such as J&J due to its increased regulatory requirements and initial marketing costs due to the fact that it is a new segment entry. The objective for the license is a $500,000 fee, $500,000 in advance royalties and a 10% royalty level per unit. Royalty projections are included in ’99 and ’00 sales forecasts.
Sales Forecast
This sales forecast includes small unit sales into the international market. The product is the Visi-Band. Unit sales are at $250 US. Product cost of direct sales is 20% while product cost through distributors is 50%.
It is important to note that $500k license fee and $500k advance royalties are the target figures for a license on the Visi-Gator. If these figures are not attainable or turn out to be a lesser number (but still acceptable to the Medquip board) then they should not be considered for cash flow purposes.
Investment money sought for Medquip will still be based on a sales forecast that does not include a successful license sale.

| Sales Forecast | |||
| Year 1 | Year 2 | Year 3 | |
| Sales | |||
| Visi-Band (direct) | $61,750 | $1,300,000 | $5,200,000 |
| Visi-Band (distributor) | $136,500 | $3,600,000 | $16,250,000 |
| Other | $0 | $0 | $0 |
| Total Sales | $198,250 | $4,900,000 | $21,450,000 |
| Direct Cost of Sales | Year 1 | Year 2 | Year 3 |
| Visi-Band (direct) | $12,350 | $260,000 | $1,040,000 |
| Visi-Band (distributor) | $50,505 | $1,332,000 | $6,012,500 |
| Other | $0 | $0 | $0 |
| Subtotal Direct Cost of Sales | $62,855 | $1,592,000 | $7,052,500 |
Sales Programs
Sales programs include direct wholesale sales to international distributors. Sales materials, video training tapes, and support materials will be produced. Physician materials will be included.
Direct sales will be by personal contact, direct mail, public relations, and media directed at key industry segments.
In addition electronic marketing will be deployed whenever it fits with the buying patterns of a key group.
A website and electronic commerce site will be utilized to cultivate direct sales to key industry groups.
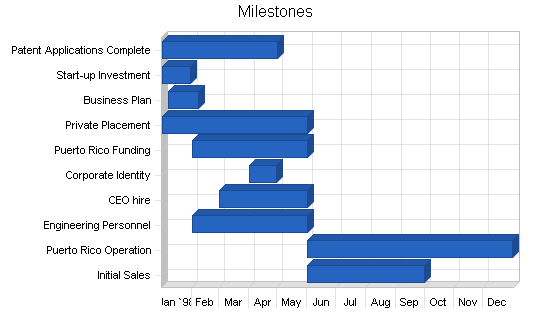
Milestones
The following are the key milestones for the first year of operations.
- All patents will be applied for by the May 1st date. The total legal fees are expected to be less than the $50k allocated.
- Start-up capital was successfully raised.
- The business plan has been completed.
- The government of Puerto Rico has been presented on April 8, 1998.
- All other first year milestones are currently on target time wise and budget wise.
| Milestones | |||||
| Milestone | Start Date | End Date | Budget | Manager | Department |
| Patent Applications Complete | 1/1/1998 | 5/1/1998 | $50,000 | Smith | R&D |
| Start-up Investment | 1/1/1998 | 1/30/1998 | $0 | Jones | Finance |
| Business Plan | 1/7/1998 | 2/7/1998 | $3,000 | Jones | Finance |
| Private Placement | 1/1/1998 | 6/1/1998 | $0 | Jones | Finance |
| Puerto Rico Funding | 2/1/1998 | 6/1/1998 | $0 | Jones | Finance |
| Corporate Identity | 4/1/1998 | 4/30/1998 | $975 | Jones | Finance |
| CEO hire | 3/1/1998 | 6/1/1998 | $50,000 | Jones | G&A |
| Engineering Personnel | 2/1/1998 | 6/1/1998 | $0 | Smith | R&D |
| Puerto Rico Operation | 6/1/1998 | 12/31/1998 | $1,000,000 | Smith | R&D |
| Initial Sales | 6/1/1998 | 10/1/1998 | $0 | CEO | Marketing |
| Totals | $1,103,975 | ||||
Management Summary
The founders of Medquip, Inc. are Eric Smith and Timothy R. Jones. Eric will serve the company as Vice-President of Research & Development. Tim will serve as Vice-President of Corporate Development. Their biographies follow in the Management Team section.
Several key people are actively being sought. These are summarized in Management Team Gaps.
Organizational Structure
Medquip, Inc. will have a CEO to be recruited (see Management Team Gaps) who will have Eric Smith reporting to him as well as Timothy R. Jones and a V.P. of Sales and Marketing (see Management Team Gaps).
Eric will handle responsibility for R&D, design, compliance, and initial manufacturing and sourcing.
Tim will handle strategic growth plans, capitalization, and serve as CFO initially.
Reporting to Eric will be additional design engineers and compliance documentation personnel. Some of these tasks can also be handled by outside consultants in the early going. The ramp-up of essential personnel and tasks are included in the Personnel Plan that follows.
Management Team
Eric Smith (40)
BS, Mechanical Engineering, M.I.T., 1980
Eric Smith began his training in mechanical engineering at MIT and has a broad background in leading edge medical, semiconductor, biotechnology, and cleanroom product design and management. Creatively integrating technologies from diverse fields and transforming these elements into world class product solutions is his specialty. He has spent the past two years developing two medical devices, a full visibility ligating band dispenser and a revolutionary tissue dissolving lysis technology. Recent accomplishments include innovations for the Boston Scientific Speedband multiple ligating band dispenser. He was also responsible for the mechanism design of the Boston Scientific Corp. Alliance esophageal balloon inflation device through their supplier, ACT Medical Corp. Both devices have rapidly attained significantly greater than a 50% world market share for Boston Scientific Corp. Smith pioneered the application of high-energy particle beams to titanium hip and knee implants to increase their life by a factor of ten and for this work received an Industrial Research and Development IR100 award for one of the 100 best technology products. He initiated the development of a peritoneal dialysis system for Millipore Corporation, which incorporated ultra pure water and sterile connection technologies. Earlier research and development on the first Nitinol blood clot filter at Harvard Medical School was in cooperation with Dr. Morris Simon. Mr. Smith also was a founder of ABS, Inc., in 1995, a bio remediation products company currently manufacturing and cross licensing technology sold worldwide.
Ten United States Patents have been issued to Smith to date. Several more have also been granted internationally. A total of sixty-four subsequent United States patents granted to corporations including IBM, Medtronics, Northrop Grumman, Applied Materials, Eaton, Hitachi, and others cite these ten patents granted to Smith, a strong indication of the strategic significance of his diverse body of work. A number of biotechnology patent applications are currently being prosecuted in the United States and in several other countries. Patents issued to Smith include a medical X-ray system, clean room laminar airflow systems, chemical and thermal transfer processes, and robotic mechanisms for semiconductor and medical particle accelerators used worldwide by leading corporations such as Intel, IBM, Hitachi, Fujitsu, Motorola. A detailed list is below.
Mr. Smith has led new product developments for the past 17 years as Director of Engineering and Technology and various Research and Development positions. He led the systems design team for a $3 million production particle accelerator with a $50 million product development budget as Mechanical Systems Manager for Varian Associates, a large multinational technology corporation. He has managed an international staff of engineers and successfully transferred leading edge technology from Far East joint venture partners. His responsibilities have also included manufacturing management for a supplier of critical production equipment to IBM, Intel, and Eastman Kodak CD. Systems plagued by months of installation, rework, and errors performed flawlessly the first time and every time at Intel wafer fabrication cleanrooms after Smith re-designed the product and assumed full manufacturing responsibility.
An invited speaker at a worldwide technical conference in Kyoto, Japan, publications include a recent cover story for “Cleanrooms” magazine, and numerous technical articles related to high purity manufacturing, robotics, heat transfer, and mechanism designs.
United States Patent Numbers and Titles Currently Issued to Eric Smith as inventor:
5040484 Apparatus for retaining wafers [Semiconductor].
4997606 Methods and apparatus for fabricating a high purity thermally-conductive polymer.
4927438 Horizontal laminar air flow work station [Semiconductor and medical applications].
4899059 Disk scanning apparatus for batch ion implanters.
4836733 Wafer transfer system [Robot].
4832781 Methods and apparatus for thermal transfer with a semiconductor wafer in a vacuum.
4817556 Apparatus for retaining wafers.
4580058 Scanning treatment apparatus [Application: human hip and knee implants].
4531821 Item transporting [medical X-ray].
Timothy R. Jones (50)
BBA, Marketing, U. of Notre Dame, 1970
MBA, Finance, Executive Program, Loyola University, 1972
Mr. Jones has more than 27 years of business management experience. He is the founder of Plinth Capital in Ourtown, USA. He has successfully assisted early stage companies in capital formation, strategic planning, and business growth. His background includes management positions with two Fortune 500 companies, Lever Brothers Company, and the LCR Division of Squibb, Inc. Mr. Jones has previously been an executive in three start-up ventures and one turn-around.
His experience includes working with two investment banking firms, one that focused on privately held companies and the other on early stage publicly traded companies in development stage. Additionally, the management team of Medquip, Inc. includes a physician advisory board which is already being assembled. The Board of Directors is currently open.
Management Team Gaps
An experienced CEO is actively being sought. Timothy Jones is presently conducting the search. The desired profile is for a CEO experienced in the medical device arena, ideally who was part of a previous start-up venture that grew to exceed a minimum of $20 million in sales and had a successful exit strategy.
The CEO will help to identify and bring in a VP of Sales and Marketing.
Eric Smith is actively searching for design engineers and consultants. Several have been identified and are available.
Personnel Plan
The Personnel Plan chronicles the growth of the organization to 31 employees in the first three years. The third year could require a few additional people besides those indicated especially if sales reach or exceed $20 million. Production assembly people are grouped together at approx. $15k per person. Payroll costs and benefits are pegged at 22% although they could be lower in Puerto Rico.
| Personnel Plan | |||
| Year 1 | Year 2 | Year 3 | |
| Production Personnel | |||
| Production Manager | $20,000 | $60,000 | $64,000 |
| Assembly Workers | $24,000 | $72,000 | $90,000 |
| Subtotal | $44,000 | $132,000 | $154,000 |
| Sales and Marketing Personnel | |||
| VP Sales & Marketing | $30,000 | $60,000 | $66,000 |
| Sales Manager | $20,000 | $50,000 | $55,000 |
| Field Sales Mgr. | $0 | $0 | $56,000 |
| Marketing/Product Mgr. | $0 | $0 | $55,000 |
| Sales Reps (3) | $0 | $0 | $144,000 |
| Sales Administrator | $8,000 | $24,000 | $26,500 |
| Subtotal | $58,000 | $134,000 | $402,500 |
| General and Administrative Personnel | |||
| CEO | $56,000 | $96,000 | $110,000 |
| VP Corp Development | $42,000 | $55,000 | $60,000 |
| CFO | $0 | $84,000 | $90,000 |
| Executive Assistant | $16,800 | $30,000 | $32,000 |
| Executive Secretary | $0 | $0 | $24,000 |
| Controller | $25,200 | $45,000 | $48,000 |
| Administrative Staff (4) | $0 | $0 | $88,000 |
| Subtotal | $140,000 | $310,000 | $452,000 |
| Other Personnel | |||
| VP Research & Dev. | $42,000 | $55,000 | $60,000 |
| Design Engineer | $42,000 | $84,000 | $88,000 |
| Compliance Specialist | $24,000 | $47,000 | $50,000 |
| Junior Engineer | $16,000 | $40,000 | $45,000 |
| Research Engineers (3) | $0 | $0 | $140,000 |
| Subtotal | $124,000 | $226,000 | $383,000 |
| Total People | 0 | 0 | 0 |
| Total Payroll | $366,000 | $802,000 | $1,391,500 |
Financial Plan
The value of the patents and the size of their potential markets enables several back-up plans of action if this plan doesn’t work as indicated. Venture funds are available early on and historically investments of $3 to $5 million are common for similar companies.
Even after successfully completing the start and seed stage as indicated, second round venture or mezzanine funding is potentially available in the $5 million range. We have planned for additional capital input in years two and three as a safety net for cash flow/cash balance.
However, cash flow achievement within the parameters of the indicated plan plus further funding on the senior debt side will lead to the best value for shareholders. Then, strategy can dictate the best valuation for ramp-up and roll-out.
Important Assumptions
The following are the key financial assumptions for this plan. However, it’s important to note that several of the assumptions could be considerably less than those indicated if the business is located in Puerto Rico. The personnel burden could go from 22% to 12%. The short term interest rate could go from 10% to 5% or less. The tax rate could go from 25% to less than 10%. So, all of the bottom line projections in this plan could improve appreciably.
However, the plan is still based on the following assumptions as if it were a U.S. based Georgia operation.
| General Assumptions | |||
| Year 1 | Year 2 | Year 3 | |
| Plan Month | 1 | 2 | 3 |
| Current Interest Rate | 10.00% | 10.00% | 10.00% |
| Long-term Interest Rate | 10.00% | 10.00% | 10.00% |
| Tax Rate | 0.00% | 30.00% | 30.00% |
| Other | 0 | 0 | 0 |
Key Financial Indicators
All of our benchmarks being attained will allow expansion strategies of merger, acquisition, roll-up or IPO. The following chart illustrates our planned performance in the most critical profit variables.

Break-even Analysis
Medquip, Inc. has calculated a break-even maintenance point for sales once full management staffing and facility costs are reached. Included are payroll and rent considerations.
The break-even target can sustain Medquip, Inc. in operation in late ’98 and throughout ’99 even if expansion and capitalization plans are late in materializing. It is anticipated that direct sales can produce these numbers and more in Europe, Middle Eastern, and African markets since those markets are not as dominated by managed care, there is more direct purchasing. A distributor has been identified for those markets as well as a distributor for Latin and South America, and a distributor for Japan. No Japanese sales are included, however, since regulatory barriers are more pronounced there.
The break-even analysis is restricted to this late ’98 and early ’99 time frame since the early ramp-up phase in business development is characteristic of most cash-flow shortages that represent exposure to early stage investors.

| Break-even Analysis | |
| Monthly Revenue Break-even | $198,088 |
| Assumptions: | |
| Average Percent Variable Cost | 32% |
| Estimated Monthly Fixed Cost | $135,284 |
Projected Profit and Loss
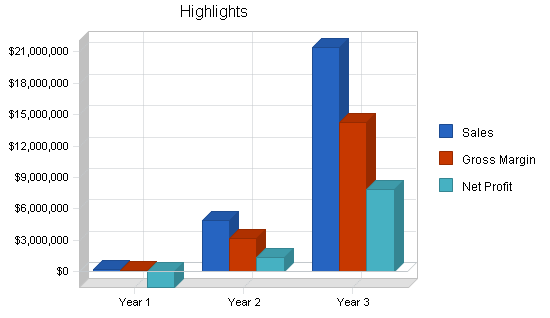
The profit in each of the first two years of operation is expected to be minimal. However that includes $1 million in revenue in the first year from the sale of a license. If that does not occur, then over $800k will be burned in year one. That must come from investment infusion. The third year profit reflects the performance of a mature company. Over-all gross margins are excellent.


| Pro Forma Profit and Loss | |||
| Year 1 | Year 2 | Year 3 | |
| Sales | $198,250 | $4,900,000 | $21,450,000 |
| Direct Cost of Sales | $62,855 | $1,592,000 | $7,052,500 |
| Production Payroll | $44,000 | $132,000 | $154,000 |
| Other Costs of Sales | $0 | $0 | $0 |
| Total Cost of Sales | $106,855 | $1,724,000 | $7,206,500 |
| Gross Margin | $91,395 | $3,176,000 | $14,243,500 |
| Gross Margin % | 46.10% | 64.82% | 66.40% |
| Operating Expenses | |||
| Sales and Marketing Expenses | |||
| Sales and Marketing Payroll | $58,000 | $134,000 | $402,500 |
| Advertising/Promotion | $16,000 | $150,000 | $700,000 |
| Travel | $13,000 | $66,000 | $88,000 |
| Miscellaneous | $6,000 | $15,000 | $24,000 |
| Total Sales and Marketing Expenses | $93,000 | $365,000 | $1,214,500 |
| Sales and Marketing % | 46.91% | 7.45% | 5.66% |
| General and Administrative Expenses | |||
| General and Administrative Payroll | $140,000 | $310,000 | $452,000 |
| Marketing/Promotion | $0 | $0 | $0 |
| Depreciation | $0 | $0 | $0 |
| Leased Equipment | $1,000,000 | $0 | $500,000 |
| Rent | $58,950 | $75,000 | $95,000 |
| Utilities | $5,000 | $6,000 | $7,000 |
| Insurance | $39,000 | $45,000 | $51,000 |
| Legal Expenses | $93,563 | $36,000 | $36,000 |
| Payroll Taxes | $54,900 | $120,300 | $208,725 |
| Other General and Administrative Expenses | $0 | $0 | $0 |
| Total General and Administrative Expenses | $1,391,413 | $592,300 | $1,349,725 |
| General and Administrative % | 701.85% | 12.09% | 6.29% |
| Other Expenses: | |||
| Other Payroll | $124,000 | $226,000 | $383,000 |
| Consultants | $0 | $0 | $0 |
| Contract/Consultants | $15,000 | $30,000 | $60,000 |
| Total Other Expenses | $139,000 | $256,000 | $443,000 |
| Other % | 70.11% | 5.22% | 2.07% |
| Total Operating Expenses | $1,623,413 | $1,213,300 | $3,007,225 |
| Profit Before Interest and Taxes | ($1,532,018) | $1,962,700 | $11,236,275 |
| EBITDA | ($1,532,018) | $1,962,700 | $11,236,275 |
| Interest Expense | $5,000 | $55,000 | $51,250 |
| Taxes Incurred | $0 | $572,310 | $3,355,508 |
| Net Profit | ($1,537,018) | $1,335,390 | $7,829,518 |
| Net Profit/Sales | -775.29% | 27.25% | 36.50% |
Projected Cash Flow
We began the year with $128,000 in cash from initial sales of shares to investors. This provided our start-up capital. The private placement to 13 or fewer investors is expected to bring in another $450,000 in May and $400,000 in June. We are targeting an additional equity investment from Puerto Rico and long term loans.
Thus, our cash flow will be sufficient in year one even if we can’t conclude a licensing agreement.
Second round financing will include venture, mezzanine, or IPO options. If sales and profits hit targets then further investment needs will be limited to higher value options to roll-up a national level and world-wide company.

| Pro Forma Cash Flow | |||
| Year 1 | Year 2 | Year 3 | |
| Cash Received | |||
| Cash from Operations | |||
| Cash Sales | $69,388 | $1,715,000 | $7,507,500 |
| Cash from Receivables | $32,955 | $910,432 | $5,936,098 |
| Subtotal Cash from Operations | $102,343 | $2,625,432 | $13,443,598 |
| Additional Cash Received | |||
| Sales Tax, VAT, HST/GST Received | $0 | $0 | $0 |
| New Current Borrowing | $0 | $0 | $125,000 |
| New Other Liabilities (interest-free) | $600,000 | $0 | $0 |
| New Long-term Liabilities | $600,000 | $0 | $0 |
| Sales of Other Current Assets | $0 | $0 | $0 |
| Sales of Long-term Assets | $0 | $0 | $0 |
| New Investment Received | $850,000 | $1,869,000 | $0 |
| Subtotal Cash Received | $2,152,343 | $4,494,432 | $13,568,598 |
| Expenditures | Year 1 | Year 2 | Year 3 |
| Expenditures from Operations | |||
| Cash Spending | $366,000 | $802,000 | $1,391,500 |
| Bill Payments | $734,012 | $3,853,163 | $12,379,035 |
| Subtotal Spent on Operations | $1,100,012 | $4,655,163 | $13,770,535 |
| Additional Cash Spent | |||
| Sales Tax, VAT, HST/GST Paid Out | $0 | $0 | $0 |
| Principal Repayment of Current Borrowing | $0 | $0 | $0 |
| Other Liabilities Principal Repayment | $0 | $600,000 | $0 |
| Long-term Liabilities Principal Repayment | $0 | $100,000 | $100,000 |
| Purchase Other Current Assets | $0 | $0 | $0 |
| Purchase Long-term Assets | $0 | $0 | $0 |
| Dividends | $0 | $0 | $0 |
| Subtotal Cash Spent | $1,100,012 | $5,355,163 | $13,870,535 |
| Net Cash Flow | $1,052,331 | ($860,731) | ($301,937) |
| Cash Balance | $1,180,331 | $319,600 | $17,663 |
Projected Balance Sheet
The highlights of the balance sheets are a solid cash position and net worth at the end of year three.
| Pro Forma Balance Sheet | |||
| Year 1 | Year 2 | Year 3 | |
| Assets | |||
| Current Assets | |||
| Cash | $1,180,331 | $319,600 | $17,663 |
| Accounts Receivable | $95,908 | $2,370,475 | $10,376,877 |
| Inventory | $29,250 | $740,848 | $1,688,348 |
| Other Current Assets | $0 | $0 | $0 |
| Total Current Assets | $1,305,488 | $3,430,923 | $12,082,888 |
| Long-term Assets | |||
| Long-term Assets | $0 | $0 | $0 |
| Accumulated Depreciation | $0 | $0 | $0 |
| Total Long-term Assets | $0 | $0 | $0 |
| Total Assets | $1,305,488 | $3,430,923 | $12,082,888 |
| Liabilities and Capital | Year 1 | Year 2 | Year 3 |
| Current Liabilities | |||
| Accounts Payable | $664,506 | $285,551 | $1,082,999 |
| Current Borrowing | $0 | $0 | $125,000 |
| Other Current Liabilities | $600,000 | $0 | $0 |
| Subtotal Current Liabilities | $1,264,506 | $285,551 | $1,207,999 |
| Long-term Liabilities | $600,000 | $500,000 | $400,000 |
| Total Liabilities | $1,864,506 | $785,551 | $1,607,999 |
| Paid-in Capital | $1,108,000 | $2,977,000 | $2,977,000 |
| Retained Earnings | ($130,000) | ($1,667,018) | ($331,628) |
| Earnings | ($1,537,018) | $1,335,390 | $7,829,518 |
| Total Capital | ($559,018) | $2,645,372 | $10,474,890 |
| Total Liabilities and Capital | $1,305,488 | $3,430,923 | $12,082,888 |
| Net Worth | ($559,018) | $2,645,372 | $10,474,890 |
Business Ratios
By year three the return on equity should be very attractive to early investors. All ratios are in good shape for traditional borrowing to fund further growth. Industry profile ratios based on the Standard Industrial Classification (SIC) code 3841, Surgical and Medical Instruments, are shown for comparison.
| Ratio Analysis | ||||
| Year 1 | Year 2 | Year 3 | Industry Profile | |
| Sales Growth | n.a. | 2371.63% | 337.76% | 4.20% |
| Percent of Total Assets | ||||
| Accounts Receivable | 7.35% | 69.09% | 85.88% | 25.30% |
| Inventory | 2.24% | 21.59% | 13.97% | 14.90% |
| Other Current Assets | 0.00% | 0.00% | 0.00% | 42.70% |
| Total Current Assets | 100.00% | 100.00% | 100.00% | 82.90% |
| Long-term Assets | 0.00% | 0.00% | 0.00% | 17.10% |
| Total Assets | 100.00% | 100.00% | 100.00% | 100.00% |
| Current Liabilities | 96.86% | 8.32% | 10.00% | 39.60% |
| Long-term Liabilities | 45.96% | 14.57% | 3.31% | 18.10% |
| Total Liabilities | 142.82% | 22.90% | 13.31% | 57.70% |
| Net Worth | -42.82% | 77.10% | 86.69% | 42.30% |
| Percent of Sales | ||||
| Sales | 100.00% | 100.00% | 100.00% | 100.00% |
| Gross Margin | 46.10% | 64.82% | 66.40% | 53.30% |
| Selling, General & Administrative Expenses | 821.39% | 37.56% | 29.90% | 34.40% |
| Advertising Expenses | 8.07% | 3.06% | 3.26% | 1.50% |
| Profit Before Interest and Taxes | -772.77% | 40.06% | 52.38% | 5.10% |
| Main Ratios | ||||
| Current | 1.03 | 12.02 | 10.00 | 2.00 |
| Quick | 1.01 | 9.42 | 8.60 | 1.33 |
| Total Debt to Total Assets | 142.82% | 22.90% | 13.31% | 57.70% |
| Pre-tax Return on Net Worth | 274.95% | 72.11% | 106.78% | 5.80% |
| Pre-tax Return on Assets | -117.74% | 55.60% | 92.57% | 13.80% |
| Additional Ratios | Year 1 | Year 2 | Year 3 | |
| Net Profit Margin | -775.29% | 27.25% | 36.50% | n.a |
| Return on Equity | 0.00% | 50.48% | 74.75% | n.a |
| Activity Ratios | ||||
| Accounts Receivable Turnover | 1.34 | 1.34 | 1.34 | n.a |
| Collection Days | 46 | 141 | 167 | n.a |
| Inventory Turnover | 12.00 | 4.13 | 5.81 | n.a |
| Accounts Payable Turnover | 2.10 | 12.17 | 12.17 | n.a |
| Payment Days | 27 | 50 | 19 | n.a |
| Total Asset Turnover | 0.15 | 1.43 | 1.78 | n.a |
| Debt Ratios | ||||
| Debt to Net Worth | 0.00 | 0.30 | 0.15 | n.a |
| Current Liab. to Liab. | 0.68 | 0.36 | 0.75 | n.a |
| Liquidity Ratios | ||||
| Net Working Capital | $40,982 | $3,145,372 | $10,874,890 | n.a |
| Interest Coverage | -306.40 | 35.69 | 219.24 | n.a |
| Additional Ratios | ||||
| Assets to Sales | 6.59 | 0.70 | 0.56 | n.a |
| Current Debt/Total Assets | 97% | 8% | 10% | n.a |
| Acid Test | 0.93 | 1.12 | 0.01 | n.a |
| Sales/Net Worth | 0.00 | 1.85 | 2.05 | n.a |
| Dividend Payout | 0.00 | 0.00 | 0.00 | n.a |
Appendix
| Sales Forecast | |||||||||||||
| Month 1 | Month 2 | Month 3 | Month 4 | Month 5 | Month 6 | Month 7 | Month 8 | Month 9 | Month 10 | Month 11 | Month 12 | ||
| Sales | |||||||||||||
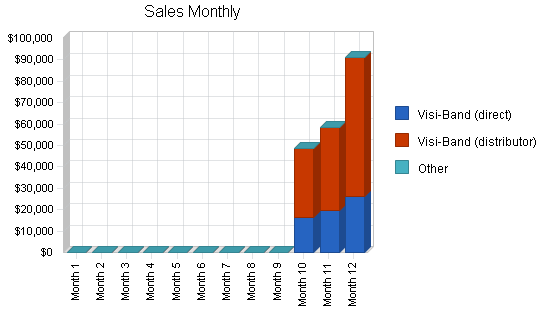
| Visi-Band (direct) | 0% | $0 | $0 | $0 | $0 | $0 | $0 | $0 | $0 | $0 | $16,250 | $19,500 | $26,000 |
| Visi-Band (distributor) | 0% | $0 | $0 | $0 | $0 | $0 | $0 | $0 | $0 | $0 | $32,500 | $39,000 | $65,000 |
| Other | 0% | $0 | $0 | $0 | $0 | $0 | $0 | $0 | $0 | $0 | $0 | $0 | $0 |
| Total Sales | $0 | $0 | $0 | $0 | $0 | $0 | $0 | $0 | $0 | $48,750 | $58,500 | $91,000 | |
| Direct Cost of Sales | Month 1 | Month 2 | Month 3 | Month 4 | Month 5 | Month 6 | Month 7 | Month 8 | Month 9 | Month 10 | Month 11 | Month 12 | |
| Visi-Band (direct) | $0 | $0 | $0 | $0 | $0 | $0 | $0 | $0 | $0 | $3,250 | $3,900 | $5,200 | |
| Visi-Band (distributor) | $0 | $0 | $0 | $0 | $0 | $0 | $0 | $0 | $0 | $12,025 | $14,430 | $24,050 | |
| Other | $0 | $0 | $0 | $0 | $0 | $0 | $0 | $0 | $0 | $0 | $0 | $0 | |
| Subtotal Direct Cost of Sales | $0 | $0 | $0 | $0 | $0 | $0 | $0 | $0 | $0 | $15,275 | $18,330 | $29,250 | |
| Personnel Plan | |||||||||||||
| Month 1 | Month 2 | Month 3 | Month 4 | Month 5 | Month 6 | Month 7 | Month 8 | Month 9 | Month 10 | Month 11 | Month 12 | ||
| Production Personnel | |||||||||||||
| Production Manager | $0 | $0 | $0 | $0 | $0 | $0 | $0 | $0 | $5,000 | $5,000 | $5,000 | $5,000 | |
| Assembly Workers | $0 | $0 | $0 | $0 | $0 | $0 | $0 | $0 | $6,000 | $6,000 | $6,000 | $6,000 | |
| Subtotal | $0 | $0 | $0 | $0 | $0 | $0 | $0 | $0 | $11,000 | $11,000 | $11,000 | $11,000 | |
| Sales and Marketing Personnel | |||||||||||||
| VP Sales & Marketing | $0 | $0 | $0 | $0 | $0 | $0 | $0 | $0 | $7,500 | $7,500 | $7,500 | $7,500 | |
| Sales Manager | $0 | $0 | $0 | $0 | $0 | $0 | $0 | $0 | $5,000 | $5,000 | $5,000 | $5,000 | |
| Field Sales Mgr. | $0 | $0 | $0 | $0 | $0 | $0 | $0 | $0 | $0 | $0 | $0 | $0 | |
| Marketing/Product Mgr. | $0 | $0 | $0 | $0 | $0 | $0 | $0 | $0 | $0 | $0 | $0 | $0 | |
| Sales Reps (3) | $0 | $0 | $0 | $0 | $0 | $0 | $0 | $0 | $0 | $0 | $0 | $0 | |
| Sales Administrator | $0 | $0 | $0 | $0 | $0 | $0 | $0 | $0 | $2,000 | $2,000 | $2,000 | $2,000 | |
| Subtotal | $0 | $0 | $0 | $0 | $0 | $0 | $0 | $0 | $14,500 | $14,500 | $14,500 | $14,500 | |
| General and Administrative Personnel | |||||||||||||
| CEO | $0 | $0 | $0 | $0 | $0 | $8,000 | $8,000 | $8,000 | $8,000 | $8,000 | $8,000 | $8,000 | |
| VP Corp Development | $3,500 | $3,500 | $3,500 | $3,500 | $3,500 | $3,500 | $3,500 | $3,500 | $3,500 | $3,500 | $3,500 | $3,500 | |
| CFO | $0 | $0 | $0 | $0 | $0 | $0 | $0 | $0 | $0 | $0 | $0 | $0 | |
| Executive Assistant | $0 | $0 | $0 | $0 | $0 | $2,400 | $2,400 | $2,400 | $2,400 | $2,400 | $2,400 | $2,400 | |
| Executive Secretary | $0 | $0 | $0 | $0 | $0 | $0 | $0 | $0 | $0 | $0 | $0 | $0 | |
| Controller | $0 | $0 | $0 | $0 | $0 | $3,600 | $3,600 | $3,600 | $3,600 | $3,600 | $3,600 | $3,600 | |
| Administrative Staff (4) | $0 | $0 | $0 | $0 | $0 | $0 | $0 | $0 | $0 | $0 | $0 | $0 | |
| Subtotal | $3,500 | $3,500 | $3,500 | $3,500 | $3,500 | $17,500 | $17,500 | $17,500 | $17,500 | $17,500 | $17,500 | $17,500 | |
| Other Personnel | |||||||||||||
| VP Research & Dev. | $3,500 | $3,500 | $3,500 | $3,500 | $3,500 | $3,500 | $3,500 | $3,500 | $3,500 | $3,500 | $3,500 | $3,500 | |
| Design Engineer | $0 | $0 | $0 | $0 | $0 | $0 | $7,000 | $7,000 | $7,000 | $7,000 | $7,000 | $7,000 | |
| Compliance Specialist | $0 | $0 | $0 | $0 | $0 | $0 | $4,000 | $4,000 | $4,000 | $4,000 | $4,000 | $4,000 | |
| Junior Engineer | $0 | $0 | $0 | $0 | $0 | $0 | $0 | $0 | $4,000 | $4,000 | $4,000 | $4,000 | |
| Research Engineers (3) | $0 | $0 | $0 | $0 | $0 | $0 | $0 | $0 | $0 | $0 | $0 | $0 | |
| Subtotal | $3,500 | $3,500 | $3,500 | $3,500 | $3,500 | $3,500 | $14,500 | $14,500 | $18,500 | $18,500 | $18,500 | $18,500 | |
| Total People | 0 | 0 | 0 | 0 | 0 | 0 | 0 | 0 | 0 | 0 | 0 | 0 | |
| Total Payroll | $7,000 | $7,000 | $7,000 | $7,000 | $7,000 | $21,000 | $32,000 | $32,000 | $61,500 | $61,500 | $61,500 | $61,500 | |
| Pro Forma Profit and Loss | |||||||||||||
| Month 1 | Month 2 | Month 3 | Month 4 | Month 5 | Month 6 | Month 7 | Month 8 | Month 9 | Month 10 | Month 11 | Month 12 | ||
| Sales | $0 | $0 | $0 | $0 | $0 | $0 | $0 | $0 | $0 | $48,750 | $58,500 | $91,000 | |
| Direct Cost of Sales | $0 | $0 | $0 | $0 | $0 | $0 | $0 | $0 | $0 | $15,275 | $18,330 | $29,250 | |
| Production Payroll | $0 | $0 | $0 | $0 | $0 | $0 | $0 | $0 | $11,000 | $11,000 | $11,000 | $11,000 | |
| Other Costs of Sales | $0 | $0 | $0 | $0 | $0 | $0 | $0 | $0 | $0 | $0 | $0 | $0 | |
| Total Cost of Sales | $0 | $0 | $0 | $0 | $0 | $0 | $0 | $0 | $11,000 | $26,275 | $29,330 | $40,250 | |
| Gross Margin | $0 | $0 | $0 | $0 | $0 | $0 | $0 | $0 | ($11,000) | $22,475 | $29,170 | $50,750 | |
| Gross Margin % | 0.00% | 0.00% | 0.00% | 0.00% | 0.00% | 0.00% | 0.00% | 0.00% | 0.00% | 46.10% | 49.86% | 55.77% | |
| Operating Expenses | |||||||||||||
| Sales and Marketing Expenses | |||||||||||||
| Sales and Marketing Payroll | $0 | $0 | $0 | $0 | $0 | $0 | $0 | $0 | $14,500 | $14,500 | $14,500 | $14,500 | |
| Advertising/Promotion | $0 | $0 | $0 | $0 | $0 | $0 | $0 | $0 | $4,000 | $4,000 | $4,000 | $4,000 | |
| Travel | $0 | $0 | $0 | $0 | $5,000 | $0 | $0 | $0 | $2,000 | $2,000 | $2,000 | $2,000 | |
| Miscellaneous | $0 | $0 | $0 | $0 | $0 | $0 | $0 | $0 | $1,500 | $1,500 | $1,500 | $1,500 | |
| Total Sales and Marketing Expenses | $0 | $0 | $0 | $0 | $5,000 | $0 | $0 | $0 | $22,000 | $22,000 | $22,000 | $22,000 | |
| Sales and Marketing % | 0.00% | 0.00% | 0.00% | 0.00% | 0.00% | 0.00% | 0.00% | 0.00% | 0.00% | 45.13% | 37.61% | 24.18% | |
| General and Administrative Expenses | |||||||||||||
| General and Administrative Payroll | $3,500 | $3,500 | $3,500 | $3,500 | $3,500 | $17,500 | $17,500 | $17,500 | $17,500 | $17,500 | $17,500 | $17,500 | |
| Marketing/Promotion | $0 | $0 | $0 | $0 | $0 | $0 | $0 | $0 | $0 | $0 | $0 | $0 | |
| Depreciation | $0 | $0 | $0 | $0 | $0 | $0 | $0 | $0 | $0 | $0 | $0 | $0 | |
| Leased Equipment | $0 | $0 | $0 | $0 | $0 | $0 | $0 | $400,000 | $0 | $0 | $0 | $600,000 | |
| Rent | $2,325 | $2,325 | $2,325 | $2,325 | $2,325 | $2,325 | $7,500 | $7,500 | $7,500 | $7,500 | $7,500 | $7,500 | |
| Utilities | $0 | $0 | $0 | $250 | $250 | $250 | $250 | $800 | $800 | $800 | $800 | $800 | |
| Insurance | $0 | $0 | $0 | $3,000 | $3,000 | $3,000 | $5,000 | $5,000 | $5,000 | $5,000 | $5,000 | $5,000 | |
| Legal Expenses | 0% | $1,050 | $9,890 | $8,123 | $10,000 | $10,000 | $8,000 | $4,800 | $4,800 | $9,225 | $9,225 | $9,225 | $9,225 |
| Payroll Taxes | 15% | $1,050 | $1,050 | $1,050 | $1,050 | $1,050 | $3,150 | $4,800 | $4,800 | $9,225 | $9,225 | $9,225 | $9,225 |
| Other General and Administrative Expenses | $0 | $0 | $0 | $0 | $0 | $0 | $0 | $0 | $0 | $0 | $0 | $0 | |
| Total General and Administrative Expenses | $7,925 | $16,765 | $14,998 | $20,125 | $20,125 | $34,225 | $39,850 | $440,400 | $49,250 | $49,250 | $49,250 | $649,250 | |
| General and Administrative % | 0.00% | 0.00% | 0.00% | 0.00% | 0.00% | 0.00% | 0.00% | 0.00% | 0.00% | 101.03% | 84.19% | 713.46% | |
| Other Expenses: | |||||||||||||
| Other Payroll | $3,500 | $3,500 | $3,500 | $3,500 | $3,500 | $3,500 | $14,500 | $14,500 | $18,500 | $18,500 | $18,500 | $18,500 | |
| Consultants | $0 | $0 | $0 | $0 | $0 | $0 | $0 | $0 | $0 | $0 | $0 | $0 | |
| Contract/Consultants | $0 | $0 | $3,000 | $0 | $0 | $0 | $0 | $0 | $3,000 | $3,000 | $3,000 | $3,000 | |
| Total Other Expenses | $3,500 | $3,500 | $6,500 | $3,500 | $3,500 | $3,500 | $14,500 | $14,500 | $21,500 | $21,500 | $21,500 | $21,500 | |
| Other % | 0.00% | 0.00% | 0.00% | 0.00% | 0.00% | 0.00% | 0.00% | 0.00% | 0.00% | 44.10% | 36.75% | 23.63% | |
| Total Operating Expenses | $11,425 | $20,265 | $21,498 | $23,625 | $28,625 | $37,725 | $54,350 | $454,900 | $92,750 | $92,750 | $92,750 | $692,750 | |
| Profit Before Interest and Taxes | ($11,425) | ($20,265) | ($21,498) | ($23,625) | ($28,625) | ($37,725) | ($54,350) | ($454,900) | ($103,750) | ($70,275) | ($63,580) | ($642,000) | |
| EBITDA | ($11,425) | ($20,265) | ($21,498) | ($23,625) | ($28,625) | ($37,725) | ($54,350) | ($454,900) | ($103,750) | ($70,275) | ($63,580) | ($642,000) | |
| Interest Expense | $0 | $0 | $0 | $0 | $0 | $0 | $0 | $0 | $0 | $0 | $0 | $5,000 | |
| Taxes Incurred | $0 | $0 | $0 | $0 | $0 | $0 | $0 | $0 | $0 | $0 | $0 | $0 | |
| Net Profit | ($11,425) | ($20,265) | ($21,498) | ($23,625) | ($28,625) | ($37,725) | ($54,350) | ($454,900) | ($103,750) | ($70,275) | ($63,580) | ($647,000) | |
| Net Profit/Sales | 0.00% | 0.00% | 0.00% | 0.00% | 0.00% | 0.00% | 0.00% | 0.00% | 0.00% | -144.15% | -108.68% | -710.99% | |
| Pro Forma Cash Flow | |||||||||||||
| Month 1 | Month 2 | Month 3 | Month 4 | Month 5 | Month 6 | Month 7 | Month 8 | Month 9 | Month 10 | Month 11 | Month 12 | ||
| Cash Received | |||||||||||||
| Cash from Operations | |||||||||||||
| Cash Sales | $0 | $0 | $0 | $0 | $0 | $0 | $0 | $0 | $0 | $17,063 | $20,475 | $31,850 | |
| Cash from Receivables | $0 | $0 | $0 | $0 | $0 | $0 | $0 | $0 | $0 | $0 | $1,056 | $31,899 | |
| Subtotal Cash from Operations | $0 | $0 | $0 | $0 | $0 | $0 | $0 | $0 | $0 | $17,063 | $21,531 | $63,749 | |
| Additional Cash Received | |||||||||||||
| Sales Tax, VAT, HST/GST Received | 0.00% | $0 | $0 | $0 | $0 | $0 | $0 | $0 | $0 | $0 | $0 | $0 | $0 |
| New Current Borrowing | $0 | $0 | $0 | $0 | $0 | $0 | $0 | $0 | $0 | $0 | $0 | $0 | |
| New Other Liabilities (interest-free) | $0 | $0 | $0 | $0 | $0 | $0 | $0 | $0 | $0 | $0 | $0 | $600,000 | |
| New Long-term Liabilities | $0 | $0 | $0 | $0 | $0 | $0 | $0 | $0 | $0 | $0 | $0 | $600,000 | |
| Sales of Other Current Assets | $0 | $0 | $0 | $0 | $0 | $0 | $0 | $0 | $0 | $0 | $0 | $0 | |
| Sales of Long-term Assets | $0 | $0 | $0 | $0 | $0 | $0 | $0 | $0 | $0 | $0 | $0 | $0 | |
| New Investment Received | $0 | $0 | $0 | $0 | $450,000 | $400,000 | $0 | $0 | $0 | $0 | $0 | $0 | |
| Subtotal Cash Received | $0 | $0 | $0 | $0 | $450,000 | $400,000 | $0 | $0 | $0 | $17,063 | $21,531 | $1,263,749 | |
| Expenditures | Month 1 | Month 2 | Month 3 | Month 4 | Month 5 | Month 6 | Month 7 | Month 8 | Month 9 | Month 10 | Month 11 | Month 12 | |
| Expenditures from Operations | |||||||||||||
| Cash Spending | $7,000 | $7,000 | $7,000 | $7,000 | $7,000 | $21,000 | $32,000 | $32,000 | $61,500 | $61,500 | $61,500 | $61,500 | |
| Bill Payments | $148 | $4,720 | $13,306 | $14,569 | $16,792 | $21,462 | $16,913 | $35,702 | $410,212 | $43,268 | $72,495 | $84,428 | |
| Subtotal Spent on Operations | $7,148 | $11,720 | $20,306 | $21,569 | $23,792 | $42,462 | $48,913 | $67,702 | $471,712 | $104,768 | $133,995 | $145,928 | |
| Additional Cash Spent | |||||||||||||
| Sales Tax, VAT, HST/GST Paid Out | $0 | $0 | $0 | $0 | $0 | $0 | $0 | $0 | $0 | $0 | $0 | $0 | |
| Principal Repayment of Current Borrowing | $0 | $0 | $0 | $0 | $0 | $0 | $0 | $0 | $0 | $0 | $0 | $0 | |
| Other Liabilities Principal Repayment | $0 | $0 | $0 | $0 | $0 | $0 | $0 | $0 | $0 | $0 | $0 | $0 | |
| Long-term Liabilities Principal Repayment | $0 | $0 | $0 | $0 | $0 | $0 | $0 | $0 | $0 | $0 | $0 | $0 | |
| Purchase Other Current Assets | $0 | $0 | $0 | $0 | $0 | $0 | $0 | $0 | $0 | $0 | $0 | $0 | |
| Purchase Long-term Assets | $0 | $0 | $0 | $0 | $0 | $0 | $0 | $0 | $0 | $0 | $0 | $0 | |
| Dividends | $0 | $0 | $0 | $0 | $0 | $0 | $0 | $0 | $0 | $0 | $0 | $0 | |
| Subtotal Cash Spent | $7,148 | $11,720 | $20,306 | $21,569 | $23,792 | $42,462 | $48,913 | $67,702 | $471,712 | $104,768 | $133,995 | $145,928 | |
| Net Cash Flow | ($7,148) | ($11,720) | ($20,306) | ($21,569) | $426,208 | $357,538 | ($48,913) | ($67,702) | ($471,712) | ($87,706) | ($112,463) | $1,117,821 | |
| Cash Balance | $120,853 | $109,133 | $88,827 | $67,258 | $493,466 | $851,005 | $802,092 | $734,390 | $262,679 | $174,973 | $62,510 | $1,180,331 | |
| Pro Forma Balance Sheet | |||||||||||||
| Month 1 | Month 2 | Month 3 | Month 4 | Month 5 | Month 6 | Month 7 | Month 8 | Month 9 | Month 10 | Month 11 | Month 12 | ||
| Assets | Starting Balances | ||||||||||||
| Current Assets | |||||||||||||
| Cash | $128,000 | $120,853 | $109,133 | $88,827 | $67,258 | $493,466 | $851,005 | $802,092 | $734,390 | $262,679 | $174,973 | $62,510 | $1,180,331 |
| Accounts Receivable | $0 | $0 | $0 | $0 | $0 | $0 | $0 | $0 | $0 | $0 | $31,688 | $68,656 | $95,908 |
| Inventory | $0 | $0 | $0 | $0 | $0 | $0 | $0 | $0 | $0 | $0 | $15,275 | $18,330 | $29,250 |
| Other Current Assets | $0 | $0 | $0 | $0 | $0 | $0 | $0 | $0 | $0 | $0 | $0 | $0 | $0 |
| Total Current Assets | $128,000 | $120,853 | $109,133 | $88,827 | $67,258 | $493,466 | $851,005 | $802,092 | $734,390 | $262,679 | $221,935 | $149,496 | $1,305,488 |
| Long-term Assets | |||||||||||||
| Long-term Assets | $0 | $0 | $0 | $0 | $0 | $0 | $0 | $0 | $0 | $0 | $0 | $0 | $0 |
| Accumulated Depreciation | $0 | $0 | $0 | $0 | $0 | $0 | $0 | $0 | $0 | $0 | $0 | $0 | $0 |
| Total Long-term Assets | $0 | $0 | $0 | $0 | $0 | $0 | $0 | $0 | $0 | $0 | $0 | $0 | $0 |
| Total Assets | $128,000 | $120,853 | $109,133 | $88,827 | $67,258 | $493,466 | $851,005 | $802,092 | $734,390 | $262,679 | $221,935 | $149,496 | $1,305,488 |
| Liabilities and Capital | Month 1 | Month 2 | Month 3 | Month 4 | Month 5 | Month 6 | Month 7 | Month 8 | Month 9 | Month 10 | Month 11 | Month 12 | |
| Current Liabilities | |||||||||||||
| Accounts Payable | $0 | $4,278 | $12,823 | $14,015 | $16,071 | $20,904 | $16,167 | $21,605 | $408,803 | $40,842 | $70,373 | $61,514 | $664,506 |
| Current Borrowing | $0 | $0 | $0 | $0 | $0 | $0 | $0 | $0 | $0 | $0 | $0 | $0 | $0 |
| Other Current Liabilities | $0 | $0 | $0 | $0 | $0 | $0 | $0 | $0 | $0 | $0 | $0 | $0 | $600,000 |
| Subtotal Current Liabilities | $0 | $4,278 | $12,823 | $14,015 | $16,071 | $20,904 | $16,167 | $21,605 | $408,803 | $40,842 | $70,373 | $61,514 | $1,264,506 |
| Long-term Liabilities | $0 | $0 | $0 | $0 | $0 | $0 | $0 | $0 | $0 | $0 | $0 | $0 | $600,000 |
| Total Liabilities | $0 | $4,278 | $12,823 | $14,015 | $16,071 | $20,904 | $16,167 | $21,605 | $408,803 | $40,842 | $70,373 | $61,514 | $1,864,506 |
| Paid-in Capital | $258,000 | $258,000 | $258,000 | $258,000 | $258,000 | $708,000 | $1,108,000 | $1,108,000 | $1,108,000 | $1,108,000 | $1,108,000 | $1,108,000 | $1,108,000 |
| Retained Earnings | ($130,000) | ($130,000) | ($130,000) | ($130,000) | ($130,000) | ($130,000) | ($130,000) | ($130,000) | ($130,000) | ($130,000) | ($130,000) | ($130,000) | ($130,000) |
| Earnings | $0 | ($11,425) | ($31,690) | ($53,188) | ($76,813) | ($105,438) | ($143,163) | ($197,513) | ($652,413) | ($756,163) | ($826,438) | ($890,018) | ($1,537,018) |
| Total Capital | $128,000 | $116,575 | $96,310 | $74,812 | $51,187 | $472,562 | $834,837 | $780,487 | $325,587 | $221,837 | $151,562 | $87,982 | ($559,018) |
| Total Liabilities and Capital | $128,000 | $120,853 | $109,133 | $88,827 | $67,258 | $493,466 | $851,005 | $802,092 | $734,390 | $262,679 | $221,935 | $149,496 | $1,305,488 |
| Net Worth | $128,000 | $116,575 | $96,310 | $74,812 | $51,187 | $472,562 | $834,837 | $780,487 | $325,587 | $221,837 | $151,562 | $87,982 | ($559,018) |


