
Physicians 1st Billing and Claims
Executive Summary
Billing services currently exist to manage medical practices. These services relieve medical professionals of tedious detail work, but rarely do they offer a means to substantially maximize the practice’s bottom line. Physicians 1st Billing and Claims will not only free office staff for more crucial tasks, but will also maximize return from insurance carriers.
National statistics show only about 70 percent of insurance claims, initially submitted on paper, are ever paid by insurance carriers. With electronic submission Physicians 1st Billing and Claims can increase the percentage of claims paid to around 98 percent.
Additional statistics indicate that it currently costs a medical practice between $8.00-$10.00 per claim to process insurance for their patients. Physicians 1st Billing and Claims can reduce these costs by 50 percent or more.
Statistics show turnaround on paper insurance claims to be 30, 60, even 90 days or longer, creating serious outstanding receivables for the practice. By submitting claims electronically, Physicians 1st Billing and Claims can generally have money in the physician’s hand within 14-18 days. Of course, this reduces outstanding receivables proportionately and tremendously improves cash flow.
Statistics also show a 30 percent suspension/rejection rate for paper insurance claims. This doesn’t mean that the claims are never paid. What it does mean is medical staff must hassle with insurance carriers over payment. With the extensive editing performed on electronic claims prior to their transmission to carriers, this percentage is reduced to 2-3 percent. Claims are submitted with a 98 percent accuracy rate.
For many years physicians graduated from medical school under the premise that they were going to run a “practice.” “Businesses” were for other professionals. Many simple administrative procedures were neglected, such as:
- Keeping current with insurance specifications and regulations, so that claims were paid on a timely basis,
- Concentrating on collecting receivables and co-payments,
- Ensuring that fees were kept at the maximum allowable insurance carriers were paying, or
- Procedure codes were current so that claims weren’t suspended or rejected.
For many offices, outstanding receivables grew tremendously and annual bad-debt write-offs became routine. But adequate profit margins allowed medical practices to ignore sound business procedures. Medical practice complacency toward industry change is in the past. Physicians’ heads raised and they began taking note of public opinions toward health care reform issues four years ago. With the onslaught of managed care organizations into the industry, physicians are finding profit margins shrinking. They are now alert to the fact that in order to remain in business into the 21st century, they will have to adopt more efficient business practices. Physicians 1st Billing and Claims is prepared to assist local health care providers move through the last of the 20th century and into the 21st century with sound practices that will guarantee business success and, in turn, guarantee quality health care for our families and our country.
Physicians 1st Billing and Claims is contributing over $9,000 to this business. We are requesting to borrow another $5,000. Please give this detailed business plan your attention. The use of these funds is explained in the Start up Summary section.
1.1 Objectives
- To acquire one account by the end of month two.
- To process 1,500 claims a month by month 15.
- To become recognized as a local industry expert in the field of medical reimbursement.
- To add several additional services to our initial offering of electronic claims submission, including:
- Code optimization.
- Managed care contract analysis.
- Full practice management.
- Customized reporting.
- Medical transcription.
- Fee analysis.
- Medicare financial impact analysis.
1.2 Mission
Physicians 1st Billing and Claims is a medical reimbursement consulting firm dedicated to helping medical practices become more efficient and save money by allowing them to out-source their insurance processing and medical billing to an expert reimbursement service. We intend to have complete one-stop-shopping for all medical practice administrative functions by the end of 1998. We intend to make enough profit to repay our business-start-up loan and finance continued growth and development with our quality service.
1.3 Keys to Success
Since 1985, the Federal Government has been urging the health care industry to submit insurance claims electronically. Statistics prove that electronic submission can save millions of dollars annually for the industry. Presently, 95 percent of all pharmaceutical claims and 70 percent of hospital claims are submitted electronically. Physicians and dentists trail far behind, with only 25-30 percent.
The Federal Government is not happy with this situation so in 1990, Congress mandated that physicians are required to file claims on behalf of all their Medicare patients. Many doctors were not prepared for this deluge of paperwork. Eight years later doctors are still climbing out from under the paperwork. In 1996 the motions calling for electronic submission of all Medicare claims were being echoed throughout the halls of congress. No mandate was passed but the paperwork continues to mount up and as baby boomers near retirement age the paper problem will only get worse and those echoes will turn into screams. This year in the U.S. over 1 trillion dollars worth of medical charges will be issued. This amounts to 9 billion medical claims. Medical practices will be forced to meet the mandates, and growing mountains of paper and most are not currently equipped to handle the transition. The sensible solution is to out-source the process to experts that are prepared to save the practices money, produce a much faster return from insurance carriers, and handle the claims with a high degree of accuracy. There aren’t many businesses that can say the Federal Government is behind them all the way.
A second key to our success will be flexibility. Physicians 1st Billing and Claims understands that each medical practice is unique. Even practices of the same specialty will have different staff and offer different services. Physicians 1st Billing and Claims will evaluate the needs of each practice and offer solutions to help the practice become more efficient. Some may want all the services we offer and some may select only a few. Our billing will be customized to each office’s needs.
A third key is our diversified services. Physicians 1st Billing and Claims offers a one-stop-shopping experience for medical administrative services.
Company Summary
We are currently organized as a partnership, being formed in October, 1998.
Physicians 1st Billing and Claims and the logo shown on the cover of this plan are trade marked through the U.S. Department of Commerce Patent and Trade Mark Office. The trademark covers Medical Practice Management and Reimbursement Consulting.
2.1 Company Ownership
The two individuals forming this partnership are John and Mary Biller, a husband and wife team.
John’s experience consists of three years of teaching experience, 13 years managerial experience in the Building Materials industry, and 12 years as a father. As a manager, John gained experience in marketing, back-office operations, sales, and managing people. John will use this experience in managing the Marketing and Sales departments.
Mary’s experience consists of 12 years as a mother and four years teaching experience. As a mother, wife, and a patient, Mary has extensive experience filling out and filing medical insurance claims. This experience has given her valuable insight into the workings of the Health Insurance industry. Mary’s experience as a teacher has taught her the skills of attention to detail, organization, and the importance of timeliness. Mary will use this experience to manage the Training and Clerical Administration departments. John and Mary will jointly assume responsibility of the Accounting and Data Entry departments.

2.2 Start-up Summary
Physicians 1st Billing and Claims start up will focus on John and Mary working full-time in the business.
John’s main duties will center on marketing/sales, purchasing, and data entry. Mary’s main duties will center on data entry, clerical administration, and training. John and Mary will jointly assume the accounting responsibilities. The children, Erika and Matthew, will work when needed in data entry and housekeeping. The entire Biller family is dedicated to ensuring the success of Physicians 1st Billing and Claims.
John and Mary have decided to purchase a business opportunity package offered by Claim Systems Inc. The price of this package includes: state of the art medical billing and accounting software, unlimited training for the first six months, two years of 24-hour technical support, emergency support service, and a full-featured marketing package. The price of the package is $5,000.00 plus $45.00 for shipping and handling. Optional dental billing software can be purchased for $900.00 plus shipping. This software will be added at a later date. An additional deposit of $400.00 will be included at time of purchase of the package to secure the rights to become a franchise once Claim Systems receives licensing from the State of Indiana. At such time as Claim Systems receives this approval, Physicians 1st Billing and Claims will pay an additional $1,595.00 for ownership of franchise rights from Claim Systems. The benefits of this will allow us to advertise nationally and establish name recognition.
John owns a Pentium II Gateway computer with ink-jet printer and a scanner that will be utilized for the business. The following additional office equipment will be purchased: a Pentium computer, an ink-jet printer, a fax machine, assorted phone and communications equipment, a chair, a copy machine, accounting software and misc. office supplies.
John and Mary are investing $9,640 of their own capital in the business, and are looking for a four-year loan for an additional $16,000 which they feel will be necessary to successfully start Physicians 1st Billing and Claims.
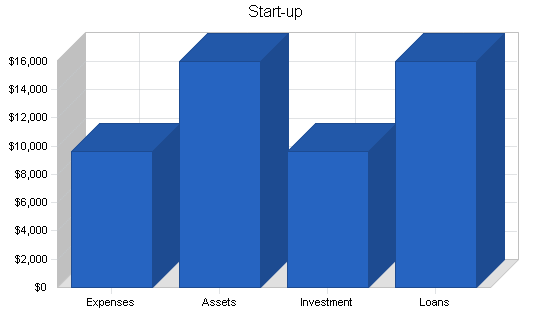
| Start-up | |
| Requirements | |
| Start-up Expenses | |
| Legal | $200 |
| Office Supplies Stationery | $200 |
| Furniture | $500 |
| Business Opportunity | $6,040 |
| Insurance | $200 |
| Rent | $50 |
| Software | $69 |
| Expensed Equipment | $345 |
| Other | $2,000 |
| Total Start-up Expenses | $9,604 |
| Start-up Assets | |
| Cash Required | $16,000 |
| Other Current Assets | $0 |
| Long-term Assets | $0 |
| Total Assets | $16,000 |
| Total Requirements | $25,604 |
| Start-up Funding | |
| Start-up Expenses to Fund | $9,604 |
| Start-up Assets to Fund | $16,000 |
| Total Funding Required | $25,604 |
| Assets | |
| Non-cash Assets from Start-up | $0 |
| Cash Requirements from Start-up | $16,000 |
| Additional Cash Raised | $0 |
| Cash Balance on Starting Date | $16,000 |
| Total Assets | $16,000 |
| Liabilities and Capital | |
| Liabilities | |
| Current Borrowing | $16,000 |
| Long-term Liabilities | $0 |
| Accounts Payable (Outstanding Bills) | $0 |
| Other Current Liabilities (interest-free) | $0 |
| Total Liabilities | $16,000 |
| Capital | |
| Planned Investment | |
| Owners | $9,604 |
| Investor | $0 |
| Additional Investment Requirement | $0 |
| Total Planned Investment | $9,604 |
| Loss at Start-up (Start-up Expenses) | ($9,604) |
| Total Capital | $0 |
| Total Capital and Liabilities | $16,000 |
| Total Funding | $25,604 |
2.3 Company Locations and Facilities
John and Mary will be utilizing 518 sq. ft. (an extra large bedroom in the upstairs) of their home. John’s office area will be utilized for marketing and accounting operations. Mary’s office area will be utilized for data entry and clerical operations, etc.
Services
Our position in the market will be a full-service medical reimbursement business with individual pricing. As stated previously, our goal is one-stop shopping for medical practices when it comes to administrative functions. Physicians 1st Billing and Claims Electronic Claims Service’s policy is to customize our charges based on the work we do, and the needs of each office. We find that each practice is unique and, therefore, we do not quote a “standard charge” for services.
Initially, Physicians 1st Billing and Claims will offer electronic billing of medical insurance claims. This is a badly needed service for most medical practices, and is even more critical since the Federal Government will mandate electronic submission of Medicare claims in the near future.
A detailed description of the electronic submission process follows. The data necessary to submit claims will be downloaded from the medical office and input into specialized computer software. The software performs certain generic edits on the data and stores the information. When a batch of claims is complete for an office, it is time to transmit to the national clearinghouse. The data travels via modems and telephone lines to the clearinghouse where the data is edited a second time. This second series of edits incorporates “insurance company specific edits.” Cooperating insurance carriers notify the clearinghouse of certain edits they feel are necessary to allow payment of their claims. These edits are performed on each claim before they are transmitted on to the carrier, thus guaranteeing accuracy and payment in most cases. Upon receiving the insurance claim from the clearinghouse, the carriers process the claim and send payment directly to the medical practice. With electronic transmission to the clearinghouse and on to the carrier, computerized data verification, and elimination of most of the human element, the process of claims payment is greatly simplified and accelerated. Physicians will no longer wait 30, 60 or 90 days for payment, but will have money in their hands usually within 14-18 days.
As practices begin experiencing the benefits of electronic submission, many will see the advantage of out-sourcing other administrative functions. Physicians 1st Billing and Claims’ full-featured practice management software will allow us to meet those needs. Patients can be billed for co-payments or amounts which their insurance company did not cover. Secondary and supplementary insurance can be tracked and payments and balances applied accurately. The software utilizes state-of-the-art, open-item accounting, where most other systems use balance-forward systems. Outstanding receivables can be tracked with insurance aging reports, in several different sequences for ease of use. A complete practice analysis will increase office efficiency by showing where money is coming from. For each procedure, the charges and percentage of total charges they represent are calculated and printed for immediate reference. Transaction Journals and Detail Ledgers provide an accurate overall picture of the practice.
With managed care sweeping the country, it is imperative for medical practices to evaluate the benefits they receive from affiliation with different organizations. Our managed care contract service tracks payments and analyzes the information to produce customized reports showing profitability, or lack of profitability, with each managed care facility. These reports are critical when decisions need to be made on renewing and negotiating contracts.
Claim Systems’ state-of-the-art software will allow the physician to do complete dictation transcription. This allows the physician to meet the needs of the new strict HCFA mandate on clarity of all Medicare claims.
3.1 Service Description
Physicians 1st Billing and Claims’ number one goal is to provide outstanding service.
We show our dedication to service by providing the physician one-stop shopping for all his or her billing and claims needs. The services we provide are as follows:
- Complete patient record setup.
- Electronic and manual medical claims filing.
- Patient billing.
- Claims posting and patient record updating.
- Collection services.
- Complete practice analysis.
- Assistance in negotiating health care contracts.
- Automated transcription service.
- Volume discounting.
Initially we will focus on just claims filing. In the near future we will diligently pursue our goal of providing one-stop shopping for physicians’ medical office management.
3.2 Competitive Comparison
An evaluation is performed on each medical practice during the marketing phase. This will allow us to determine the needs of the practice and how to charge for services rendered.
During the evaluation certain facts are gathered, such as:
- The time it will take to key patient and claims information into the software.
- The approximate number of claims a practice will submit monthly.
- The approximate “total dollars” a practice submits monthly to insurance carriers.
- How accurate is the information obtained from the office (is it complete and easy to enter or does it require extensive editing and follow-up?).
- How often will the information need to be gathered (based on claims volume).
- What method is best to collect the information (personally, mail, FAX, Federal Express, downloading via modems).
- What other services may interest the practice.
From this information Physicians 1st Billing and Claims will be able to customize charges for each practice. This ensures that the client is not being overcharged or undercharged for the services they desire. See the section on Pricing Strategies for additional information on customized pricing of services. Currently our competitors are not offering full analysis service. Our competitors also are not able to offer two-way computer communications and record posting and file updates.
3.3 Sales Literature
Included in the appendix to this plan are copies of Physicians 1st Billing and Claims’ sales brochure and tips brochure. These brochures were developed with the expertise of a national marketing company specializing in medical reimbursement issues. The sales brochure will be used in conjunction with sales calls. Physicians 1st Billing and Claims’ Tips brochure will be utilized as a direct mail piece. Also included are copies of business cards and stationery.
3.4 Technology
The computer software that is the crux of Physicians 1st Billing and Claims’ medical reimbursement business is state of the art. Physicians 1st Billing and Claims is running in Windows 95. The software was specifically developed as a tool for medical reimbursement consultants. This is important because some software being sold is written to manage a doctor’s office and does not necessarily incorporate all functions that are needed for consultants. The software also includes the latest features needed for managed care organization management, including tables for the numerous fee schedules which may be required, and customized reports to evaluate contacts.
The ET&T clearinghouse, which verifies the claims data, is highly respected in the industry. They are members of and have been certified by AFECHT, a national policing organization. They utilize the American National Standards formats recognized by Medicare and most commercial insurance carriers. They guarantee claims are 98 percent accurate before being sent on to carriers.
3.5 Future Services
As stated earlier in 3.1, Mary and John plan to initially process claims manually and electronically. As they gain experience, they will offer full medical office consulting services as follows:
- Patient billing.
- Collection services.
- Assistance in negotiating health care contracts.
- Automated transcription service.
Market Analysis Summary
Physicians 1st Billing and Claims’ target market consists of any medical practice or health care delivery unit that utilizes the HCFA-1500 format (a national standard utilized by Medicare) for submission of claims. This includes family practice, internal medicine, surgeons, psychologists, chiropractors, physical therapists, podiatrists, specialists, ambulance services, medical laboratories, etc. Physicians 1st Billing and Claims can also process claims for dentists with the use of special ADA software.
New practices are particularly appealing as Physicians 1st Billing and Claims can assist the new physician and his or her staff in billing and claims training. By equipping the physicians with a a well trained staff in claims handling and putting an efficient billing program into place, Physicians 1st Billing and Claims can reduce the stress of start up and ensure greater likelihood of a practice’s success due in part to increased cash flow.
4.1 Market Segmentation
The following is a chart showing the number of physicians in (omitted) for each speciality mentioned.
Number and Specialty
5 Allergy-Immunology
47 Anesthesiologist
3 Cardiovascular
12 Cardiovascular Surgery
84 Chiropractors
1 Clinical Genetics
2 Child Psychiatry
1 Clinical Immunology
5 Colon Rectal Surgery
10 Critical Care Medicine
179 Dental
11 Dermatology
1 Diabetes
35 Diagnostic Radiology
1 Education
21 Emergency Medicine
16 Ear, Nose and Throat
114 Family Practice
30 Family Practice Residents
1 Family Practice Sports Med.
12 Gastroenterology
10 Geriatrics
22 General Surgery
1 General Surgery Burns
7 Gynecology
7 Hematology
4 Infectious Diseases
40 Internal Medicine
10 Neurology
12 Nephrology
4 Neonatal-Prenatal Medicine
3 Nuclear Radiology
9 Neurological Surgery
26 Obstetrics
1 Obstetrics & Gynecology Resident
1 Occupational Medicine
3 Oncology
22 Ophthalmology
35 Orthopedic Surgery
7 Orthopedic Surgery Resident
14 Optometry
24 Pediatrics
14 Psychiatry
49 Psychologists
1 Pediatrics Pulmonary
6 Physical Med. & Rehab.
15 Physical therapy
1 Pediatric Nephrology
9 Plastic Surgery
21 Pathology
11 Pulmonary
3 Rheumatology
6 Therapeutic Radiology
13 Thoracic Surgery
14 Urology
12 Vascular Surgery
Physicians 1st Billing and Claims’ initial plan is to sign a single doctor practice. An ideal target would be a family practice physician.

| Market Analysis | |||||||
| Year 1 | Year 2 | Year 3 | Year 4 | Year 5 | |||
| Potential Customers | Growth | CAGR | |||||
| Physicians | 2% | 867 | 884 | 902 | 920 | 938 | 1.99% |
| Dentists | 2% | 179 | 183 | 187 | 191 | 195 | 2.16% |
| Other | 2% | 18 | 18 | 18 | 18 | 18 | 0.00% |
| Total | 1.98% | 1,064 | 1,085 | 1,107 | 1,129 | 1,151 | 1.98% |
4.2 Service Business Analysis
The Federal Government’s influence is quite positive. In May, 1992, the Health Care Financing Administration, the governing body for Medicare, established what they call “payment floors” for Medicare claims. Carriers contracted to pay Medicare claims were told to hold paper claims’ payments until “at least the 27th day after receipt.” Electronic claims were to be held until the 14th day, but had to be paid by the 19th day. If “clean claims” (claims that are error free) were not paid by the 19th day after receipt, the Federal Government would have to pay interest on the claim amount. No payment penalties were placed on paper claims. Program Memorandum AB-92-5 described above, was beneficial for the electronic medical claims industry.
Several states have passed mandates of their own since 1992, but until now there has been no real action by the Federal Government on this issue. As stated earlier, it is expected that Congress will mandate electronic submission of Medicare claims in the near future and the cut-off date for paper claims will follow soon after. After the cut-off date, paper Medicare claims will not be accepted.
If history is any indication and current trends continue, commercial insurance carriers will follow suit within a short period of time. It is in their best interest as well. Statistics show that it currently costs a commercial carrier between $2.60 to $20.00 to process a claim. The same claim can be processed electronically for approximately $1.10. The conversion costs of moving from paper to electronic processing can be extensive, but in the long run these savings will be substantial.
4.2.1 Main Competitors
Our main competition is Bi-State Medical Consulting. They provide full service medical claims management.
Their strengths are:
- Experience.
- Education.
- Large client base.
Their weaknesses are:
- One-way claims communication and software.
- Limited advertising ability.
The strengths and weaknesses, however, seem of little consequence as the local market by all accounts is untouched, and no other company in this area can offer the software features or the dedicated service that Physicians 1st Billing and Claims is able to offer.
The bottom line of our ability to compete lies in our ability to provide any and every physician with free practice management software, two-way computer communications which allow for next day patient records updating, and substantially improved cash flow for the physician.
4.2.2 Business Participants
If Congress does mandate electronic submission of insurance claims during 1998, 600 physicians will be scrambling to meet the mandates. Since October, 1990, physicians treating Medicare and Medicaid patients have been required by law to file the necessary claims for these individuals. If practices are unable to meet the mandates, they will lose a good portion of their patient base.
During the past few years, medical practice’s interest in Total Quality Control (TQC) has intensified. Part of this is attributed to the Federal Government and the American public’s interest in health care reform. Physicians fear that if they do not voluntarily comply, more Federal regulations will be imposed.
The managed care movement across America is also influencing medical practices. In the past, doctors personally decided what they would charge for services rendered. For many physicians this fee-for-service payment method is a thing of the past. With managed care, physicians sign contracts and affiliate with different health maintenance organizations (HMOs) or preferred provider organizations (PPOs). Most decide to affiliate for one of two reasons:
- Their peers are doing it and they do not want to be left out, or
- They feel it will increase their patient base.
Unfortunately for many physicians, their patient bases do increase while their incomes decline. With the “capitation” payment schedules that accompany managed care affiliation, most physicians are making less than they were under the fee-for-service system. Association with managed care organizations also creates tremendous new paperwork requirements. Many offices complain of five times more paperwork than before affiliation. All of this is making medical practices look for innovative ways to create better office efficiency.
Strategy and Implementation Summary
Studies show that the No. 1 issue with consumers today is “personal service.” They are tired of robotic salespeople, hollow sales promises, and mediocre support from unresponsive technical staff. They want to know that someone really cares about their concerns and wants to resolve their problems. They want thoroughly thought out solutions that reap benefits. And they want it when they want it. Physicians 1st Billing and Claims understands this because we have been in their position.
Physicians 1st Billing and Claims also understands that they want a reasonable price for services. That is why Physicians 1st Billing and Claims takes the time to evaluate the needs of each medical office and then we customize our service and our charges, based on needs. We need to make sure we are not overcharging or undercharging. If we’re overcharging, then the client will not be happy. If we’re undercharging, then we won’t be happy and we probably won’t do a good job. What we’re looking for is win-win, long-term relationships with our clients. Zig Ziglar, noted sales trainer, asks the question, “Would you buy from you? Are you the type of business that you would like to do business with?” Physicians 1st Billing and Claims feels we are the type of company that anyone would be happy to do business with.
5.1 Competitive Edge
Physicians 1st Billing and Claims can provide the following benefits:
- Free State-Of-The-Art Practice Software.
- Two-way Computer Communications.
- Next Day Patient Record Updating.
- Complete Practice Analysis.
- Full Service Medical Claims Management.
- Superior Service.
- Experience.
No one else in the local market can offer this service package.
5.2 Marketing Strategy
There is a marked increase in results when multiple items are used in concert to attain your goal, a contract for services between you and a health care practice.
The basic plan is divided into five segments:
- Contacting the medical practice for the first time.
- By phone.
- Cold call.
- Identifying the gatekeeper and making contact with them.
- Mailing or dropping off information
- Three-panel brochure.
- Self mailer.
- Promotional letter.
- Scheduling an appointment for a presentation.
- The presentation.
Contacts to implement this marketing strategy will be from a prior developed database of physicians who currently do not file medical claims electronically. This information is obtained from public records.
5.2.1 Promotion Strategy
We believe it is much smarter for a medical practice to out-source the detail work of insurance processing to an expert medical reimbursement service instead of trying to make the transition to in-house processing themselves. For years medical practices have been relying on the expert advice of accounting services for tax issues and financial planning. These areas have become very complicated and expertise is needed to ensure judicious decisions. Insurance processing has become very complicated as well, and physicians need to begin relying on expert services to maximize their reimbursement from insurance carriers.
Most medical offices are computerized to the degree that they own a computer and software with capabilities to set appointments, bill patients, and print paper insurance claims. Most do not have capabilities to transmit claims electronically or scientifically evaluate managed care contracts, and the transition is expensive.
Their current software and system have been very stable, and for years may not have even required a software update. Electronic claims submission is a very volatile and different industry requiring frequent software modifications to stay abreast of industry changes. Expertise and time is required over and above what the normal medical office can afford.
For most offices the transition would begin with buying new hardware (or updating the old), claims software, modems, communications software, etc. Very likely the current medical staff will not have the expertise to handle upgrades, install programs, test modems, understand baud rates, conduct initial testing, and other essential skills. This means the office has to hire someone with these skills or retain an expensive support service. With the high turnover of personnel that most medical offices currently experience, retaining another type of employee adds a completely new dimension.
The logical solution to meeting Federal mandates and to process all claims electronically, is to contract with an expert electronic medical billing and reimbursement service. This allows current office staff to resume the tasks they were trained to do, such as assist patients and doctors.
5.2.2 Marketing Programs
With a service-oriented business such as this, clients must be brought on one at a time. The full practice analysis will be conducted with each need being identified. Charges will be negotiated based on these needs. When we have successfully met the needs of each practice, the practice will be more inclined to promote our business to other medical practices that would benefit from our service. Studies have shown that the most common way to expand a medical reimbursement business is through referrals from current clients.
In addition to the on-going program discussed above, Physicians 1st Billing and Claims will incorporate numerous other strategies simultaneously.
In general they are:
- A listing in the local Yellow Pages. We realize the importance of stability and professionalism; anyone who has been in business any length of time can be located in the Yellow Pages. We will only be utilizing a one-line listing for we feel this will not be the main source of clients contacting us, but will provide the professional appearance we need.
- Networking as members of the Chamber of Commerce, local civic organizations, county medical associations.
- Attending and volunteering services for medical fundraisers and health fairs, maintaining an information booth at local medical trade shows.
- Attending Medicare, Medicaid, Blue Shield and Worker’s Compensation activities.
- Networking with other professionals, such as medical and professional consultants, attorneys, and accountants whose clientele is predominately medical, pharmaceutical representatives, and medical equipment salespeople.
- Affiliation with local and national peer organizations, including those available on the Internet.
- Advertising in local/hospital newsletters.
- Membership in the Better Business Bureau.
- Accepting an invitation to appear on a local radio talk show.
- Submitting several press releases annually to local newspapers.
- Writing articles for several health publications in the area.
5.2.3 Pricing Strategy
Physicians 1st Billing and Claims’s pricing strategy is a two part program:
Part 1:
The first question that must be asked in the negotiation process is, “Does this practice want complete claims management?” If the answer is yes, Physicians 1st Billing and Claims will negotiate services based on a percentage. Usually the percentage will be from 6 to 10 percent based on the size of the practice.
Part 2:
If the practice simply wants claims filing, the pay-for-services rendered will be based on a sliding scale with ranges between $3.50 and $5.00. This scale is divided as follows:
| # Patients | Price Per Claim |
| 1-99 | $5.00 |
| 100-199 | $4.50 |
| 200-299 | $4.25 |
| 300-399 | $4.00 |
| 400+ | $3.50 |
A one time setup charge between $150.00 and $500.00 based on patient load will be assessed and will be due at contract signing.
5.3 Sales Strategy
The following graph and chart reflect the realistic goals we have set.


| Sales Forecast | |||
| Year 1 | Year 2 | Year 3 | |
| Unit Sales | |||
| Service 1 | 33,000 | 48,000 | 52,000 |
| Service 2 | 28,800 | 0 | 0 |
| Total Unit Sales | 61,800 | 48,000 | 52,000 |
| Unit Prices | Year 1 | Year 2 | Year 3 |
| Service 1 | $3.50 | $3.50 | $3.50 |
| Service 2 | $1.50 | $1.50 | $3.50 |
| Sales | |||
| Service 1 | $115,500 | $168,000 | $182,000 |
| Service 2 | $43,200 | $0 | $0 |
| Total Sales | $158,700 | $168,000 | $182,000 |
| Direct Unit Costs | Year 1 | Year 2 | Year 3 |
| Service 1 | $0.00 | $0.00 | $0.00 |
| Service 2 | $0.00 | $0.00 | $0.00 |
| Direct Cost of Sales | |||
| Service 1 | $0 | $0 | $0 |
| Service 2 | $0 | $0 | $0 |
| Subtotal Direct Cost of Sales | $0 | $0 | $0 |
5.4 Strategic Alliances
Physicians 1st Billing and Claims is a franchise affiliated with the nationally known Medical billing franchise. This affiliation allows us to take advantage of the prestige and experience associated with the national company. Included with affiliation is:
- Full-accounting, state-of-the-art medical billing software (Windows based) that includes patient billing, specialized reports, superbill generation, electronic claims, open-item accounting, patient recall, mailing labels, patient scheduling, and graphics capabilities.
- One year, toll-free telephone support for software, claims processing and marketing strategies.
- One year software updates, rewrites, and new manuals.
- A library of current medical insurance carriers.
- A library of current CPT (procedure) codes.
- A library of current ICD-9-CM (diagnosis) codes.
- Flash Code for Windows (software that handles extensive validity checking on procedure and diagnosis codes).
- Clearinghouse registration for claims processing centers and first medical practices.
- Dental electronic claims software.
- Marketing manuals, audio tapes, and supplemental marketing materials.
- Computer software to help in designing innovative marketing brochures.
- Personalized help in designing marketing materials.
- Updates to keep us informed concerning changes in the health care industry.
- Computer software to calculate what it currently costs a medical practice to provide insurance processing for patients and to help calculate customized charges for medical practices.
- Invoicing software.
- Contact management software.
5.5 Milestones
See Milestone table.
| Milestones | |||||
| Milestone | Start Date | End Date | Budget | Manager | Department |
| First Client | 10/1/1998 | 10/30/1998 | $1,200 | John & Mary Biller | S&M |
| Second Client | 10/30/1998 | 11/30/1998 | $1,200 | John & Mary Biller | S&M |
| Third Client | 11/30/1998 | 12/30/1998 | $1,200 | John & Mary Biller | S&M |
| Fourth Client | 12/30/1998 | 1/30/1998 | $1,200 | John & Mary Biller | S&M |
| Fifth Client | 1/1/1999 | 2/1/1999 | $1,200 | John & Mary Biller | S&M |
| Totals | $6,000 | ||||
Management Summary
As stated earlier in the section on Company Ownership, the primary management of the company will be handled by John Biller. As President of Physicians 1st Billing and Claims, John brings 16 years of management experience to his position. John holds a Bachelor of Science degree from Ball State University in Education. John’s education and experience in the medical field come from his extensive training in Physiology and Anatomy as a major part of a Health Science degree. John managed Big Timber Building Materials from 1982 to 1995. Having been responsible for sales in excess of $12 million, John is more than capable of leading Physicians 1st Billing and Claims to the Number 1 billing and claims processing firm in the local area. John will handle all marketing and sales functions. John will oversee the data processing, training, accounting, and computer departments.
Mary will serve as the Chief Operating Officer of administration and clerical. Mary brings 18 years of valuable experience to her administrative post. Mary holds a Bachelor of Science degree from Ball State University in Education. Mary has successfully organized and headed many community endeavors that without her foresight would never have achieved their intended goals. Mary will mainly be responsible for initial tele-marketing, data entry, customer service, and disseminating of company information. Mary has 13 years in medical claims filing and three years in secretarial training; both lend themselves well to the departments she will head up. Physicians 1st Billing and Claims and its customers are in good hands with Mary’s leadership.
6.1 Personnel Plan
John and Mary will assume full-time management of and employment at Physicians 1st Billing and Claims.
Two other part-time employees who are equally as valuable for the roles they will play in the operations of Physicians 1st Billing and Claims are Erika and Matthew Biller. Erika will assume some data entry duties and facility maintenance duties. Matthew will assume facility maintenance duties to start and will later participate in data entry. Erika and Matthew will both be responsible for manual clerical duties which are vital to the operations of Physicians 1st Billing and Claims.
| Personnel Plan | |||
| Year 1 | Year 2 | Year 3 | |
| Mary | $21,000 | $26,000 | $30,000 |
| John | $21,000 | $26,000 | $30,000 |
| Matthew and Erika | $6,000 | $10,000 | $10,000 |
| Total People | 4 | 4 | 4 |
| Total Payroll | $48,000 | $62,000 | $70,000 |
Financial Plan
The business will be financed mainly through cash flow. With a service oriented business our main investment is for initial software and computer equipment. During subsequent years, other than normal overhead, we will be looking at:
- Advertising fees of $50.00 monthly to Claim Systems advertising pool.
- Renewal of memberships to local and national organizations.
- Updates of reference manuals and books.
- Office supplies and utilities.
- Payroll and benefits.
7.1 Important Assumptions
This financial plan depends on important assumptions, most of which are shown in the following table.
| General Assumptions | |||
| Year 1 | Year 2 | Year 3 | |
| Plan Month | 1 | 2 | 3 |
| Current Interest Rate | 10.00% | 10.00% | 10.00% |
| Long-term Interest Rate | 10.00% | 10.00% | 10.00% |
| Tax Rate | 19.80% | 20.00% | 20.83% |
| Other | 0 | 0 | 0 |
7.2 Key Financial Indicators
The following shows critical profit variables.

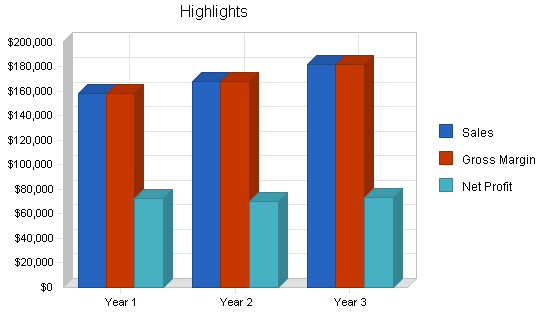
7.3 Projected Profit and Loss
Physicians 1st Billing and Claims will show a loss for the first few months of business operation, but profits will increase with sales volume.


| Pro Forma Profit and Loss | |||
| Year 1 | Year 2 | Year 3 | |
| Sales | $158,700 | $168,000 | $182,000 |
| Direct Cost of Sales | $0 | $0 | $0 |
| Other Costs of Sales | $0 | $0 | $0 |
| Total Cost of Sales | $0 | $0 | $0 |
| Gross Margin | $158,700 | $168,000 | $182,000 |
| Gross Margin % | 100.00% | 100.00% | 100.00% |
| Expenses | |||
| Payroll | $48,000 | $62,000 | $70,000 |
| Marketing/Promotion | $14,730 | $15,672 | $16,614 |
| Depreciation | $0 | $0 | $0 |
| Franchise Fee | $1,596 | $0 | $0 |
| Rent | $1,608 | $700 | $700 |
| Utilities | $876 | $600 | $600 |
| Insurance | $204 | $204 | $204 |
| Payroll Taxes | $0 | $0 | $0 |
| Other | $0 | $0 | $0 |
| Total Operating Expenses | $67,014 | $79,176 | $88,118 |
| Profit Before Interest and Taxes | $91,686 | $88,824 | $93,882 |
| EBITDA | $91,686 | $88,824 | $93,882 |
| Interest Expense | $1,405 | $1,040 | $640 |
| Taxes Incurred | $17,879 | $17,557 | $19,422 |
| Net Profit | $72,402 | $70,227 | $73,820 |
| Net Profit/Sales | 45.62% | 41.80% | 40.56% |
7.4 Break-even Analysis
The break-even analysis shows that Physicians 1st Billing and Claims has a good balance of fixed costs and sufficient sales strength to remain healthy. As with any business, the first few months will show negative financial numbers.

| Break-even Analysis | |
| Monthly Units Break-even | 2,175 |
| Monthly Revenue Break-even | $5,585 |
| Assumptions: | |
| Average Per-Unit Revenue | $2.57 |
| Average Per-Unit Variable Cost | $0.00 |
| Estimated Monthly Fixed Cost | $5,585 |
7.5 Projected Cash Flow
Initially, cash flow will be supported by the personal savings accounts of the head officers of this company, and a four-year loan of $16,000, backed by the owners’ assets.

| Pro Forma Cash Flow | |||
| Year 1 | Year 2 | Year 3 | |
| Cash Received | |||
| Cash from Operations | |||
| Cash Sales | $0 | $0 | $0 |
| Cash from Receivables | $111,467 | $165,232 | $177,833 |
| Subtotal Cash from Operations | $111,467 | $165,232 | $177,833 |
| Additional Cash Received | |||
| Sales Tax, VAT, HST/GST Received | $0 | $0 | $0 |
| New Current Borrowing | $0 | $0 | $0 |
| New Other Liabilities (interest-free) | $0 | $0 | $0 |
| New Long-term Liabilities | $0 | $0 | $0 |
| Sales of Other Current Assets | $0 | $0 | $0 |
| Sales of Long-term Assets | $0 | $0 | $0 |
| New Investment Received | $0 | $0 | $0 |
| Subtotal Cash Received | $111,467 | $165,232 | $177,833 |
| Expenditures | Year 1 | Year 2 | Year 3 |
| Expenditures from Operations | |||
| Cash Spending | $48,000 | $62,000 | $70,000 |
| Bill Payments | $32,289 | $38,842 | $37,982 |
| Subtotal Spent on Operations | $80,289 | $100,842 | $107,982 |
| Additional Cash Spent | |||
| Sales Tax, VAT, HST/GST Paid Out | $0 | $0 | $0 |
| Principal Repayment of Current Borrowing | $3,600 | $4,000 | $4,000 |
| Other Liabilities Principal Repayment | $0 | $0 | $0 |
| Long-term Liabilities Principal Repayment | $0 | $0 | $0 |
| Purchase Other Current Assets | $0 | $0 | $0 |
| Purchase Long-term Assets | $0 | $0 | $0 |
| Dividends | $0 | $0 | $0 |
| Subtotal Cash Spent | $83,889 | $104,842 | $111,982 |
| Net Cash Flow | $27,577 | $60,390 | $65,851 |
| Cash Balance | $43,577 | $103,968 | $169,819 |
7.6 Projected Balance Sheet
The following is the Projected Balance Sheet for the next three years.
| Pro Forma Balance Sheet | |||
| Year 1 | Year 2 | Year 3 | |
| Assets | |||
| Current Assets | |||
| Cash | $43,577 | $103,968 | $169,819 |
| Accounts Receivable | $47,233 | $50,001 | $54,168 |
| Other Current Assets | $0 | $0 | $0 |
| Total Current Assets | $90,811 | $153,969 | $223,987 |
| Long-term Assets | |||
| Long-term Assets | $0 | $0 | $0 |
| Accumulated Depreciation | $0 | $0 | $0 |
| Total Long-term Assets | $0 | $0 | $0 |
| Total Assets | $90,811 | $153,969 | $223,987 |
| Liabilities and Capital | Year 1 | Year 2 | Year 3 |
| Current Liabilities | |||
| Accounts Payable | $6,009 | $2,940 | $3,138 |
| Current Borrowing | $12,400 | $8,400 | $4,400 |
| Other Current Liabilities | $0 | $0 | $0 |
| Subtotal Current Liabilities | $18,409 | $11,340 | $7,538 |
| Long-term Liabilities | $0 | $0 | $0 |
| Total Liabilities | $18,409 | $11,340 | $7,538 |
| Paid-in Capital | $9,604 | $9,604 | $9,604 |
| Retained Earnings | ($9,604) | $62,798 | $133,025 |
| Earnings | $72,402 | $70,227 | $73,820 |
| Total Capital | $72,402 | $142,629 | $216,448 |
| Total Liabilities and Capital | $90,811 | $153,969 | $223,987 |
| Net Worth | $72,402 | $142,629 | $216,448 |
7.7 Business Ratios
Business ratios for the years of this plan are shown below. Industry profile ratios based on the Standard Industrial Classification (SIC) code 6411, Insurance Agents, Brokers, and Service, are shown for comparison.
| Ratio Analysis | ||||
| Year 1 | Year 2 | Year 3 | Industry Profile | |
| Sales Growth | 0.00% | 5.86% | 8.33% | 2.40% |
| Percent of Total Assets | ||||
| Accounts Receivable | 52.01% | 32.47% | 24.18% | 26.30% |
| Other Current Assets | 0.00% | 0.00% | 0.00% | 64.30% |
| Total Current Assets | 100.00% | 100.00% | 100.00% | 90.60% |
| Long-term Assets | 0.00% | 0.00% | 0.00% | 9.40% |
| Total Assets | 100.00% | 100.00% | 100.00% | 100.00% |
| Current Liabilities | 20.27% | 7.37% | 3.37% | 48.20% |
| Long-term Liabilities | 0.00% | 0.00% | 0.00% | 9.50% |
| Total Liabilities | 20.27% | 7.37% | 3.37% | 57.70% |
| Net Worth | 79.73% | 92.63% | 96.63% | 42.30% |
| Percent of Sales | ||||
| Sales | 100.00% | 100.00% | 100.00% | 100.00% |
| Gross Margin | 100.00% | 100.00% | 100.00% | 100.00% |
| Selling, General & Administrative Expenses | 54.38% | 58.20% | 59.44% | 60.10% |
| Advertising Expenses | 0.00% | 0.00% | 0.00% | 1.70% |
| Profit Before Interest and Taxes | 57.77% | 52.87% | 51.58% | 5.20% |
| Main Ratios | ||||
| Current | 4.93 | 13.58 | 29.71 | 1.66 |
| Quick | 4.93 | 13.58 | 29.71 | 1.45 |
| Total Debt to Total Assets | 20.27% | 7.37% | 3.37% | 57.70% |
| Pre-tax Return on Net Worth | 124.69% | 61.55% | 43.08% | 5.80% |
| Pre-tax Return on Assets | 99.42% | 57.01% | 41.63% | 13.70% |
| Additional Ratios | Year 1 | Year 2 | Year 3 | |
| Net Profit Margin | 45.62% | 41.80% | 40.56% | n.a |
| Return on Equity | 100.00% | 49.24% | 34.10% | n.a |
| Activity Ratios | ||||
| Accounts Receivable Turnover | 3.36 | 3.36 | 3.36 | n.a |
| Collection Days | 55 | 106 | 104 | n.a |
| Accounts Payable Turnover | 6.37 | 12.17 | 12.17 | n.a |
| Payment Days | 27 | 46 | 29 | n.a |
| Total Asset Turnover | 1.75 | 1.09 | 0.81 | n.a |
| Debt Ratios | ||||
| Debt to Net Worth | 0.25 | 0.08 | 0.03 | n.a |
| Current Liab. to Liab. | 1.00 | 1.00 | 1.00 | n.a |
| Liquidity Ratios | ||||
| Net Working Capital | $72,402 | $142,629 | $216,448 | n.a |
| Interest Coverage | 65.26 | 85.41 | 146.69 | n.a |
| Additional Ratios | ||||
| Assets to Sales | 0.57 | 0.92 | 1.23 | n.a |
| Current Debt/Total Assets | 20% | 7% | 3% | n.a |
| Acid Test | 2.37 | 9.17 | 22.53 | n.a |
| Sales/Net Worth | 2.19 | 1.18 | 0.84 | n.a |
| Dividend Payout | 0.00 | 0.00 | 0.00 | n.a |
Appendix
| Sales Forecast | |||||||||||||
| Month 1 | Month 2 | Month 3 | Month 4 | Month 5 | Month 6 | Month 7 | Month 8 | Month 9 | Month 10 | Month 11 | Month 12 | ||
| Unit Sales | |||||||||||||
| Service 1 | 0% | 400 | 800 | 1,200 | 1,800 | 2,200 | 2,600 | 3,000 | 3,400 | 3,800 | 4,200 | 4,600 | 5,000 |
| Service 2 | 0% | 0 | 0 | 0 | 0 | 2,200 | 2,600 | 3,000 | 3,400 | 3,800 | 4,200 | 4,600 | 5,000 |
| Total Unit Sales | 400 | 800 | 1,200 | 1,800 | 4,400 | 5,200 | 6,000 | 6,800 | 7,600 | 8,400 | 9,200 | 10,000 | |
| Unit Prices | Month 1 | Month 2 | Month 3 | Month 4 | Month 5 | Month 6 | Month 7 | Month 8 | Month 9 | Month 10 | Month 11 | Month 12 | |
| Service 1 | $3.50 | $3.50 | $3.50 | $3.50 | $3.50 | $3.50 | $3.50 | $3.50 | $3.50 | $3.50 | $3.50 | $3.50 | |
| Service 2 | $1.50 | $1.50 | $1.50 | $1.50 | $1.50 | $1.50 | $1.50 | $1.50 | $1.50 | $1.50 | $1.50 | $1.50 | |
| Sales | |||||||||||||
| Service 1 | $1,400 | $2,800 | $4,200 | $6,300 | $7,700 | $9,100 | $10,500 | $11,900 | $13,300 | $14,700 | $16,100 | $17,500 | |
| Service 2 | $0 | $0 | $0 | $0 | $3,300 | $3,900 | $4,500 | $5,100 | $5,700 | $6,300 | $6,900 | $7,500 | |
| Total Sales | $1,400 | $2,800 | $4,200 | $6,300 | $11,000 | $13,000 | $15,000 | $17,000 | $19,000 | $21,000 | $23,000 | $25,000 | |
| Direct Unit Costs | Month 1 | Month 2 | Month 3 | Month 4 | Month 5 | Month 6 | Month 7 | Month 8 | Month 9 | Month 10 | Month 11 | Month 12 | |
| Service 1 | 0.00% | $0.00 | $0.00 | $0.00 | $0.00 | $0.00 | $0.00 | $0.00 | $0.00 | $0.00 | $0.00 | $0.00 | $0.00 |
| Service 2 | 0.00% | $0.00 | $0.00 | $0.00 | $0.00 | $0.00 | $0.00 | $0.00 | $0.00 | $0.00 | $0.00 | $0.00 | $0.00 |
| Direct Cost of Sales | |||||||||||||
| Service 1 | $0 | $0 | $0 | $0 | $0 | $0 | $0 | $0 | $0 | $0 | $0 | $0 | |
| Service 2 | $0 | $0 | $0 | $0 | $0 | $0 | $0 | $0 | $0 | $0 | $0 | $0 | |
| Subtotal Direct Cost of Sales | $0 | $0 | $0 | $0 | $0 | $0 | $0 | $0 | $0 | $0 | $0 | $0 | |
| Personnel Plan | |||||||||||||
| Month 1 | Month 2 | Month 3 | Month 4 | Month 5 | Month 6 | Month 7 | Month 8 | Month 9 | Month 10 | Month 11 | Month 12 | ||
| Mary | 0% | $1,000 | $1,000 | $1,000 | $2,000 | $2,000 | $2,000 | $2,000 | $2,000 | $2,000 | $2,000 | $2,000 | $2,000 |
| John | 0% | $1,000 | $1,000 | $1,000 | $2,000 | $2,000 | $2,000 | $2,000 | $2,000 | $2,000 | $2,000 | $2,000 | $2,000 |
| Matthew and Erika | 0% | $400 | $400 | $400 | $400 | $400 | $400 | $600 | $600 | $600 | $600 | $600 | $600 |
| Total People | 4 | 4 | 4 | 4 | 4 | 4 | 4 | 4 | 4 | 4 | 4 | 4 | |
| Total Payroll | $2,400 | $2,400 | $2,400 | $4,400 | $4,400 | $4,400 | $4,600 | $4,600 | $4,600 | $4,600 | $4,600 | $4,600 | |
| Pro Forma Profit and Loss | |||||||||||||
| Month 1 | Month 2 | Month 3 | Month 4 | Month 5 | Month 6 | Month 7 | Month 8 | Month 9 | Month 10 | Month 11 | Month 12 | ||
| Sales | $1,400 | $2,800 | $4,200 | $6,300 | $11,000 | $13,000 | $15,000 | $17,000 | $19,000 | $21,000 | $23,000 | $25,000 | |
| Direct Cost of Sales | $0 | $0 | $0 | $0 | $0 | $0 | $0 | $0 | $0 | $0 | $0 | $0 | |
| Other Costs of Sales | $0 | $0 | $0 | $0 | $0 | $0 | $0 | $0 | $0 | $0 | $0 | $0 | |
| Total Cost of Sales | $0 | $0 | $0 | $0 | $0 | $0 | $0 | $0 | $0 | $0 | $0 | $0 | |
| Gross Margin | $1,400 | $2,800 | $4,200 | $6,300 | $11,000 | $13,000 | $15,000 | $17,000 | $19,000 | $21,000 | $23,000 | $25,000 | |
| Gross Margin % | 100.00% | 100.00% | 100.00% | 100.00% | 100.00% | 100.00% | 100.00% | 100.00% | 100.00% | 100.00% | 100.00% | 100.00% | |
| Expenses | |||||||||||||
| Payroll | $2,400 | $2,400 | $2,400 | $4,400 | $4,400 | $4,400 | $4,600 | $4,600 | $4,600 | $4,600 | $4,600 | $4,600 | |
| Marketing/Promotion | $280 | $410 | $630 | $770 | $950 | $1,130 | $1,310 | $1,490 | $1,670 | $1,850 | $2,030 | $2,210 | |
| Depreciation | $0 | $0 | $0 | $0 | $0 | $0 | $0 | $0 | $0 | $0 | $0 | $0 | |
| Franchise Fee | $133 | $133 | $133 | $133 | $133 | $133 | $133 | $133 | $133 | $133 | $133 | $133 | |
| Rent | $134 | $134 | $134 | $134 | $134 | $134 | $134 | $134 | $134 | $134 | $134 | $134 | |
| Utilities | $73 | $73 | $73 | $73 | $73 | $73 | $73 | $73 | $73 | $73 | $73 | $73 | |
| Insurance | $17 | $17 | $17 | $17 | $17 | $17 | $17 | $17 | $17 | $17 | $17 | $17 | |
| Payroll Taxes | 15% | $0 | $0 | $0 | $0 | $0 | $0 | $0 | $0 | $0 | $0 | $0 | $0 |
| Other | $0 | $0 | $0 | $0 | $0 | $0 | $0 | $0 | $0 | $0 | $0 | $0 | |
| Total Operating Expenses | $3,037 | $3,167 | $3,387 | $5,527 | $5,707 | $5,887 | $6,267 | $6,447 | $6,627 | $6,807 | $6,987 | $7,167 | |
| Profit Before Interest and Taxes | ($1,637) | ($367) | $813 | $773 | $5,293 | $7,113 | $8,733 | $10,553 | $12,373 | $14,193 | $16,013 | $17,833 | |
| EBITDA | ($1,637) | ($367) | $813 | $773 | $5,293 | $7,113 | $8,733 | $10,553 | $12,373 | $14,193 | $16,013 | $17,833 | |
| Interest Expense | $131 | $128 | $126 | $123 | $121 | $118 | $116 | $113 | $111 | $108 | $106 | $103 | |
| Taxes Incurred | ($530) | ($99) | $137 | $130 | $1,034 | $1,399 | $1,723 | $2,088 | $2,452 | $2,817 | $3,181 | $3,546 | |
| Net Profit | ($1,237) | ($396) | $550 | $520 | $4,138 | $5,596 | $6,894 | $8,352 | $9,810 | $11,268 | $12,726 | $14,184 | |
| Net Profit/Sales | -88.39% | -14.15% | 13.09% | 8.25% | 37.62% | 43.04% | 45.96% | 49.13% | 51.63% | 53.66% | 55.33% | 56.73% | |
| Pro Forma Cash Flow | |||||||||||||
| Month 1 | Month 2 | Month 3 | Month 4 | Month 5 | Month 6 | Month 7 | Month 8 | Month 9 | Month 10 | Month 11 | Month 12 | ||
| Cash Received | |||||||||||||
| Cash from Operations | |||||||||||||
| Cash Sales | $0 | $0 | $0 | $0 | $0 | $0 | $0 | $0 | $0 | $0 | $0 | $0 | |
| Cash from Receivables | $0 | $47 | $1,447 | $2,847 | $4,270 | $6,457 | $11,067 | $13,067 | $15,067 | $17,067 | $19,067 | $21,067 | |
| Subtotal Cash from Operations | $0 | $47 | $1,447 | $2,847 | $4,270 | $6,457 | $11,067 | $13,067 | $15,067 | $17,067 | $19,067 | $21,067 | |
| Additional Cash Received | |||||||||||||
| Sales Tax, VAT, HST/GST Received | 0.00% | $0 | $0 | $0 | $0 | $0 | $0 | $0 | $0 | $0 | $0 | $0 | $0 |
| New Current Borrowing | $0 | $0 | $0 | $0 | $0 | $0 | $0 | $0 | $0 | $0 | $0 | $0 | |
| New Other Liabilities (interest-free) | $0 | $0 | $0 | $0 | $0 | $0 | $0 | $0 | $0 | $0 | $0 | $0 | |
| New Long-term Liabilities | $0 | $0 | $0 | $0 | $0 | $0 | $0 | $0 | $0 | $0 | $0 | $0 | |
| Sales of Other Current Assets | $0 | $0 | $0 | $0 | $0 | $0 | $0 | $0 | $0 | $0 | $0 | $0 | |
| Sales of Long-term Assets | $0 | $0 | $0 | $0 | $0 | $0 | $0 | $0 | $0 | $0 | $0 | $0 | |
| New Investment Received | $0 | $0 | $0 | $0 | $0 | $0 | $0 | $0 | $0 | $0 | $0 | $0 | |
| Subtotal Cash Received | $0 | $47 | $1,447 | $2,847 | $4,270 | $6,457 | $11,067 | $13,067 | $15,067 | $17,067 | $19,067 | $21,067 | |
| Expenditures | Month 1 | Month 2 | Month 3 | Month 4 | Month 5 | Month 6 | Month 7 | Month 8 | Month 9 | Month 10 | Month 11 | Month 12 | |
| Expenditures from Operations | |||||||||||||
| Cash Spending | $2,400 | $2,400 | $2,400 | $4,400 | $4,400 | $4,400 | $4,600 | $4,600 | $4,600 | $4,600 | $4,600 | $4,600 | |
| Bill Payments | $8 | $256 | $811 | $1,255 | $1,416 | $2,480 | $3,021 | $3,524 | $4,066 | $4,608 | $5,150 | $5,692 | |
| Subtotal Spent on Operations | $2,408 | $2,656 | $3,211 | $5,655 | $5,816 | $6,880 | $7,621 | $8,124 | $8,666 | $9,208 | $9,750 | $10,292 | |
| Additional Cash Spent | |||||||||||||
| Sales Tax, VAT, HST/GST Paid Out | $0 | $0 | $0 | $0 | $0 | $0 | $0 | $0 | $0 | $0 | $0 | $0 | |
| Principal Repayment of Current Borrowing | $300 | $300 | $300 | $300 | $300 | $300 | $300 | $300 | $300 | $300 | $300 | $300 | |
| Other Liabilities Principal Repayment | $0 | $0 | $0 | $0 | $0 | $0 | $0 | $0 | $0 | $0 | $0 | $0 | |
| Long-term Liabilities Principal Repayment | $0 | $0 | $0 | $0 | $0 | $0 | $0 | $0 | $0 | $0 | $0 | $0 | |
| Purchase Other Current Assets | $0 | $0 | $0 | $0 | $0 | $0 | $0 | $0 | $0 | $0 | $0 | $0 | |
| Purchase Long-term Assets | $0 | $0 | $0 | $0 | $0 | $0 | $0 | $0 | $0 | $0 | $0 | $0 | |
| Dividends | $0 | $0 | $0 | $0 | $0 | $0 | $0 | $0 | $0 | $0 | $0 | $0 | |
| Subtotal Cash Spent | $2,708 | $2,956 | $3,511 | $5,955 | $6,116 | $7,180 | $7,921 | $8,424 | $8,966 | $9,508 | $10,050 | $10,592 | |
| Net Cash Flow | ($2,708) | ($2,909) | ($2,065) | ($3,108) | ($1,846) | ($724) | $3,146 | $4,642 | $6,100 | $7,558 | $9,016 | $10,474 | |
| Cash Balance | $13,292 | $10,383 | $8,318 | $5,210 | $3,364 | $2,640 | $5,786 | $10,428 | $16,528 | $24,087 | $33,103 | $43,577 | |
| Pro Forma Balance Sheet | |||||||||||||
| Month 1 | Month 2 | Month 3 | Month 4 | Month 5 | Month 6 | Month 7 | Month 8 | Month 9 | Month 10 | Month 11 | Month 12 | ||
| Assets | Starting Balances | ||||||||||||
| Current Assets | |||||||||||||
| Cash | $16,000 | $13,292 | $10,383 | $8,318 | $5,210 | $3,364 | $2,640 | $5,786 | $10,428 | $16,528 | $24,087 | $33,103 | $43,577 |
| Accounts Receivable | $0 | $1,400 | $4,153 | $6,907 | $10,360 | $17,090 | $23,633 | $27,567 | $31,500 | $35,433 | $39,367 | $43,300 | $47,233 |
| Other Current Assets | $0 | $0 | $0 | $0 | $0 | $0 | $0 | $0 | $0 | $0 | $0 | $0 | $0 |
| Total Current Assets | $16,000 | $14,692 | $14,536 | $15,225 | $15,570 | $20,454 | $26,273 | $33,352 | $41,928 | $51,962 | $63,453 | $76,403 | $90,811 |
| Long-term Assets | |||||||||||||
| Long-term Assets | $0 | $0 | $0 | $0 | $0 | $0 | $0 | $0 | $0 | $0 | $0 | $0 | $0 |
| Accumulated Depreciation | $0 | $0 | $0 | $0 | $0 | $0 | $0 | $0 | $0 | $0 | $0 | $0 | $0 |
| Total Long-term Assets | $0 | $0 | $0 | $0 | $0 | $0 | $0 | $0 | $0 | $0 | $0 | $0 | $0 |
| Total Assets | $16,000 | $14,692 | $14,536 | $15,225 | $15,570 | $20,454 | $26,273 | $33,352 | $41,928 | $51,962 | $63,453 | $76,403 | $90,811 |
| Liabilities and Capital | Month 1 | Month 2 | Month 3 | Month 4 | Month 5 | Month 6 | Month 7 | Month 8 | Month 9 | Month 10 | Month 11 | Month 12 | |
| Current Liabilities | |||||||||||||
| Accounts Payable | $0 | $230 | $770 | $1,209 | $1,334 | $2,380 | $2,904 | $3,389 | $3,913 | $4,437 | $4,961 | $5,485 | $6,009 |
| Current Borrowing | $16,000 | $15,700 | $15,400 | $15,100 | $14,800 | $14,500 | $14,200 | $13,900 | $13,600 | $13,300 | $13,000 | $12,700 | $12,400 |
| Other Current Liabilities | $0 | $0 | $0 | $0 | $0 | $0 | $0 | $0 | $0 | $0 | $0 | $0 | $0 |
| Subtotal Current Liabilities | $16,000 | $15,930 | $16,170 | $16,309 | $16,134 | $16,880 | $17,104 | $17,289 | $17,513 | $17,737 | $17,961 | $18,185 | $18,409 |
| Long-term Liabilities | $0 | $0 | $0 | $0 | $0 | $0 | $0 | $0 | $0 | $0 | $0 | $0 | $0 |
| Total Liabilities | $16,000 | $15,930 | $16,170 | $16,309 | $16,134 | $16,880 | $17,104 | $17,289 | $17,513 | $17,737 | $17,961 | $18,185 | $18,409 |
| Paid-in Capital | $9,604 | $9,604 | $9,604 | $9,604 | $9,604 | $9,604 | $9,604 | $9,604 | $9,604 | $9,604 | $9,604 | $9,604 | $9,604 |
| Retained Earnings | ($9,604) | ($9,604) | ($9,604) | ($9,604) | ($9,604) | ($9,604) | ($9,604) | ($9,604) | ($9,604) | ($9,604) | ($9,604) | ($9,604) | ($9,604) |
| Earnings | $0 | ($1,237) | ($1,634) | ($1,084) | ($564) | $3,573 | $9,169 | $16,063 | $24,415 | $34,224 | $45,492 | $58,218 | $72,402 |
| Total Capital | $0 | ($1,237) | ($1,634) | ($1,084) | ($564) | $3,573 | $9,169 | $16,063 | $24,415 | $34,224 | $45,492 | $58,218 | $72,402 |
| Total Liabilities and Capital | $16,000 | $14,692 | $14,536 | $15,225 | $15,570 | $20,454 | $26,273 | $33,352 | $41,928 | $51,962 | $63,453 | $76,403 | $90,811 |
| Net Worth | $0 | ($1,237) | ($1,634) | ($1,084) | ($564) | $3,573 | $9,169 | $16,063 | $24,415 | $34,224 | $45,492 | $58,218 | $72,402 |


