
ExpectingUcom
Executive Summary
ExpectingU.com is a new online business providing fun, comfortable and easily accessible collegiate maternity wear via our own site and an eBay store.
The owner, Mary Lenton, has over 10 years of experience in business management, channel marketing, and high-level sales. She will fund the business herself with personal capital as she believes strongly in the product idea. In fact, she searched for this product herself while pregnant and could not find collegiate maternity wear to purchase, thus ExpectingU.com was founded. Market research among over 500 expecting mothers shows that there is a demand for such products. ExpectingU.com has ad space commitments from several online expecting sites, and dozens of leads for direct sales and public relations.
Our targeted market includes both the many pregnant women who are sports fans (or married to sports fans), and friends and family members of expecting women who will buy the shirts as gifts.
In the first year, sales projections for ExpectingU.com are estimated at $1,094,635 for the first year and net profit is projected at $343,517.
We anticipate a gross margin of roughly 71.5% on products sold directly from our website, and 67.2% on items sold through our eBay store. This is substantially higher than the Industry standard gross margin in maternity wear, since our product’s simple design allows easy (and inexpensive) outsourced manufacturing, while the innovative concept allows us to charge a price premium.
Although we will pay an estimated $48,000 in eBay fees in the first year (roughly $1.30 per item sold), we will more than make up for this amount in savings, both in marketing costs and in expenses for website development and maintenance for our own site in the first year. The popularity and brand success of eBay, combined with its built-in tools for new merchants, will help us to build a solid customer base for our new product.

1.1 Objectives
- Create a unique maternity wear product and offer them in 75% of Division 1 football schools’ collegiate logos by the end of year one.
- Generate retail sales of over $1,000,000 in year one, both on our site and on our eBay store.
- Maintain a gross margin of over 65%.
- To achieve 100 eBay customer positive feedback comments in one year.
1.2 Mission
To offer fun, comfortable and readily available maternity collegiate wear for women who want to show their support for their favorite college team, even while pregnant.
1.3 Keys to Success
- ExpectingU.com will offer a unique line of maternity shirts that will carry the logo and/or mascot of NCAA Division I football teams. These products are currently in demand today but do not exist in mainstream commerce.
- ExpectingU.com will satisfy the demand of maternity collegiate shirts by maintaining inventory levels that will allow for immediate shipping to customers.
- ExpectingU.com will execute a targeted marketing campaign to generate awareness of the website and products.
Company Summary
ExpectingU.com is a new Internet business that will sell a line of collegiate maternity wear for expecting mothers. In the future, the company will also explore the professional sports market as a new channel for growth.
The owner will run the business from her home office. Inventory will be stored in a 1,200 sq.ft. designated storage area within the basement. Sales will be primarily through an eBay store until our own site is fully developed, part way through the first year.
2.1 Company Ownership
ExpectingU.com is a privately held S-Corporation owned in total by its founder, Mary Lenton.
2.2 Start-up Summary
Start-up costs for ExpectingU.com equal $23,750 and include legal costs, computer supplies, new product marketing, website design and NCAA licensing* for the shirt designs. start-up assets total $40,000, most of which is dedicated for start-up inventory. Please see the following chart for a detailed look at all start-up costs.
*LICENSING: Based on research, NCAA licensing is required to use official college mascots and names. This is not cost prohibitive; however, the regulating board for licensing has strict requirements regarding who can and cannot be granted permission to use collegiate likenesses. As of this date, our proposal is under submission and we are awaiting a final decision.
Future growth into other categories will be dependant upon similar licensing with organizations such as the NBA and NFL.

| Start-up | |
| Requirements | |
| Start-up Expenses | |
| Legal | $1,000 |
| Computer | $250 |
| Marketing | $15,000 |
| Web Design | $1,500 |
| Licensing | $5,000 |
| Total Start-up Expenses | $22,750 |
| Start-up Assets | |
| Cash Required | $6,000 |
| Start-up Inventory | $35,000 |
| Other Current Assets | $0 |
| Long-term Assets | $0 |
| Total Assets | $41,000 |
| Total Requirements | $63,750 |
Products
ExpectingU. com will provide fun and comfortable collegiate maternity wear shirts via our website, and through an eBay store, which serves as a portal to our main website. Manufacturing will be done by a third party, and fulfillment will be handled in-house initially.
Market Analysis Summary
The primary target market is the 3.5 million women who are pregnant each year. These woman often buy maternity clothes for themselves during their pregnancy.
The secondary target market is the over 25,000,000 people who shop for and buy collegiate clothing each year. By being made aware that collegiate maternity wear exists, they are able to purchase items as gifts for someone they know who is pregnant.
As an online store, we will focus on the portions of these market segments which are comfortable shopping online.
4.1 Market Segmentation
The two groups of people who would buy maternity clothes are pregnant woman, and those who would shop for a pregnant woman, perhaps a husband or a family member. Based on these segments, our projected sales forecast is conservatively set at less then 1% of the total potential market, as highlighted in the following table and chart.

| Market Analysis | |||||||
| Year 1 | Year 2 | Year 3 | Year 4 | Year 5 | |||
| Potential Customers | Growth | CAGR | |||||
| Expecting women | 0% | 3,500,000 | 3,500,000 | 3,500,000 | 3,500,000 | 3,500,000 | 0.00% |
| Collegiate wear shoppers | 0% | 25,000,000 | 25,000,000 | 25,000,000 | 25,000,000 | 25,000,000 | 0.00% |
| Other | 0% | 0 | 0 | 0 | 0 | 0 | 0.00% |
| Total | 0.00% | 28,500,000 | 28,500,000 | 28,500,000 | 28,500,000 | 28,500,000 | 0.00% |
4.2 Industry Analysis
ExpectingU.com will be in a small segment of the clothing industry called Maternity Wear. Today the U.S. maternity wear industry generates sales of over $200 million and is comprised of over 2,000 retail stores and more than 500 websites that offer maternity clothing.
Pregnant women: There are over 3.5 million women who are expecting each year. The maternity retail business has come a long way from offering dowdy, baggy style maternity clothes to those that help women celebrate their style and look great even as their body changes. Clothes offered for pregnant women in the market now include hip and stylish maternity clothing, athletic wear and corporate clothes. After all, as pregnant women’s waist lines balloon, their lives and careers go on as usual. Women, for example, who are used to attending the sporting events for their favorite team would still want to show their support by wearing a fun and comfortable logo shirt. These women will be targeted through email campaigns, online advertising and direct marketing
Shoppers for Pregnant Women: It is unknown how many people shop for someone they know that is expecting; however due to specific collegiate nature of our products, we will target those who are already shopping for collegiate wear to make them aware of our products and create gift ideas for the expectant women in their lives. We will use online advertising on existing collegiate sites to generate awareness and drive site traffic.

4.2.1 Competition and Buying Patterns
In this industry, customers choose their clothing based on personal preference. They often like to find items that represent their pre-pregnancy wardrobe so they can continue to keep their own style. By marketing our products to pregnant women, many are sure to connect with something as personal as their favorite sports team. It is a specialty item that will make them feel good to wear.
By positioning in the market as a specialty store, we are confident that word of mouth will help to create product awareness. Our market research shows that pregnant women today attend sporting events and often have to resort to buying men’s large shirts or other make-shift clothing items. Pregnant women wearing our shirts in public will generate interest and lead to additional sales.
4.2.2 Main Competitors
While there are several large maternity retailers such as Motherhood and Pea in the Pod, they all carry a mainstream line of clothes that are appealing to the masses. Due to their mass distribution model, it would not be prudent for them to carry small amounts of regional specialty items, such as collegiate shirts, at each store. Online retailers also carry a wide variety of maternity clothes, but very few carry collegiate maternity wear. Those that do offer very little variety in school representation. There is a need for a specialty web store geared for this type of apparel.
Strategy and Implementation Summary
Our marketing strategy is to create product awareness among expecting women and their families by strategically placing Internet ads, using direct mail tactics sold and generating PR. We offer a unique product that we feel confident expecting women will find fun to wear during their pregnancy. It will be a novelty item that will allow them to stay connected to their interest in their collegiate team both at games and around town.
5.1 Competitive Edge
The competitive edge offered by ExpectingU.com is our unique product. Currently, no major maternity retailer and few online stores offer collegiate maternity t-shirts. We will position ourselves as a specialty online store catering to expecting moms who want to maintain their support of their favorite team through their pregnancy. Because of our niche, we can effectively choose targeted sources to market our product to our customers.
Our primary weakness is that we are a new business and we offer a new product. To generate sales, we must first create awareness that our product exists, and make it easy for potential customers to locate our online store. By offering a fun product that many expecting women would like to have, we feel we an quickly establish our presence in the maternity wear industry.
5.2 Marketing Strategy
ExpectingU.com’s marketing strategy is crucial to the success of our business. We must create awareness of our product to our primary target market, as our products are of little use to anyone outside of this group. We will do this by:
- Utilizing the brand-name power of eBay and its popularity to establish credibility and increase awareness of our products
- Strategically-placed ads on websites that are frequently visited by expecting moms, such as parentsplace.com, babycenter.com, americanbaby.com and babyzone.com
- Placed ads on collegiate sites such as collegefootballnews.com and sports.yahoo.com
- Adding our products to other sites as an affiliate provider
- Direct mail and e-mail advertising to expectant mothers
- New product PR in publications for expectant mothers
5.3 Sales Strategy
Sales are dependent upon creating awareness of collegiate maternity wear within our target markets, and therefore the sales strategy for ExpectingU.com is based on driving business to our website and our eBay store. Because we are a new product line, we understand that we will have to generate excitement about our apparel in order to generate business. We will strategically place pop-up and banner ads on websites relevant to both expecting mothers and sports fans, we will use direct mail and email lists, and we will seek public relations coverage in relevant media sources.
Fulfilling orders
ExpectingU.com will fulfill orders from our eBay store and later, our own website. All payments will be processed through PayPal in the first year, although we will evaluate the option to do Fax orders if customer demand it.
E-orders: Customer can purchase online 24-hours a day, seven days a week.
Fax orders: Customers can fax in an order 24-hours a day, seven days a week if we implement this.
As the company grows, we will leave the option open to using a fulfillment center to take orders via the telephone.
5.4 Sales Forecast
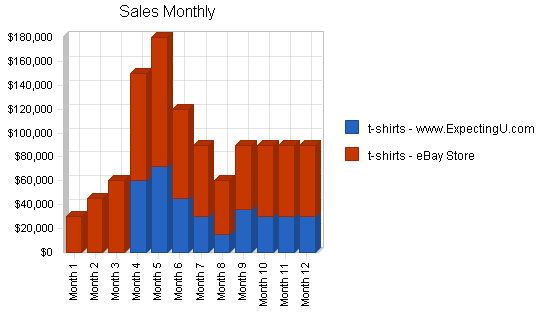
The sales forecast for FY 2006 takes into account slower sales at the beginning as we create awareness of our product and website. Initially we will be selling one style of t-shirt, but will offer it with the logos of up to 132 different Division 1 universities. As the company grows, we will explore the demand for other types of collegiate maternity wear such as tank tops, sweatshirts and long-sleeved shirts. In the first three months, we will sell exclusively through eBay. Although this adds to direct costs (roughly $1 per shirt) because of eBay fees, we will save money on both marketing/advertising costs and website maintenance by holding off on fully developing our own site until we can see what items customers prefer. We anticipate that even after enabling sales on our website, eBay sales volume will continue to be higher.
The following table illustrates unit sales of 36,500 t-shirts for the first year. This would require us to sell to less than 1% of our primary target market.
The Monthly Sales Chart that follows indicates that we have some seasonality in our business. We expect sales to increase during the Fall, which is when football season occurs and when sales for collegiate goods are the highest.
Note that the direct costs shown in the Sales Forecast table represent only the direct inventory costs for t-shirts. There are other, non-inventory direct costs, including eBay fees and PayPal fees; these can be found in the projected Profit and Loss.

| Sales Forecast | |||
| Year 1 | Year 2 | Year 3 | |
| Unit Sales | |||
| t-shirts – www.ExpectingU.com | 11,600 | 12,180 | 12,789 |
| t-shirts – eBay Store | 24,900 | 26,145 | 27,452 |
| Total Unit Sales | 36,500 | 38,325 | 40,241 |
| Unit Prices | Year 1 | Year 2 | Year 3 |
| t-shirts – www.ExpectingU.com | $29.99 | $29.99 | $29.99 |
| t-shirts – eBay Store | $29.99 | $29.99 | $29.99 |
| Sales | |||
| t-shirts – www.ExpectingU.com | $347,884 | $365,278 | $383,542 |
| t-shirts – eBay Store | $746,751 | $784,089 | $823,293 |
| Total Sales | $1,094,635 | $1,149,367 | $1,206,835 |
| Direct Unit Costs | Year 1 | Year 2 | Year 3 |
| t-shirts – www.ExpectingU.com | $7.50 | $7.50 | $7.50 |
| t-shirts – eBay Store | $7.50 | $7.50 | $7.50 |
| Direct Cost of Sales | |||
| t-shirts – www.ExpectingU.com | $86,971 | $91,320 | $95,886 |
| t-shirts – eBay Store | $186,690 | $196,088 | $205,892 |
| Subtotal Direct Cost of Sales | $273,661 | $287,407 | $301,777 |
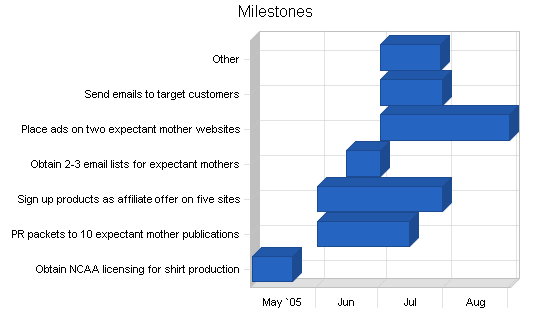
5.5 Milestones
The following are the key milestones for the first year of operations:
- Completion of strategic business plan by April 1
- Obtain all NCAA licensing by May 1
- Negotiate t-shirt costs with supplier and with screen printer by May 30
- Have first shipment of products delivered in house for fulfillment by July 1
- Have specifics for our advertising plan in place by June 1
| Milestones | |||||
| Milestone | Start Date | End Date | Budget | Manager | Department |
| Obtain NCAA licensing for shirt production | 5/1/2005 | 5/20/2005 | $5,000 | ML | general |
| PR packets to 10 expectant mother publications | 6/1/2005 | 7/15/2005 | $200 | ML | general |
| Sign up products as affiliate offer on five sites | 6/1/2005 | 7/31/2005 | $250 | ML | general |
| Obtain 2-3 email lists for expectant mothers | 6/15/2005 | 7/1/2005 | $1,000 | ML | general |
| Place ads on two expectant mother websites | 7/1/2005 | 9/1/2005 | $10,000 | ML | general |
| Send emails to target customers | 7/1/2005 | 7/31/2005 | $500 | ML | general |
| Other | 7/1/2005 | 7/30/2005 | $0 | ML | general |
| Totals | $16,950 | ||||
Web Plan Summary
The following sub-topics outline our plans to create and maintain our website. At first, we will have a simple text and image-based website which outlines our products and redirects customers to our eBay store. After the first three months, we will begin online ordering via our own website as well.
6.1 Website Marketing Strategy
Our website will provide information about us and our products as well as order processing to purchase our products online. We will include our web address in all of our advertising to reinforce to our customers how to find us online. Our company logo and motto will also need to be eye catching and easy to remember so that once our customers find us, they will remember us and suggest us to their friends and family.
6.2 Development Requirements
Initial Development
We will be working with an outside contractor to design the layout of the site. Initially, our site will provide an overview of the company, describe our products and services, and redirect visitors to our eBay store to purchase a shirt. The estimated costs for initial website development are listed in our start-up costs.
Some of the features included on the website will be the ability to search for logos by school name as well as by “team name” (such as the University of Alabama “Crimson Tide,” the UCLA “Bruins” and the University of Oregon “Ducks”). Good-quality pictures of our products and the logos on the products will be available, so the customer can see what they will be getting.
Full website (including online ordering)
In the third month of the plan, when we have a better sense of customer preferences, we will finish the development of the site to include online order processing (via PayPal). Starting in November (heavy football season) customers will have the choice of buying either directly from our website, or via our eBay store. Additional security functions are required for doing PayPal sales on our own website. Expenses for this further website development are listed in the Profit and loss table.
The order processing will include the ability to provide both a billing and an optional shipping address and will be able to process credit cards as well as payment by check (using PayPal).
Once the website design is complete, we will contract for ongoing maintenance and support of the site. These monthly cost estimates are listed in the expenses section of the Profit and Loss table.
Management Summary
Initially the only employee will be Mary Lenton, the company founder. She will oversee product development, the online store and marketing efforts. Outsourcing will be used on some initial tasks, specifically the website store design.
7.1 Personnel Plan
As the company launch date approaches, one part-time (30 hours/week) employee will be hired to help with fulfillment with a second part-time employee scheduled for the third month, entering into the highest potential selling time frame, football season. As the company grows, more personnel will be added as needed. If projections for October through December are correct, temporary seasonal help will need to be hired to assist in fulfilling the order processing.
Part-time staff will be responsible for processing all Internet and Fax orders, PayPal payments received, and will handle all shipping functions.
Subcontractors will be used to help with website design and marketing, and these subcontractor costs can be found in the Profit and Loss tables Expenses section.
| Personnel Plan | |||
| Year 1 | Year 2 | Year 3 | |
| Owner | $36,000 | $40,000 | $45,000 |
| Fulfillment Representative 1 | $12,000 | $23,000 | $25,000 |
| Fulfillment Representative 2 | $10,000 | $23,000 | $25,000 |
| Total People | 3 | 3 | 3 |
| Total Payroll | $58,000 | $86,000 | $95,000 |
Financial Plan
ExpectingU.com projects the gross margin to be at approximately 65% percent. Sales projections for Year 1 are over $1,000,000. A monthly breakdown of the cash-flow analysis, balance sheet, business ratio, break-even analysis, and other financial details are shown in the appendix. Annual projections will be highlighted in the following sub-topics.
8.1 Start-up Funding
The company owner, Mary Lenton, will use personal funds to finance the start of this business. Since a home office is already established and there is a large area in the basement available for inventory storage, the primary start-up costs are associated with website store design, starting inventory, and licensing approval.
| Start-up Funding | |
| Start-up Expenses to Fund | $22,750 |
| Start-up Assets to Fund | $41,000 |
| Total Funding Required | $63,750 |
| Assets | |
| Non-cash Assets from Start-up | $35,000 |
| Cash Requirements from Start-up | $6,000 |
| Additional Cash Raised | $0 |
| Cash Balance on Starting Date | $6,000 |
| Total Assets | $41,000 |
| Liabilities and Capital | |
| Liabilities | |
| Current Borrowing | $0 |
| Long-term Liabilities | $0 |
| Accounts Payable (Outstanding Bills) | $0 |
| Other Current Liabilities (interest-free) | $0 |
| Total Liabilities | $0 |
| Capital | |
| Planned Investment | |
| Owner | $63,750 |
| Investor | $0 |
| Additional Investment Requirement | $0 |
| Total Planned Investment | $63,750 |
| Loss at Start-up (Start-up Expenses) | ($22,750) |
| Total Capital | $41,000 |
| Total Capital and Liabilities | $41,000 |
| Total Funding | $63,750 |
8.2 Break-even Analysis

| Break-even Analysis | |
| Monthly Units Break-even | 1,009 |
| Monthly Revenue Break-even | $30,270 |
| Assumptions: | |
| Average Per-Unit Revenue | $29.99 |
| Average Per-Unit Variable Cost | $9.87 |
| Estimated Monthly Fixed Cost | $20,308 |
8.3 Projected Profit and Loss
The following table and charts show the projected profit and loss. Monthly projections are included in the appendix.
We must track our eBay and PayPal fees to make sure they are projected appropriately in the Other Cost of Goods section in the Profit and Loss statement. As we gain experience with what the average cost is for Item Fees, Final Value Fees, and PayPal fees, we may need to change the Profit and Loss table to reflect the correct cost. At this point we have placed high estimates to make sure that we are realistic about the cost of doing business on eBay.
The fees are based on the following:
eBay fees (only apply to eBay store sales):
Insertion fee of $.35 per item, plus Final Fee at 5.25% of total sale price on each sale
PayPal fees (apply to all sales):
First two months: Standard rate of $0.30 per sale, plus 2.9% of total sale price on each sale
Afterwards: Merchant rate of $0.30 per sale, plus 2.5% of total sale price on each sale*
These fees are very conservative, assuming that each unit sale is one complete sale. It is likely that at least 1/5 of our sales in the heavy sales months will be for multiple shirts, since pregnant couples often know other pregnant couples and buy each other gifts.
We will also be spending marketing dollars to promote our products with eBay’s promotion tools. We want to make sure that we have enough money to buy some search placements as well as buying “bolded” listings in the eBay search results. As we sell more items we will adjust the marketing expenses either lower or higher — depending on what is working for us.
*Obtaining the lower merchant rate requires qualifying, both in terms of account in good standing and dollar amount of sales in previous month. Based on our research, we don’t expect any problems meeting either of those goals early in our plan.


| Pro Forma Profit and Loss | |||
| Year 1 | Year 2 | Year 3 | |
| Sales | $1,094,635 | $1,149,367 | $1,206,835 |
| Direct Cost of Sales | $273,661 | $287,407 | $301,777 |
| eBay fees (eBay sales only) | $47,919 | $50,315 | $52,831 |
| PayPal fees (all sales) | $38,617 | $40,232 | $42,243 |
| Total Cost of Sales | $360,197 | $377,954 | $396,851 |
| Gross Margin | $734,438 | $771,413 | $809,984 |
| Gross Margin % | 67.09% | 67.12% | 67.12% |
| Expenses | |||
| Payroll | $58,000 | $86,000 | $95,000 |
| Marketing/Promotion | $120,000 | $126,000 | $132,300 |
| Depreciation | $0 | $0 | $0 |
| Web Design and Maintenance | $33,000 | $36,300 | $39,930 |
| Payroll Taxes | $8,700 | $12,900 | $14,250 |
| Other | $24,000 | $0 | $0 |
| Total Operating Expenses | $243,700 | $261,200 | $281,480 |
| Profit Before Interest and Taxes | $490,738 | $510,213 | $528,504 |
| EBITDA | $490,738 | $510,213 | $528,504 |
| Interest Expense | $0 | $0 | $0 |
| Taxes Incurred | $147,221 | $153,064 | $158,551 |
| Net Profit | $343,516 | $357,149 | $369,953 |
| Net Profit/Sales | 31.38% | 31.07% | 30.65% |
8.4 Projected Cash Flow
The monthly cash flow is shown in the illustration, with one bar representing cash flow per month and the other representing the monthly balance. The annual cash flow figures are included in the following table.

| Pro Forma Cash Flow | |||
| Year 1 | Year 2 | Year 3 | |
| Cash Received | |||
| Cash from Operations | |||
| Cash Sales | $1,094,635 | $1,149,367 | $1,206,835 |
| Subtotal Cash from Operations | $1,094,635 | $1,149,367 | $1,206,835 |
| Additional Cash Received | |||
| Sales Tax, VAT, HST/GST Received | $0 | $0 | $0 |
| New Current Borrowing | $0 | $0 | $0 |
| New Other Liabilities (interest-free) | $0 | $0 | $0 |
| New Long-term Liabilities | $0 | $0 | $0 |
| Sales of Other Current Assets | $0 | $0 | $0 |
| Sales of Long-term Assets | $0 | $0 | $0 |
| New Investment Received | $0 | $0 | $0 |
| Subtotal Cash Received | $1,094,635 | $1,149,367 | $1,206,835 |
| Expenditures | Year 1 | Year 2 | Year 3 |
| Expenditures from Operations | |||
| Cash Spending | $58,000 | $86,000 | $95,000 |
| Bill Payments | $628,740 | $701,080 | $740,128 |
| Subtotal Spent on Operations | $686,740 | $787,080 | $835,128 |
| Additional Cash Spent | |||
| Sales Tax, VAT, HST/GST Paid Out | $0 | $0 | $0 |
| Principal Repayment of Current Borrowing | $0 | $0 | $0 |
| Other Liabilities Principal Repayment | $0 | $0 | $0 |
| Long-term Liabilities Principal Repayment | $0 | $0 | $0 |
| Purchase Other Current Assets | $0 | $0 | $0 |
| Purchase Long-term Assets | $0 | $0 | $0 |
| Dividends | $0 | $0 | $0 |
| Subtotal Cash Spent | $686,740 | $787,080 | $835,128 |
| Net Cash Flow | $407,895 | $362,287 | $371,707 |
| Cash Balance | $413,895 | $776,181 | $1,147,888 |
8.5 Projected Balance Sheet
| Pro Forma Balance Sheet | |||
| Year 1 | Year 2 | Year 3 | |
| Assets | |||
| Current Assets | |||
| Cash | $413,895 | $776,181 | $1,147,888 |
| Inventory | $22,493 | $23,622 | $24,803 |
| Other Current Assets | $0 | $0 | $0 |
| Total Current Assets | $436,387 | $799,803 | $1,172,692 |
| Long-term Assets | |||
| Long-term Assets | $0 | $0 | $0 |
| Accumulated Depreciation | $0 | $0 | $0 |
| Total Long-term Assets | $0 | $0 | $0 |
| Total Assets | $436,387 | $799,803 | $1,172,692 |
| Liabilities and Capital | Year 1 | Year 2 | Year 3 |
| Current Liabilities | |||
| Accounts Payable | $51,871 | $58,138 | $61,074 |
| Current Borrowing | $0 | $0 | $0 |
| Other Current Liabilities | $0 | $0 | $0 |
| Subtotal Current Liabilities | $51,871 | $58,138 | $61,074 |
| Long-term Liabilities | $0 | $0 | $0 |
| Total Liabilities | $51,871 | $58,138 | $61,074 |
| Paid-in Capital | $63,750 | $63,750 | $63,750 |
| Retained Earnings | ($22,750) | $320,766 | $677,915 |
| Earnings | $343,516 | $357,149 | $369,953 |
| Total Capital | $384,516 | $741,665 | $1,111,618 |
| Total Liabilities and Capital | $436,387 | $799,803 | $1,172,692 |
| Net Worth | $384,516 | $741,665 | $1,111,618 |
8.6 Business Ratios
The following table shows the projected business ratios. We expect to maintain healthy ratios for profitability, risk, and return. Industry profile ratios based on the North American Industry Classification (NAICS) and Standard Industrial Classification (SIC) data for the Maternity Wear industry.
| Ratio Analysis | ||||
| Year 1 | Year 2 | Year 3 | Industry Profile | |
| Sales Growth | 0.00% | 5.00% | 5.00% | -17.40% |
| Percent of Total Assets | ||||
| Inventory | 5.15% | 2.95% | 2.12% | 38.82% |
| Other Current Assets | 0.00% | 0.00% | 0.00% | 28.73% |
| Total Current Assets | 100.00% | 100.00% | 100.00% | 90.64% |
| Long-term Assets | 0.00% | 0.00% | 0.00% | 9.36% |
| Total Assets | 100.00% | 100.00% | 100.00% | 100.00% |
| Current Liabilities | 11.89% | 7.27% | 5.21% | 24.75% |
| Long-term Liabilities | 0.00% | 0.00% | 0.00% | 5.78% |
| Total Liabilities | 11.89% | 7.27% | 5.21% | 30.53% |
| Net Worth | 88.11% | 92.73% | 94.79% | 69.47% |
| Percent of Sales | ||||
| Sales | 100.00% | 100.00% | 100.00% | 100.00% |
| Gross Margin | 67.09% | 67.12% | 67.12% | 24.54% |
| Selling, General & Administrative Expenses | 35.71% | 36.04% | 36.46% | 13.39% |
| Advertising Expenses | 0.00% | 0.00% | 0.00% | 0.79% |
| Profit Before Interest and Taxes | 44.83% | 44.39% | 43.79% | 1.00% |
| Main Ratios | ||||
| Current | 8.41 | 13.76 | 19.20 | 3.27 |
| Quick | 7.98 | 13.35 | 18.80 | 1.38 |
| Total Debt to Total Assets | 11.89% | 7.27% | 5.21% | 34.77% |
| Pre-tax Return on Net Worth | 127.62% | 68.79% | 47.54% | 2.50% |
| Pre-tax Return on Assets | 112.45% | 63.79% | 45.07% | 3.83% |
| Additional Ratios | Year 1 | Year 2 | Year 3 | |
| Net Profit Margin | 31.38% | 31.07% | 30.65% | n.a |
| Return on Equity | 89.34% | 48.15% | 33.28% | n.a |
| Activity Ratios | ||||
| Inventory Turnover | 11.00 | 12.46 | 12.46 | n.a |
| Accounts Payable Turnover | 13.12 | 12.17 | 12.17 | n.a |
| Payment Days | 27 | 28 | 29 | n.a |
| Total Asset Turnover | 2.51 | 1.44 | 1.03 | n.a |
| Debt Ratios | ||||
| Debt to Net Worth | 0.13 | 0.08 | 0.05 | n.a |
| Current Liab. to Liab. | 1.00 | 1.00 | 1.00 | n.a |
| Liquidity Ratios | ||||
| Net Working Capital | $384,516 | $741,665 | $1,111,618 | n.a |
| Interest Coverage | 0.00 | 0.00 | 0.00 | n.a |
| Additional Ratios | ||||
| Assets to Sales | 0.40 | 0.70 | 0.97 | n.a |
| Current Debt/Total Assets | 12% | 7% | 5% | n.a |
| Acid Test | 7.98 | 13.35 | 18.80 | n.a |
| Sales/Net Worth | 2.85 | 1.55 | 1.09 | n.a |
| Dividend Payout | 0.00 | 0.00 | 0.00 | n.a |
Appendix
| Sales Forecast | |||||||||||||
| Month 1 | Month 2 | Month 3 | Month 4 | Month 5 | Month 6 | Month 7 | Month 8 | Month 9 | Month 10 | Month 11 | Month 12 | ||
| Unit Sales | |||||||||||||
| t-shirts – www.ExpectingU.com | 5% | 0 | 0 | 0 | 2,000 | 2,400 | 1,500 | 1,000 | 500 | 1,200 | 1,000 | 1,000 | 1,000 |
| t-shirts – eBay Store | 5% | 1,000 | 1,500 | 2,000 | 3,000 | 3,600 | 2,500 | 2,000 | 1,500 | 1,800 | 2,000 | 2,000 | 2,000 |
| Total Unit Sales | 1,000 | 1,500 | 2,000 | 5,000 | 6,000 | 4,000 | 3,000 | 2,000 | 3,000 | 3,000 | 3,000 | 3,000 | |
| Unit Prices | Month 1 | Month 2 | Month 3 | Month 4 | Month 5 | Month 6 | Month 7 | Month 8 | Month 9 | Month 10 | Month 11 | Month 12 | |
| t-shirts – www.ExpectingU.com | $29.99 | $29.99 | $29.99 | $29.99 | $29.99 | $29.99 | $29.99 | $29.99 | $29.99 | $29.99 | $29.99 | $29.99 | |
| t-shirts – eBay Store | $29.99 | $29.99 | $29.99 | $29.99 | $29.99 | $29.99 | $29.99 | $29.99 | $29.99 | $29.99 | $29.99 | $29.99 | |
| Sales | |||||||||||||
| t-shirts – www.ExpectingU.com | $0 | $0 | $0 | $59,980 | $71,976 | $44,985 | $29,990 | $14,995 | $35,988 | $29,990 | $29,990 | $29,990 | |
| t-shirts – eBay Store | $29,990 | $44,985 | $59,980 | $89,970 | $107,964 | $74,975 | $59,980 | $44,985 | $53,982 | $59,980 | $59,980 | $59,980 | |
| Total Sales | $29,990 | $44,985 | $59,980 | $149,950 | $179,940 | $119,960 | $89,970 | $59,980 | $89,970 | $89,970 | $89,970 | $89,970 | |
| Direct Unit Costs | Month 1 | Month 2 | Month 3 | Month 4 | Month 5 | Month 6 | Month 7 | Month 8 | Month 9 | Month 10 | Month 11 | Month 12 | |
| t-shirts – www.ExpectingU.com | 25.00% | $7.50 | $7.50 | $7.50 | $7.50 | $7.50 | $7.50 | $7.50 | $7.50 | $7.50 | $7.50 | $7.50 | $7.50 |
| t-shirts – eBay Store | 25.00% | $7.50 | $7.50 | $7.50 | $7.50 | $7.50 | $7.50 | $7.50 | $7.50 | $7.50 | $7.50 | $7.50 | $7.50 |
| Direct Cost of Sales | |||||||||||||
| t-shirts – www.ExpectingU.com | $0 | $0 | $0 | $14,995 | $17,994 | $11,246 | $7,498 | $3,749 | $8,997 | $7,498 | $7,498 | $7,498 | |
| t-shirts – eBay Store | $7,500 | $11,246 | $14,995 | $22,493 | $26,991 | $18,744 | $14,995 | $11,246 | $13,496 | $14,995 | $14,995 | $14,995 | |
| Subtotal Direct Cost of Sales | $7,500 | $11,246 | $14,995 | $37,488 | $44,985 | $29,990 | $22,493 | $14,995 | $22,493 | $22,493 | $22,493 | $22,493 | |
| Personnel Plan | |||||||||||||
| Month 1 | Month 2 | Month 3 | Month 4 | Month 5 | Month 6 | Month 7 | Month 8 | Month 9 | Month 10 | Month 11 | Month 12 | ||
| Owner | 0% | $3,000 | $3,000 | $3,000 | $3,000 | $3,000 | $3,000 | $3,000 | $3,000 | $3,000 | $3,000 | $3,000 | $3,000 |
| Fulfillment Representative 1 | 0% | $1,000 | $1,000 | $1,000 | $1,000 | $1,000 | $1,000 | $1,000 | $1,000 | $1,000 | $1,000 | $1,000 | $1,000 |
| Fulfillment Representative 2 | 0% | $0 | $0 | $1,000 | $1,000 | $1,000 | $1,000 | $1,000 | $1,000 | $1,000 | $1,000 | $1,000 | $1,000 |
| Total People | 2 | 2 | 3 | 3 | 3 | 3 | 3 | 3 | 3 | 3 | 3 | 3 | |
| Total Payroll | $4,000 | $4,000 | $5,000 | $5,000 | $5,000 | $5,000 | $5,000 | $5,000 | $5,000 | $5,000 | $5,000 | $5,000 | |
| Pro Forma Profit and Loss | |||||||||||||
| Month 1 | Month 2 | Month 3 | Month 4 | Month 5 | Month 6 | Month 7 | Month 8 | Month 9 | Month 10 | Month 11 | Month 12 | ||
| Sales | $29,990 | $44,985 | $59,980 | $149,950 | $179,940 | $119,960 | $89,970 | $59,980 | $89,970 | $89,970 | $89,970 | $89,970 | |
| Direct Cost of Sales | $7,500 | $11,246 | $14,995 | $37,488 | $44,985 | $29,990 | $22,493 | $14,995 | $22,493 | $22,493 | $22,493 | $22,493 | |
| eBay fees (eBay sales only) | 5% | $1,924 | $2,887 | $3,849 | $5,773 | $6,928 | $4,811 | $3,849 | $2,887 | $3,464 | $3,849 | $3,849 | $3,849 |
| PayPal fees (all sales) | 3% | $1,170 | $1,755 | $2,100 | $5,249 | $6,299 | $4,199 | $3,149 | $2,100 | $3,149 | $3,149 | $3,149 | $3,149 |
| Total Cost of Sales | $10,594 | $15,888 | $20,944 | $48,510 | $58,212 | $39,000 | $29,491 | $19,982 | $29,106 | $29,491 | $29,491 | $29,491 | |
| Gross Margin | $19,396 | $29,097 | $39,036 | $101,441 | $121,728 | $80,960 | $60,480 | $39,998 | $60,865 | $60,480 | $60,480 | $60,480 | |
| Gross Margin % | 64.67% | 64.68% | 65.08% | 67.65% | 67.65% | 67.49% | 67.22% | 66.69% | 67.65% | 67.22% | 67.22% | 67.22% | |
| Expenses | |||||||||||||
| Payroll | $4,000 | $4,000 | $5,000 | $5,000 | $5,000 | $5,000 | $5,000 | $5,000 | $5,000 | $5,000 | $5,000 | $5,000 | |
| Marketing/Promotion | $10,000 | $15,000 | $20,000 | $20,000 | $20,000 | $5,000 | $5,000 | $5,000 | $5,000 | $5,000 | $5,000 | $5,000 | |
| Depreciation | $0 | $0 | $0 | $0 | $0 | $0 | $0 | $0 | $0 | $0 | $0 | $0 | |
| Web Design and Maintenance | $1,000 | $1,000 | $4,000 | $3,000 | $3,000 | $3,000 | $3,000 | $3,000 | $3,000 | $3,000 | $3,000 | $3,000 | |
| Payroll Taxes | 15% | $600 | $600 | $750 | $750 | $750 | $750 | $750 | $750 | $750 | $750 | $750 | $750 |
| Other | $2,000 | $2,000 | $2,000 | $2,000 | $2,000 | $2,000 | $2,000 | $2,000 | $2,000 | $2,000 | $2,000 | $2,000 | |
| Total Operating Expenses | $17,600 | $22,600 | $31,750 | $30,750 | $30,750 | $15,750 | $15,750 | $15,750 | $15,750 | $15,750 | $15,750 | $15,750 | |
| Profit Before Interest and Taxes | $1,796 | $6,497 | $7,286 | $70,691 | $90,978 | $65,210 | $44,730 | $24,248 | $45,115 | $44,730 | $44,730 | $44,730 | |
| EBITDA | $1,796 | $6,497 | $7,286 | $70,691 | $90,978 | $65,210 | $44,730 | $24,248 | $45,115 | $44,730 | $44,730 | $44,730 | |
| Interest Expense | $0 | $0 | $0 | $0 | $0 | $0 | $0 | $0 | $0 | $0 | $0 | $0 | |
| Taxes Incurred | $539 | $1,949 | $2,186 | $21,207 | $27,293 | $19,563 | $13,419 | $7,274 | $13,534 | $13,419 | $13,419 | $13,419 | |
| Net Profit | $1,257 | $4,548 | $5,100 | $49,483 | $63,685 | $45,647 | $31,311 | $16,974 | $31,580 | $31,311 | $31,311 | $31,311 | |
| Net Profit/Sales | 4.19% | 10.11% | 8.50% | 33.00% | 35.39% | 38.05% | 34.80% | 28.30% | 35.10% | 34.80% | 34.80% | 34.80% | |
| Pro Forma Cash Flow | |||||||||||||
| Month 1 | Month 2 | Month 3 | Month 4 | Month 5 | Month 6 | Month 7 | Month 8 | Month 9 | Month 10 | Month 11 | Month 12 | ||
| Cash Received | |||||||||||||
| Cash from Operations | |||||||||||||
| Cash Sales | $29,990 | $44,985 | $59,980 | $149,950 | $179,940 | $119,960 | $89,970 | $59,980 | $89,970 | $89,970 | $89,970 | $89,970 | |
| Subtotal Cash from Operations | $29,990 | $44,985 | $59,980 | $149,950 | $179,940 | $119,960 | $89,970 | $59,980 | $89,970 | $89,970 | $89,970 | $89,970 | |
| Additional Cash Received | |||||||||||||
| Sales Tax, VAT, HST/GST Received | 0.00% | $0 | $0 | $0 | $0 | $0 | $0 | $0 | $0 | $0 | $0 | $0 | $0 |
| New Current Borrowing | $0 | $0 | $0 | $0 | $0 | $0 | $0 | $0 | $0 | $0 | $0 | $0 | |
| New Other Liabilities (interest-free) | $0 | $0 | $0 | $0 | $0 | $0 | $0 | $0 | $0 | $0 | $0 | $0 | |
| New Long-term Liabilities | $0 | $0 | $0 | $0 | $0 | $0 | $0 | $0 | $0 | $0 | $0 | $0 | |
| Sales of Other Current Assets | $0 | $0 | $0 | $0 | $0 | $0 | $0 | $0 | $0 | $0 | $0 | $0 | |
| Sales of Long-term Assets | $0 | $0 | $0 | $0 | $0 | $0 | $0 | $0 | $0 | $0 | $0 | $0 | |
| New Investment Received | $0 | $0 | $0 | $0 | $0 | $0 | $0 | $0 | $0 | $0 | $0 | $0 | |
| Subtotal Cash Received | $29,990 | $44,985 | $59,980 | $149,950 | $179,940 | $119,960 | $89,970 | $59,980 | $89,970 | $89,970 | $89,970 | $89,970 | |
| Expenditures | Month 1 | Month 2 | Month 3 | Month 4 | Month 5 | Month 6 | Month 7 | Month 8 | Month 9 | Month 10 | Month 11 | Month 12 | |
| Expenditures from Operations | |||||||||||||
| Cash Spending | $4,000 | $4,000 | $5,000 | $5,000 | $5,000 | $5,000 | $5,000 | $5,000 | $5,000 | $5,000 | $5,000 | $5,000 | |
| Bill Payments | $574 | $17,498 | $25,972 | $50,932 | $117,986 | $116,605 | $54,046 | $45,640 | $31,522 | $60,646 | $53,659 | $53,659 | |
| Subtotal Spent on Operations | $4,574 | $21,498 | $30,972 | $55,932 | $122,986 | $121,605 | $59,046 | $50,640 | $36,522 | $65,646 | $58,659 | $58,659 | |
| Additional Cash Spent | |||||||||||||
| Sales Tax, VAT, HST/GST Paid Out | $0 | $0 | $0 | $0 | $0 | $0 | $0 | $0 | $0 | $0 | $0 | $0 | |
| Principal Repayment of Current Borrowing | $0 | $0 | $0 | $0 | $0 | $0 | $0 | $0 | $0 | $0 | $0 | $0 | |
| Other Liabilities Principal Repayment | $0 | $0 | $0 | $0 | $0 | $0 | $0 | $0 | $0 | $0 | $0 | $0 | |
| Long-term Liabilities Principal Repayment | $0 | $0 | $0 | $0 | $0 | $0 | $0 | $0 | $0 | $0 | $0 | $0 | |
| Purchase Other Current Assets | $0 | $0 | $0 | $0 | $0 | $0 | $0 | $0 | $0 | $0 | $0 | $0 | |
| Purchase Long-term Assets | $0 | $0 | $0 | $0 | $0 | $0 | $0 | $0 | $0 | $0 | $0 | $0 | |
| Dividends | $0 | $0 | $0 | $0 | $0 | $0 | $0 | $0 | $0 | $0 | $0 | $0 | |
| Subtotal Cash Spent | $4,574 | $21,498 | $30,972 | $55,932 | $122,986 | $121,605 | $59,046 | $50,640 | $36,522 | $65,646 | $58,659 | $58,659 | |
| Net Cash Flow | $25,416 | $23,487 | $29,008 | $94,018 | $56,954 | ($1,645) | $30,924 | $9,340 | $53,448 | $24,324 | $31,311 | $31,311 | |
| Cash Balance | $31,416 | $54,902 | $83,910 | $177,928 | $234,883 | $233,237 | $264,161 | $273,501 | $326,950 | $351,273 | $382,584 | $413,895 | |
| Pro Forma Balance Sheet | |||||||||||||
| Month 1 | Month 2 | Month 3 | Month 4 | Month 5 | Month 6 | Month 7 | Month 8 | Month 9 | Month 10 | Month 11 | Month 12 | ||
| Assets | Starting Balances | ||||||||||||
| Current Assets | |||||||||||||
| Cash | $6,000 | $31,416 | $54,902 | $83,910 | $177,928 | $234,883 | $233,237 | $264,161 | $273,501 | $326,950 | $351,273 | $382,584 | $413,895 |
| Inventory | $35,000 | $27,500 | $16,254 | $14,995 | $37,488 | $44,985 | $29,990 | $22,493 | $14,995 | $22,493 | $22,493 | $22,493 | $22,493 |
| Other Current Assets | $0 | $0 | $0 | $0 | $0 | $0 | $0 | $0 | $0 | $0 | $0 | $0 | $0 |
| Total Current Assets | $41,000 | $58,916 | $71,156 | $98,905 | $215,416 | $279,868 | $263,227 | $286,654 | $288,496 | $349,442 | $373,766 | $405,076 | $436,387 |
| Long-term Assets | |||||||||||||
| Long-term Assets | $0 | $0 | $0 | $0 | $0 | $0 | $0 | $0 | $0 | $0 | $0 | $0 | $0 |
| Accumulated Depreciation | $0 | $0 | $0 | $0 | $0 | $0 | $0 | $0 | $0 | $0 | $0 | $0 | $0 |
| Total Long-term Assets | $0 | $0 | $0 | $0 | $0 | $0 | $0 | $0 | $0 | $0 | $0 | $0 | $0 |
| Total Assets | $41,000 | $58,916 | $71,156 | $98,905 | $215,416 | $279,868 | $263,227 | $286,654 | $288,496 | $349,442 | $373,766 | $405,076 | $436,387 |
| Liabilities and Capital | Month 1 | Month 2 | Month 3 | Month 4 | Month 5 | Month 6 | Month 7 | Month 8 | Month 9 | Month 10 | Month 11 | Month 12 | |
| Current Liabilities | |||||||||||||
| Accounts Payable | $0 | $16,658 | $24,351 | $47,000 | $114,027 | $114,794 | $52,507 | $44,623 | $29,492 | $58,858 | $51,871 | $51,871 | $51,871 |
| Current Borrowing | $0 | $0 | $0 | $0 | $0 | $0 | $0 | $0 | $0 | $0 | $0 | $0 | $0 |
| Other Current Liabilities | $0 | $0 | $0 | $0 | $0 | $0 | $0 | $0 | $0 | $0 | $0 | $0 | $0 |
| Subtotal Current Liabilities | $0 | $16,658 | $24,351 | $47,000 | $114,027 | $114,794 | $52,507 | $44,623 | $29,492 | $58,858 | $51,871 | $51,871 | $51,871 |
| Long-term Liabilities | $0 | $0 | $0 | $0 | $0 | $0 | $0 | $0 | $0 | $0 | $0 | $0 | $0 |
| Total Liabilities | $0 | $16,658 | $24,351 | $47,000 | $114,027 | $114,794 | $52,507 | $44,623 | $29,492 | $58,858 | $51,871 | $51,871 | $51,871 |
| Paid-in Capital | $63,750 | $63,750 | $63,750 | $63,750 | $63,750 | $63,750 | $63,750 | $63,750 | $63,750 | $63,750 | $63,750 | $63,750 | $63,750 |
| Retained Earnings | ($22,750) | ($22,750) | ($22,750) | ($22,750) | ($22,750) | ($22,750) | ($22,750) | ($22,750) | ($22,750) | ($22,750) | ($22,750) | ($22,750) | ($22,750) |
| Earnings | $0 | $1,257 | $5,805 | $10,905 | $60,388 | $124,073 | $169,720 | $201,031 | $218,004 | $249,584 | $280,895 | $312,206 | $343,516 |
| Total Capital | $41,000 | $42,257 | $46,805 | $51,905 | $101,388 | $165,073 | $210,720 | $242,031 | $259,004 | $290,584 | $321,895 | $353,206 | $384,516 |
| Total Liabilities and Capital | $41,000 | $58,916 | $71,156 | $98,905 | $215,416 | $279,868 | $263,227 | $286,654 | $288,496 | $349,442 | $373,766 | $405,076 | $436,387 |
| Net Worth | $41,000 | $42,257 | $46,805 | $51,905 | $101,388 | $165,073 | $210,720 | $242,031 | $259,004 | $290,584 | $321,895 | $353,206 | $384,516 |


