
Massage Tools
Executive Summary
Massage Tools Products Inc. sells massage tools to both the professional and retail market. Our products address the chronic overuse injuries and discomfort experienced by busy massage therapy professionals. Designed with the massage therapist in mind, Massage Tool Products’ unique ergonomic shape give you the leverage to apply pressure where needed with less hand and wrist strain. Ideal for trigger point, deep tissue, reflexology, seated massage or practically any modality, this product fills the need of a growing group of health care professionals whose careers are limited by their ability to serve multiple clients a day without interruption by injury.
This business plan is written for internal use to guide the company as we launch the business and aim toward growth. We will refer back to the plan on a quarterly basis to track our performance in comparison to our plans, and we will adjust our business plan according to our actual results.
Massage Tools Products has been riding a growth spurt, having discovered the professional massage therapy market that gave us a push to new potential volumes through schools. Bolstered by appearances in advertising in trade publications and end user magazines, we were able to develop an additional channel through our website.
This annual business plan calls for a year of slow but steady growth, followed by a year of swiftly increasing sales. The break-even analysis shows that Massage Tools has a good balance of fixed costs and sufficient sales strength to remain healthy. Our break-even point is just over $6,000 per month for the first year.
We also expect to be profitable as never before. In all, the outlook shows a healthy company with good growth prospects, looking to manage its orderly growth in the future.
1.1 Mission
Massage Tools Products Inc.’s mission is to provide top-quality massage tools to extend the effectiveness of massage therapists and reduce repetitive use injuries in massage professionals.
1.2 Keys to Success
- Low cost of assembly;
- Favorable profit margins;
- Innovative, market leader in massage tools market;
- Low overhead.
1.3 Objectives
To get Massage Tools’ product line into at least 100 retail stores and massage therapy schools throughout the United States.
Develop a website that includes online ordering capability for Massage Tools’ product line.
Create additional products within 18 months to broaden market share.
Company Summary
Massage Tools Products Inc. is a start-up business, established in Eugene, Oregon in October 2002. We sell Massage Tools to both the professional and retail market. Our products are designed to address the chronic overuse injuries and discomfort experienced by busy massage therapy professionals. Massage Tools products can be used for massage therapy in place of or in addition to a therapists’ hands to provide sufficient pressure for therapeutic massage. This product fills the need of a growing group of health care professionals whose careers are limited by their ability to serve multiple clients a day without interruption by injury.
2.1 Start-up Summary
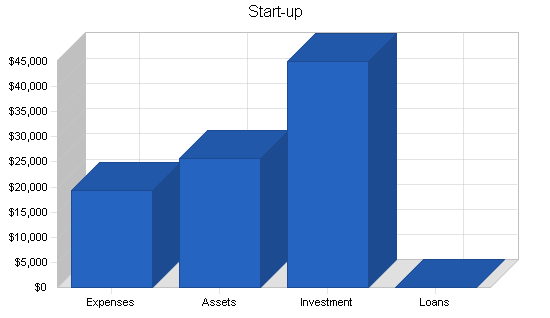
Our start-up costs come to $19,300, which is mostly insurance and product development, legal costs, and expenses associated with opening our office. The start-up costs are to be financed by direct owner investment and a $15,000 line of credit with the bank. The assumptions are shown in the following table and illustration.
| Start-up Funding | |
| Start-up Expenses to Fund | $19,300 |
| Start-up Assets to Fund | $25,700 |
| Total Funding Required | $45,000 |
| Assets | |
| Non-cash Assets from Start-up | $13,000 |
| Cash Requirements from Start-up | $12,700 |
| Additional Cash Raised | $0 |
| Cash Balance on Starting Date | $12,700 |
| Total Assets | $25,700 |
| Liabilities and Capital | |
| Liabilities | |
| Current Borrowing | $0 |
| Long-term Liabilities | $0 |
| Accounts Payable (Outstanding Bills) | $0 |
| Other Current Liabilities (interest-free) | $0 |
| Total Liabilities | $0 |
| Capital | |
| Planned Investment | |
| Ron Tickman | $40,000 |
| Investor 2 | $5,000 |
| Additional Investment Requirement | $0 |
| Total Planned Investment | $45,000 |
| Loss at Start-up (Start-up Expenses) | ($19,300) |
| Total Capital | $25,700 |
| Total Capital and Liabilities | $25,700 |
| Total Funding | $45,000 |
| Start-up | |
| Requirements | |
| Start-up Expenses | |
| Legal | $750 |
| Stationery etc. | $1,500 |
| Brochures | $2,500 |
| Consultants | $1,000 |
| Insurance | $5,000 |
| Rent | $850 |
| Research and Development | $6,500 |
| Expensed Equipment | $1,200 |
| Total Start-up Expenses | $19,300 |
| Start-up Assets | |
| Cash Required | $12,700 |
| Start-up Inventory | $8,000 |
| Other Current Assets | $5,000 |
| Long-term Assets | $0 |
| Total Assets | $25,700 |
| Total Requirements | $45,000 |
2.2 Company Ownership
Massage Tools Products Inc. is a privately owned, C-corporation with a single owner.
Products
Designed with the massage therapist in mind, Massage Tool Products unique ergonomic shape give you the leverage to apply pressure where needed with less hand and wrist strain. Ideal for trigger point, deep tissue, reflexology, seated massage or practically any modality. The smooth contoured shape glides easily over clothing or on skin with oils or lotions. Save your hands – and your career with Massage Tools.
Massage Tool – $14.50
Massage Tool Deluxe – $16.50
Market Analysis Summary
We are intending to appeal to the professional massage therapist and the massage school market. This market segment both appreciates and truly needs the Massage Tool Products line.
In our particular market, we also seek the end user who appreciates the advantage of having professional quality tools.
4.1 Target Market Segment Strategy
Massage therapists are generally exposed to tools and equipment by the school they attend. Their instructors have credibility and the products they endorse are generally the ones the students buy. Increasingly, massage therapists are looking for products to extend their productivity and the length of their career by avoiding overuse injuries. Our product addresses this critical need and we’ll buy visibility in Massage Magazine and with schools across the U.S. and in Europe and Japan, which are the primary markets. Gradually, we will also move into China.
4.2 Market Segmentation
Massage Tools Products Inc. sells Massage Tools to both the professional and retail market. Our products address the chronic overuse injuries and discomfort experienced by busy massage therapy professionals. Designed with the massage therapist in mind, Massage Tool Products unique ergonomic shape give you the leverage to apply pressure where needed with less hand and wrist strain. Ideal for trigger point, deep tissue, reflexology, seated massage or practically any modality, this product fills the need of a growing group of health care professionals whose careers are limited by their ability to serve multiple clients a day without interruption by injury.

| Market Analysis | |||||||
| Year 1 | Year 2 | Year 3 | Year 4 | Year 5 | |||
| Potential Customers | Growth | CAGR | |||||
| Massage Professionals | 8% | 40,000 | 43,200 | 46,656 | 50,388 | 54,419 | 8.00% |
| Retail End Users | 2% | 1,200,000 | 1,224,000 | 1,248,480 | 1,273,450 | 1,298,919 | 2.00% |
| Total | 2.21% | 1,240,000 | 1,267,200 | 1,295,136 | 1,323,838 | 1,353,338 | 2.21% |
4.3 Industry Analysis
The massage therapy industry has undergone a great deal of change in the last five years. Many of the larger manufacturers of tables and chairs have gone out of business. Those manufacturers were competing primarily on price. The few remaining companies have reputations for quality workmanship and money back guarantees. The integrity factor has been significant.
Many of the existing companies serving the massage professionals niche with equipment and supplies are offering products and tools, but none are providing a tool like ours that addresses overuse injuries.
Our product line is filling a niche that is just beginning to open up. The boom of massage therapy over the last 15 years has created a significant number of professional massage therapists who are experiencing carpal tunnel syndrome or other overuse injuries. Our products are designed to assist those professionals and to extend their careers. However, new professionals just completing their education will understand the importance of purchasing and using Massage Tools Products as they begin building their practices, having seen what is happening in the industry as a whole.
Most massage therapists who graduate are women 23-35 and intend to serve several clients a day to create adequate income. They tend to purchase from their massage schools or stores associated with the schools. We have contacts in these schools and with several physical therapy schools through the owners affiliation with a massage table company. It will be a natural product for these schools and stores to add to their product line.

4.3.1 Competition and Buying Patterns
A few newcomers to the U.S. market are the Chinese and the Europeans, both of whom have incredibly inexpensive products that are not of stellar quality, but do continue to steadily improve.
Strategy and Implementation Summary
We focus on a special kind of customer, the professionally trained massage therapist as well as the schools that train them. What is important to the customer is performance, affordability and beauty, ease of use, ergonomics, and practicality.
Our marketing strategy assumes that we need to go into specialty channels to address our target customer’s needs. Our most important competitive edge is our positioning with the massage schools, so that our customers will be exposed to our products before they begin their professional career and while they are in the market to buy equipment to begin their practice.
5.1 Competitive Edge
Our competitive edge is our innovation in bringing to market a product that has never been offered and for which there is tremendous need among professional massage therapists.
5.2 Marketing Strategy
We are focusing on the massage school and massage student market segment. Massage therapists are generally exposed to tools and equipment by the school they attend. Their instructors have credibility and the products they endorse are generally the ones the students buy. Increasingly, massage therapists are looking for products to extend their productivity and the length of their career by avoiding overuse injuries. Our product addresses this critical need and we’ll buy visibility in Massage Magazine and with schools across the U.S. and in Europe and Japan, which are the primary markets. Gradually, we will also move into China.
5.3 Sales Strategy
Our strategy focuses first on getting our product in massage therapy schools and retail health and wellness stores and secondly on reaching end users via online sales from our web site.
In 2004, we will expand our focus to include a presence in high-end direct mail catalogs that cater to the high net worth individuals who have discretionary income to spend on personal health and wellness products. The Spa and Resort retail stores are a new channel that could become important for us.
5.3.1 Sales Forecast
Our sales forecast assumes a slow increase in cost and no change in prices, but the pricing may increase depending on the market reception and whether or not we find competing products entering the market.
We are projecting conservative growth in our first year. We are not projecting significant change in the product line.
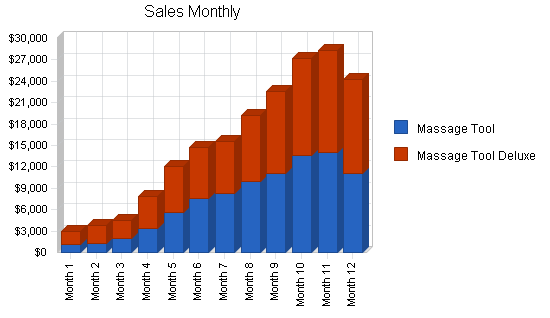
Our seasonality, as shown in the chart, is still a factor in the business. We tend to sell much better in spring and fall, and sales drop in the summer due to the heavy emphasis on sales at massage schools, which tend to have few students enrolled or do not hold classes at all. We can expect some increase in retail sales due to the Christmas holiday buying season.
| Sales Forecast | |||
| Year 1 | Year 2 | Year 3 | |
| Sales | |||
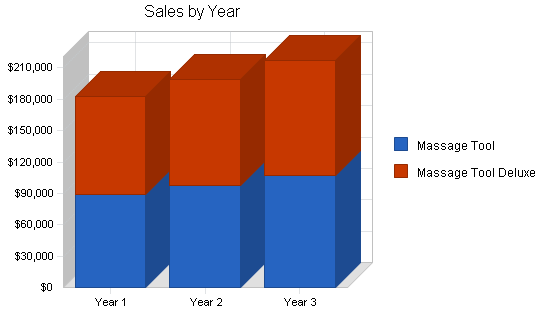
| Massage Tool | $88,832 | $97,715 | $107,487 |
| Massage Tool Deluxe | $94,108 | $101,637 | $109,768 |
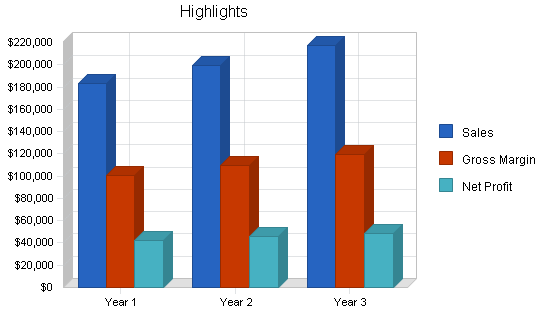
| Total Sales | $182,940 | $199,352 | $217,254 |
| Direct Cost of Sales | Year 1 | Year 2 | Year 3 |
| Massage Tool | $44,416 | $48,858 | $53,743 |
| Massage Tool Deluxe | $37,643 | $40,655 | $43,907 |
| Subtotal Direct Cost of Sales | $82,059 | $89,512 | $97,650 |
5.4 Milestones
The accompanying table shows specific milestones, with responsibilities assigned, dates, and (in most cases) budgets. We are focusing, in this plan, on a few key milestones that should be accomplished.

| Milestones | |||||
| Milestone | Start Date | End Date | Budget | Manager | Department |
| Research & Development | 8/1/2002 | 10/15/2002 | $3,000 | Ron Tickman | Marketing |
| Business Plan | 10/1/2002 | 10/31/2002 | $800 | Katherine Allen | Marketing |
| Ad Campaign | 9/1/2002 | 10/15/2002 | $1,500 | Jerril Nelson | Web |
| Overseas Production | 8/31/2002 | 10/1/2002 | $5,000 | Steve Kippman | Web |
| Patent & License | 11/1/2002 | 11/31/02 | $250 | Ron Tickman | Marketing |
| Totals | $10,550 | ||||
Web Plan Summary
The Massage Tools website will focus on providing a vehicle for easily purchasing the Massage Tools line of products. We’ll also have content that explains overuse injuries for massage professionals and a self-test of questions that will help the user determine if they are likely to incur an overuse injury sooner due to the workload they carry.
We will have a grocery cart feature to allow quick and easy purchasing. We realize that a tedious ordering process can deter even the most interested consumers.
MassageTools.com may partner with online massage retailers to sell relevant products to the users, such as oils, lotions, sheets, pillows, aromatherapy, etc.
6.1 Website Marketing Strategy
Our Internet marketing activities will be focused on product sales. Although we will sell to massage schools and other resellers, we’ll focus our Internet activities towards the general public end user.
We’ll advertise this site in non-trade publications such as New Age, Health, Simple, Self, etc.
6.2 Development Requirements
The Massage Tools website will be initially developed with few technical resources. A simple local hosting provider, Jurgens Information Services, will host the site and provide the technical back end and will contract to provide user interface design to develop the simple site. The user interface designer will work with a JLM, a graphic artist, to come up with the website logo, and the website graphics.
The maintenance of the site will be done by the Jurgens consultants. We don’t anticipate much change necessary until further products are developed.
Management Summary
We are a small company owned and operated by Ron Tickman, as an LLC. Ron is the developer and designer of the products, and manages the company as president.
Massage Tools Products’ immediate personnel plan calls for increases from one sales representative at present to two representatives three years from now, assuming our product line develops beyond our initial offering. The increase is needed to support the effort to move beyond the massage industry and into the general public market.
Most orders will be sent via fax or online. Consequently, we will continue to outsource fulfillment, shipping and packaging, etc., as well as calls to a local call center.
7.1 Personnel Plan
The president will take a small stiped the first year to enable the company to reinvest the bulk of the profits.
The sales rep will take a base salary generally in line with market pay for the Eugene area, and the remainder of her salary will be derived from a percentage of gross sales.
| Personnel Plan | |||
| Year 1 | Year 2 | Year 3 | |
| Ron Tickman, President & Owner | $1,200 | $2,500 | $2,500 |
| Katherine Allen, Sales Rep | $4,500 | $6,500 | $7,500 |
| Other | $0 | $0 | $0 |
| Total People | 0 | 0 | 0 |
| Total Payroll | $5,700 | $9,000 | $10,000 |
Financial Plan
The financial picture is quite encouraging. We have been slow to take on debt, but our credit line with the bank is supported by assets.
8.1 Important Assumptions
The financial plan depends on important assumptions, most of which are shown in the following table. The key underlying assumptions are:
- We assume a slow-growth economy, without major recession.
- We assume access to equity capital and financing sufficient to maintain our financial plan as shown in the tables.
| General Assumptions | |||
| Year 1 | Year 2 | Year 3 | |
| Plan Month | 1 | 2 | 3 |
| Current Interest Rate | 10.00% | 10.00% | 10.00% |
| Long-term Interest Rate | 10.00% | 10.00% | 10.00% |
| Tax Rate | 30.00% | 30.00% | 30.00% |
| Other | 0 | 0 | 0 |
8.2 Break-even Analysis
The break-even analysis shows that Massage Tools has a good balance of fixed costs and sufficient sales strength to remain healthy. Our break-even point is just over $6,000 per month for the first year.

| Break-even Analysis | |
| Monthly Revenue Break-even | $6,090 |
| Assumptions: | |
| Average Percent Variable Cost | 45% |
| Estimated Monthly Fixed Cost | $3,359 |
8.3 Projected Profit and Loss
We do expect a significant increase in profitability next year, and in the future, because we will have established ourselves in the market. Our higher sales volume will lower our cost of goods and increase our gross margin. This increase in gross margin is important to profitability.


| Pro Forma Profit and Loss | |||
| Year 1 | Year 2 | Year 3 | |
| Sales | $182,940 | $199,352 | $217,254 |
| Direct Cost of Sales | $82,059 | $89,512 | $97,650 |
| Other Costs of Goods | $11 | $0 | $0 |
| Total Cost of Sales | $82,070 | $89,512 | $97,650 |
| Gross Margin | $100,870 | $109,840 | $119,604 |
| Gross Margin % | 55.14% | 55.10% | 55.05% |
| Expenses | |||
| Payroll | $5,700 | $9,000 | $10,000 |
| Sales and Marketing and Other Expenses | $7,800 | $9,500 | $12,500 |
| Depreciation | $0 | $0 | $0 |
| Rent | $10,200 | $7,200 | $8,500 |
| Utilities | $2,400 | $2,800 | $3,200 |
| Insurance | $4,200 | $4,750 | $5,000 |
| Payroll Taxes | $855 | $1,350 | $1,500 |
| Commission | $9,147 | $9,968 | $10,863 |
| Total Operating Expenses | $40,302 | $44,568 | $51,563 |
| Profit Before Interest and Taxes | $60,568 | $65,272 | $68,041 |
| EBITDA | $60,568 | $65,272 | $68,041 |
| Interest Expense | ($163) | ($450) | ($750) |
| Taxes Incurred | $18,219 | $19,717 | $20,637 |
| Net Profit | $42,511 | $46,005 | $48,154 |
| Net Profit/Sales | 23.24% | 23.08% | 22.16% |
8.4 Projected Cash Flow
We expect to manage cash flow over the next three years with new investment this year. The additional financing resources are required to finance the working capital of a growing business. However, the investment is small due to the low overhead.

| Pro Forma Cash Flow | |||
| Year 1 | Year 2 | Year 3 | |
| Cash Received | |||
| Cash from Operations | |||
| Cash Sales | $182,940 | $199,352 | $217,254 |
| Subtotal Cash from Operations | $182,940 | $199,352 | $217,254 |
| Additional Cash Received | |||
| Sales Tax, VAT, HST/GST Received | $0 | $0 | $0 |
| New Current Borrowing | $0 | $0 | $0 |
| New Other Liabilities (interest-free) | $0 | $0 | $0 |
| New Long-term Liabilities | $0 | $0 | $0 |
| Sales of Other Current Assets | $0 | $0 | $0 |
| Sales of Long-term Assets | $0 | $0 | $0 |
| New Investment Received | $0 | $0 | $0 |
| Subtotal Cash Received | $182,940 | $199,352 | $217,254 |
| Expenditures | Year 1 | Year 2 | Year 3 |
| Expenditures from Operations | |||
| Cash Spending | $5,700 | $9,000 | $10,000 |
| Bill Payments | $124,321 | $147,772 | $159,059 |
| Subtotal Spent on Operations | $130,021 | $156,772 | $169,059 |
| Additional Cash Spent | |||
| Sales Tax, VAT, HST/GST Paid Out | $0 | $0 | $0 |
| Principal Repayment of Current Borrowing | $3,000 | $3,000 | $3,000 |
| Other Liabilities Principal Repayment | $0 | $0 | $0 |
| Long-term Liabilities Principal Repayment | $0 | $0 | $0 |
| Purchase Other Current Assets | $0 | $0 | $0 |
| Purchase Long-term Assets | $0 | $0 | $0 |
| Dividends | $0 | $0 | $0 |
| Subtotal Cash Spent | $133,021 | $159,772 | $172,059 |
| Net Cash Flow | $49,919 | $39,580 | $45,195 |
| Cash Balance | $62,619 | $102,198 | $147,394 |
8.5 Projected Balance Sheet
Although we will not begin making a profit until April of this year, we are pleased that we will begin to recoup our investment in only four months. The critical piece of this success is the large margin on each product sold as well as the low operational expenses.
| Pro Forma Balance Sheet | |||
| Year 1 | Year 2 | Year 3 | |
| Assets | |||
| Current Assets | |||
| Cash | $62,619 | $102,198 | $147,394 |
| Inventory | $11,891 | $12,971 | $14,150 |
| Other Current Assets | $5,000 | $5,000 | $5,000 |
| Total Current Assets | $79,510 | $120,169 | $166,544 |
| Long-term Assets | |||
| Long-term Assets | $0 | $0 | $0 |
| Accumulated Depreciation | $0 | $0 | $0 |
| Total Long-term Assets | $0 | $0 | $0 |
| Total Assets | $79,510 | $120,169 | $166,544 |
| Liabilities and Capital | Year 1 | Year 2 | Year 3 |
| Current Liabilities | |||
| Accounts Payable | $14,298 | $11,953 | $13,174 |
| Current Borrowing | ($3,000) | ($6,000) | ($9,000) |
| Other Current Liabilities | $0 | $0 | $0 |
| Subtotal Current Liabilities | $11,298 | $5,953 | $4,174 |
| Long-term Liabilities | $0 | $0 | $0 |
| Total Liabilities | $11,298 | $5,953 | $4,174 |
| Paid-in Capital | $45,000 | $45,000 | $45,000 |
| Retained Earnings | ($19,300) | $23,211 | $69,217 |
| Earnings | $42,511 | $46,005 | $48,154 |
| Total Capital | $68,211 | $114,217 | $162,370 |
| Total Liabilities and Capital | $79,510 | $120,169 | $166,544 |
| Net Worth | $68,211 | $114,217 | $162,370 |
8.6 Business Ratios
Standard business ratios for Health and Personal Care Stores (SIC 5047) are included in the following table. The ratios show a plan for balanced, healthy growth. Our return on sales and return on assets remain as strong as ever, actually increasing in percentage terms by the same year.
| Ratio Analysis | ||||
| Year 1 | Year 2 | Year 3 | Industry Profile | |
| Sales Growth | 0.00% | 8.97% | 8.98% | 6.98% |
| Percent of Total Assets | ||||
| Inventory | 14.96% | 10.79% | 8.50% | 39.84% |
| Other Current Assets | 6.29% | 4.16% | 3.00% | 22.68% |
| Total Current Assets | 100.00% | 100.00% | 100.00% | 91.25% |
| Long-term Assets | 0.00% | 0.00% | 0.00% | 8.75% |
| Total Assets | 100.00% | 100.00% | 100.00% | 100.00% |
| Current Liabilities | 14.21% | 4.95% | 2.51% | 37.11% |
| Long-term Liabilities | 0.00% | 0.00% | 0.00% | 10.41% |
| Total Liabilities | 14.21% | 4.95% | 2.51% | 47.52% |
| Net Worth | 85.79% | 95.05% | 97.49% | 52.48% |
| Percent of Sales | ||||
| Sales | 100.00% | 100.00% | 100.00% | 100.00% |
| Gross Margin | 55.14% | 55.10% | 55.05% | 30.78% |
| Selling, General & Administrative Expenses | 31.96% | 32.18% | 33.13% | 15.53% |
| Advertising Expenses | 0.00% | 0.00% | 0.00% | 1.18% |
| Profit Before Interest and Taxes | 33.11% | 32.74% | 31.32% | 2.01% |
| Main Ratios | ||||
| Current | 7.04 | 20.19 | 39.90 | 2.24 |
| Quick | 5.98 | 18.01 | 36.51 | 0.99 |
| Total Debt to Total Assets | 14.21% | 4.95% | 2.51% | 52.38% |
| Pre-tax Return on Net Worth | 89.03% | 57.54% | 42.37% | 6.06% |
| Pre-tax Return on Assets | 76.38% | 54.69% | 41.31% | 12.72% |
| Additional Ratios | Year 1 | Year 2 | Year 3 | |
| Net Profit Margin | 23.24% | 23.08% | 22.16% | n.a |
| Return on Equity | 62.32% | 40.28% | 29.66% | n.a |
| Activity Ratios | ||||
| Inventory Turnover | 9.88 | 7.20 | 7.20 | n.a |
| Accounts Payable Turnover | 9.69 | 12.17 | 12.17 | n.a |
| Payment Days | 27 | 33 | 29 | n.a |
| Total Asset Turnover | 2.30 | 1.66 | 1.30 | n.a |
| Debt Ratios | ||||
| Debt to Net Worth | 0.17 | 0.05 | 0.03 | n.a |
| Current Liab. to Liab. | 1.00 | 1.00 | 1.00 | n.a |
| Liquidity Ratios | ||||
| Net Working Capital | $68,211 | $114,217 | $162,370 | n.a |
| Interest Coverage | 0.00 | 0.00 | 0.00 | n.a |
| Additional Ratios | ||||
| Assets to Sales | 0.43 | 0.60 | 0.77 | n.a |
| Current Debt/Total Assets | 14% | 5% | 3% | n.a |
| Acid Test | 5.98 | 18.01 | 36.51 | n.a |
| Sales/Net Worth | 2.68 | 1.75 | 1.34 | n.a |
| Dividend Payout | 0.00 | 0.00 | 0.00 | n.a |
Appendix
| Sales Forecast | |||||||||||||
| Month 1 | Month 2 | Month 3 | Month 4 | Month 5 | Month 6 | Month 7 | Month 8 | Month 9 | Month 10 | Month 11 | Month 12 | ||
| Sales | |||||||||||||
| Massage Tool | 0% | $1,062 | $1,322 | $1,966 | $3,346 | $5,664 | $7,538 | $8,206 | $9,922 | $11,040 | $13,560 | $14,066 | $11,140 |
| Massage Tool Deluxe | 0% | $1,886 | $2,506 | $2,502 | $4,462 | $6,352 | $7,122 | $7,346 | $9,348 | $11,520 | $13,674 | $14,290 | $13,100 |
| Total Sales | $2,948 | $3,828 | $4,468 | $7,808 | $12,016 | $14,660 | $15,552 | $19,270 | $22,560 | $27,234 | $28,356 | $24,240 | |
| Direct Cost of Sales | Month 1 | Month 2 | Month 3 | Month 4 | Month 5 | Month 6 | Month 7 | Month 8 | Month 9 | Month 10 | Month 11 | Month 12 | |
| Massage Tool | $531 | $661 | $983 | $1,673 | $2,832 | $3,769 | $4,103 | $4,961 | $5,520 | $6,780 | $7,033 | $5,570 | |
| Massage Tool Deluxe | $754 | $1,002 | $1,001 | $1,785 | $2,541 | $2,849 | $2,938 | $3,739 | $4,608 | $5,470 | $5,716 | $5,240 | |
| Subtotal Direct Cost of Sales | $1,285 | $1,663 | $1,984 | $3,458 | $5,373 | $6,618 | $7,041 | $8,700 | $10,128 | $12,250 | $12,749 | $10,810 | |
| Personnel Plan | |||||||||||||
| Month 1 | Month 2 | Month 3 | Month 4 | Month 5 | Month 6 | Month 7 | Month 8 | Month 9 | Month 10 | Month 11 | Month 12 | ||
| Ron Tickman, President & Owner | 0% | $100 | $100 | $100 | $100 | $100 | $100 | $100 | $100 | $100 | $100 | $100 | $100 |
| Katherine Allen, Sales Rep | 0% | $100 | $150 | $200 | $250 | $300 | $350 | $400 | $450 | $500 | $550 | $600 | $650 |
| Other | 0% | $0 | $0 | $0 | $0 | $0 | $0 | $0 | $0 | $0 | $0 | $0 | $0 |
| Total People | 0 | 0 | 0 | 0 | 0 | 0 | 0 | 0 | 0 | 0 | 0 | 0 | |
| Total Payroll | $200 | $250 | $300 | $350 | $400 | $450 | $500 | $550 | $600 | $650 | $700 | $750 | |
| General Assumptions | |||||||||||||
| Month 1 | Month 2 | Month 3 | Month 4 | Month 5 | Month 6 | Month 7 | Month 8 | Month 9 | Month 10 | Month 11 | Month 12 | ||
| Plan Month | 1 | 2 | 3 | 4 | 5 | 6 | 7 | 8 | 9 | 10 | 11 | 12 | |
| Current Interest Rate | 10.00% | 10.00% | 10.00% | 10.00% | 10.00% | 10.00% | 10.00% | 10.00% | 10.00% | 10.00% | 10.00% | 10.00% | |
| Long-term Interest Rate | 10.00% | 10.00% | 10.00% | 10.00% | 10.00% | 10.00% | 10.00% | 10.00% | 10.00% | 10.00% | 10.00% | 10.00% | |
| Tax Rate | 30.00% | 30.00% | 30.00% | 30.00% | 30.00% | 30.00% | 30.00% | 30.00% | 30.00% | 30.00% | 30.00% | 30.00% | |
| Other | 0 | 0 | 0 | 0 | 0 | 0 | 0 | 0 | 0 | 0 | 0 | 0 | |
| Pro Forma Profit and Loss | |||||||||||||
| Month 1 | Month 2 | Month 3 | Month 4 | Month 5 | Month 6 | Month 7 | Month 8 | Month 9 | Month 10 | Month 11 | Month 12 | ||
| Sales | $2,948 | $3,828 | $4,468 | $7,808 | $12,016 | $14,660 | $15,552 | $19,270 | $22,560 | $27,234 | $28,356 | $24,240 | |
| Direct Cost of Sales | $1,285 | $1,663 | $1,984 | $3,458 | $5,373 | $6,618 | $7,041 | $8,700 | $10,128 | $12,250 | $12,749 | $10,810 | |
| Other Costs of Goods | $0 | $1 | $1 | $1 | $1 | $1 | $1 | $1 | $1 | $1 | $1 | $1 | |
| Total Cost of Sales | $1,285 | $1,664 | $1,985 | $3,459 | $5,374 | $6,619 | $7,042 | $8,701 | $10,129 | $12,251 | $12,750 | $10,811 | |
| Gross Margin | $1,663 | $2,164 | $2,483 | $4,349 | $6,642 | $8,041 | $8,510 | $10,569 | $12,431 | $14,983 | $15,606 | $13,429 | |
| Gross Margin % | 56.40% | 56.52% | 55.58% | 55.70% | 55.28% | 54.85% | 54.72% | 54.85% | 55.10% | 55.02% | 55.04% | 55.40% | |
| Expenses | |||||||||||||
| Payroll | $200 | $250 | $300 | $350 | $400 | $450 | $500 | $550 | $600 | $650 | $700 | $750 | |
| Sales and Marketing and Other Expenses | $1,200 | $600 | $600 | $600 | $600 | $600 | $600 | $600 | $600 | $600 | $600 | $600 | |
| Depreciation | $0 | $0 | $0 | $0 | $0 | $0 | $0 | $0 | $0 | $0 | $0 | $0 | |
| Rent | $850 | $850 | $850 | $850 | $850 | $850 | $850 | $850 | $850 | $850 | $850 | $850 | |
| Utilities | $200 | $200 | $200 | $200 | $200 | $200 | $200 | $200 | $200 | $200 | $200 | $200 | |
| Insurance | $350 | $350 | $350 | $350 | $350 | $350 | $350 | $350 | $350 | $350 | $350 | $350 | |
| Payroll Taxes | 15% | $30 | $38 | $45 | $53 | $60 | $68 | $75 | $83 | $90 | $98 | $105 | $113 |
| Commission | $147 | $191 | $223 | $390 | $601 | $733 | $778 | $964 | $1,128 | $1,362 | $1,418 | $1,212 | |
| Total Operating Expenses | $2,977 | $2,479 | $2,568 | $2,793 | $3,061 | $3,251 | $3,353 | $3,596 | $3,818 | $4,109 | $4,223 | $4,075 | |
| Profit Before Interest and Taxes | ($1,315) | ($315) | ($85) | $1,556 | $3,581 | $4,791 | $5,157 | $6,973 | $8,613 | $10,874 | $11,383 | $9,355 | |
| EBITDA | ($1,315) | ($315) | ($85) | $1,556 | $3,581 | $4,791 | $5,157 | $6,973 | $8,613 | $10,874 | $11,383 | $9,355 | |
| Interest Expense | ($2) | ($4) | ($6) | ($8) | ($10) | ($13) | ($15) | ($17) | ($19) | ($21) | ($23) | ($25) | |
| Taxes Incurred | ($394) | ($93) | ($24) | $469 | $1,078 | $1,441 | $1,551 | $2,097 | $2,590 | $3,269 | $3,422 | $2,814 | |
| Net Profit | ($919) | ($218) | ($55) | $1,095 | $2,514 | $3,362 | $3,620 | $4,893 | $6,042 | $7,627 | $7,984 | $6,566 | |
| Net Profit/Sales | -31.17% | -5.69% | -1.24% | 14.03% | 20.92% | 22.93% | 23.28% | 25.39% | 26.78% | 28.00% | 28.16% | 27.09% | |
| Pro Forma Cash Flow | |||||||||||||
| Month 1 | Month 2 | Month 3 | Month 4 | Month 5 | Month 6 | Month 7 | Month 8 | Month 9 | Month 10 | Month 11 | Month 12 | ||
| Cash Received | |||||||||||||
| Cash from Operations | |||||||||||||
| Cash Sales | $2,948 | $3,828 | $4,468 | $7,808 | $12,016 | $14,660 | $15,552 | $19,270 | $22,560 | $27,234 | $28,356 | $24,240 | |
| Subtotal Cash from Operations | $2,948 | $3,828 | $4,468 | $7,808 | $12,016 | $14,660 | $15,552 | $19,270 | $22,560 | $27,234 | $28,356 | $24,240 | |
| Additional Cash Received | |||||||||||||
| Sales Tax, VAT, HST/GST Received | 0.00% | $0 | $0 | $0 | $0 | $0 | $0 | $0 | $0 | $0 | $0 | $0 | $0 |
| New Current Borrowing | $0 | $0 | $0 | $0 | $0 | $0 | $0 | $0 | $0 | $0 | $0 | $0 | |
| New Other Liabilities (interest-free) | $0 | $0 | $0 | $0 | $0 | $0 | $0 | $0 | $0 | $0 | $0 | $0 | |
| New Long-term Liabilities | $0 | $0 | $0 | $0 | $0 | $0 | $0 | $0 | $0 | $0 | $0 | $0 | |
| Sales of Other Current Assets | $0 | $0 | $0 | $0 | $0 | $0 | $0 | $0 | $0 | $0 | $0 | $0 | |
| Sales of Long-term Assets | $0 | $0 | $0 | $0 | $0 | $0 | $0 | $0 | $0 | $0 | $0 | $0 | |
| New Investment Received | $0 | $0 | $0 | $0 | $0 | $0 | $0 | $0 | $0 | $0 | $0 | $0 | |
| Subtotal Cash Received | $2,948 | $3,828 | $4,468 | $7,808 | $12,016 | $14,660 | $15,552 | $19,270 | $22,560 | $27,234 | $28,356 | $24,240 | |
| Expenditures | Month 1 | Month 2 | Month 3 | Month 4 | Month 5 | Month 6 | Month 7 | Month 8 | Month 9 | Month 10 | Month 11 | Month 12 | |
| Expenditures from Operations | |||||||||||||
| Cash Spending | $200 | $250 | $300 | $350 | $400 | $450 | $500 | $550 | $600 | $650 | $700 | $750 | |
| Bill Payments | $79 | $2,373 | $2,136 | $2,401 | $7,236 | $11,242 | $12,207 | $12,023 | $15,713 | $17,615 | $21,256 | $20,040 | |
| Subtotal Spent on Operations | $279 | $2,623 | $2,436 | $2,751 | $7,636 | $11,692 | $12,707 | $12,573 | $16,313 | $18,265 | $21,956 | $20,790 | |
| Additional Cash Spent | |||||||||||||
| Sales Tax, VAT, HST/GST Paid Out | $0 | $0 | $0 | $0 | $0 | $0 | $0 | $0 | $0 | $0 | $0 | $0 | |
| Principal Repayment of Current Borrowing | $250 | $250 | $250 | $250 | $250 | $250 | $250 | $250 | $250 | $250 | $250 | $250 | |
| Other Liabilities Principal Repayment | $0 | $0 | $0 | $0 | $0 | $0 | $0 | $0 | $0 | $0 | $0 | $0 | |
| Long-term Liabilities Principal Repayment | $0 | $0 | $0 | $0 | $0 | $0 | $0 | $0 | $0 | $0 | $0 | $0 | |
| Purchase Other Current Assets | $0 | $0 | $0 | $0 | $0 | $0 | $0 | $0 | $0 | $0 | $0 | $0 | |
| Purchase Long-term Assets | $0 | $0 | $0 | $0 | $0 | $0 | $0 | $0 | $0 | $0 | $0 | $0 | |
| Dividends | $0 | $0 | $0 | $0 | $0 | $0 | $0 | $0 | $0 | $0 | $0 | $0 | |
| Subtotal Cash Spent | $529 | $2,873 | $2,686 | $3,001 | $7,886 | $11,942 | $12,957 | $12,823 | $16,563 | $18,515 | $22,206 | $21,040 | |
| Net Cash Flow | $2,419 | $955 | $1,782 | $4,807 | $4,130 | $2,718 | $2,595 | $6,447 | $5,997 | $8,719 | $6,150 | $3,200 | |
| Cash Balance | $15,119 | $16,073 | $17,855 | $22,662 | $26,792 | $29,510 | $32,106 | $38,553 | $44,549 | $53,268 | $59,419 | $62,619 | |
| Pro Forma Balance Sheet | |||||||||||||
| Month 1 | Month 2 | Month 3 | Month 4 | Month 5 | Month 6 | Month 7 | Month 8 | Month 9 | Month 10 | Month 11 | Month 12 | ||
| Assets | Starting Balances | ||||||||||||
| Current Assets | |||||||||||||
| Cash | $12,700 | $15,119 | $16,073 | $17,855 | $22,662 | $26,792 | $29,510 | $32,106 | $38,553 | $44,549 | $53,268 | $59,419 | $62,619 |
| Inventory | $8,000 | $6,715 | $5,051 | $3,067 | $3,804 | $5,910 | $7,280 | $7,746 | $9,570 | $11,141 | $13,475 | $14,024 | $11,891 |
| Other Current Assets | $5,000 | $5,000 | $5,000 | $5,000 | $5,000 | $5,000 | $5,000 | $5,000 | $5,000 | $5,000 | $5,000 | $5,000 | $5,000 |
| Total Current Assets | $25,700 | $26,833 | $26,125 | $25,923 | $31,466 | $37,702 | $41,790 | $44,851 | $53,123 | $60,690 | $71,743 | $78,443 | $79,510 |
| Long-term Assets | |||||||||||||
| Long-term Assets | $0 | $0 | $0 | $0 | $0 | $0 | $0 | $0 | $0 | $0 | $0 | $0 | $0 |
| Accumulated Depreciation | $0 | $0 | $0 | $0 | $0 | $0 | $0 | $0 | $0 | $0 | $0 | $0 | $0 |
| Total Long-term Assets | $0 | $0 | $0 | $0 | $0 | $0 | $0 | $0 | $0 | $0 | $0 | $0 | $0 |
| Total Assets | $25,700 | $26,833 | $26,125 | $25,923 | $31,466 | $37,702 | $41,790 | $44,851 | $53,123 | $60,690 | $71,743 | $78,443 | $79,510 |
| Liabilities and Capital | Month 1 | Month 2 | Month 3 | Month 4 | Month 5 | Month 6 | Month 7 | Month 8 | Month 9 | Month 10 | Month 11 | Month 12 | |
| Current Liabilities | |||||||||||||
| Accounts Payable | $0 | $2,302 | $2,061 | $2,165 | $6,862 | $10,835 | $11,810 | $11,501 | $15,130 | $16,905 | $20,582 | $19,547 | $14,298 |
| Current Borrowing | $0 | ($250) | ($500) | ($750) | ($1,000) | ($1,250) | ($1,500) | ($1,750) | ($2,000) | ($2,250) | ($2,500) | ($2,750) | ($3,000) |
| Other Current Liabilities | $0 | $0 | $0 | $0 | $0 | $0 | $0 | $0 | $0 | $0 | $0 | $0 | $0 |
| Subtotal Current Liabilities | $0 | $2,052 | $1,561 | $1,415 | $5,862 | $9,585 | $10,310 | $9,751 | $13,130 | $14,655 | $18,082 | $16,797 | $11,298 |
| Long-term Liabilities | $0 | $0 | $0 | $0 | $0 | $0 | $0 | $0 | $0 | $0 | $0 | $0 | $0 |
| Total Liabilities | $0 | $2,052 | $1,561 | $1,415 | $5,862 | $9,585 | $10,310 | $9,751 | $13,130 | $14,655 | $18,082 | $16,797 | $11,298 |
| Paid-in Capital | $45,000 | $45,000 | $45,000 | $45,000 | $45,000 | $45,000 | $45,000 | $45,000 | $45,000 | $45,000 | $45,000 | $45,000 | $45,000 |
| Retained Earnings | ($19,300) | ($19,300) | ($19,300) | ($19,300) | ($19,300) | ($19,300) | ($19,300) | ($19,300) | ($19,300) | ($19,300) | ($19,300) | ($19,300) | ($19,300) |
| Earnings | $0 | ($919) | ($1,137) | ($1,192) | ($97) | $2,418 | $5,780 | $9,400 | $14,293 | $20,335 | $27,961 | $35,946 | $42,511 |
| Total Capital | $25,700 | $24,781 | $24,563 | $24,508 | $25,603 | $28,118 | $31,480 | $35,100 | $39,993 | $46,035 | $53,661 | $61,646 | $68,211 |
| Total Liabilities and Capital | $25,700 | $26,833 | $26,125 | $25,923 | $31,466 | $37,702 | $41,790 | $44,851 | $53,123 | $60,690 | $71,743 | $78,443 | $79,510 |
| Net Worth | $25,700 | $24,781 | $24,563 | $24,508 | $25,603 | $28,118 | $31,480 | $35,100 | $39,993 | $46,035 | $53,661 | $61,646 | $68,211 |


