
Cents and Senseibility Value-Priced Martial Arts School
Executive Summary
The Can-Am Taekwondo Instructors and Schools Confederation has been active in the United States for the past 30 years. Being part of this organization will benefit Cents and Senseibility Martial Arts School owned and operated by Rolly BonTemps, 5th Degree Black Belt.
The Can-Am Taekwondo Instructors and Schools Confederation (CATISC) is the premier North American organization dedicated to the martial arts discipline of taekwondo, and is the founding organization of other international affiliates, overseeing over 1,500 schools and clubs, registering over 300,000 members.
The focus of this program is to provide students the highest quality martial arts instruction available, in a safe and positive learning environment that people of all ages can enjoy. Rolly BonTemps, a high ranking instructor, will combine excellent student instructor ratios with state of the art training facilities. Instructor Rolly BonTemps, is a graduate of an instructor program that represents more than thirty years of research and development. He will be with students every step of the way to help them reach their individual goals (and maybe even reach some new goals they’ve never before thought possible).
Cents and Senseibility will be value-priced taekwondo martial arts school serving its customers in our community by providing several programs for a variety of purposes, ranging from basic martial arts, to self defense, to esteem and life skills building, and more. Cents and Senseibility Martial Arts School plans to enhance its programs as it expands, developing new programs to ensure the students have as much access to the different aspects of Songahm Taekwondo as possible.
The art of self defense is becoming more and more popular with the young people of this country as the terrorist threats to this country have become reality. Cents and Senseibility Martial Arts School will also offer self-defense techniques to local Law Enforcement in the area.
Cents and Senseibility will offer what we believe is the best martial art in the world. Taekwondo is an exciting and powerful martial art known for its dynamic kicking and hand techniques. Although these martial art techniques are centuries old, the planned programs being offered are always evolving to keep pace with the rapidly changing world.
Cents and Senseibility Martial Arts School realizes that each student possesses different physical abilities. Size and strength vary with each individual. Once a student has acquired a strong foundation in the basics, Rolly BonTemps’ outlined program will enhance the student’s physical capabilities and maximize his/her self-defense skills.
Cents and Senseibility Martial Arts School, is not interested in just teaching self-defense. Rolly BonTemps, as a certified instructor remains interested in the complete personal development of each student. Individual attention is a feature of each and every class, allowing all students to progress quickly and confidently toward their personal goals. Rolly BonTemps takes his responsibility as a role model for younger students seriously, teaching them the importance of strong character, leadership and good values.
The teaching curriculum at the Cents and Senseibility Martial Arts School is based on two concepts: “positive mental attitude” and “high goal setting.” Rolly BonTemps is so positive about this program that he promises to give students and their families the most professional, well supervised, and highest quality classes available in any sport or art.
Future plans call for Cents and Senseibility to expand into Cardio Kick Boxing Classes for the young adults. Pilates (fitness exercise) Classes will also be offered to young and older adults.
Enrollment for the Cents and Senseibility Martial Arts School is projected at 120-125 students as the break-even point for profitability. Under the value-priced structure being planned, based on past experience in marketing and selling the different plans, Cents and Senseibility Martial Arts School is projecting 100-120 student enrollments within the first 6-8 months after opening. Student enrollment in the Cardio Kick Boxing classes is projected at 45-50, and the Pilates Exercising Classes are projected at 30-45 enrollments within the first six months after opening.
Our financial plan is based on reaching our target sales goals while maintaining a reasonable cost base. We plan to reach break-even sales volume in only four months after our opening and maintain a healthy 30+% bottom line profitability. If we reach our financial goals, we plan to acquire a stand-alone building for the Cents and Senseibility Martial Arts School, which may better suit our growing needs.
1.1 Objectives
- Identify an area within the community that is centrally located to local Elementary, Middle and High Schools by mid-summer 2003.
- Enter into lease agreement for 2,500-3,000 square foot (minimum) premises to establish Cents and Senseibility Martial Arts School. This area will include store front and visitor seating area, dressing/rest rooms for male and female students.
- Actively recruit membership. The marketing plan to be adopted has been extremely successful at other taekwondo schools across the country. The success of this plan depends upon arranging with school administrations to visit local classrooms, especially at the Elementary School Level and provide a show and tell. Here it is demonstrated to the children what the martial art can teach them. Concentrating on discipline, self respect and self control, Rolly BonTemps works with the children for approximately one hour in the classroom setting. The success of this program over the past four years has been remarkable. As a result of this marketing plan, the membership for Cents and Senseibility Martial Arts School is expected to grow by 8-10 children a week. The martial arts school, in which Rolly BonTemps is currently employed as lead instructor, has the highest membership for a single CATISC member Taekwondo school in the country. This was largely due to this marketing plan, which Cents and Senseibility will be following.
- Cents and Senseibility Martial Arts School will actively seek out membership by marketing and handing out fliers, business cards, and advertisements at the local shopping centers, malls, and grocery stores in the area. This is expected to generate 8-10 members a week.
- Cents and Senseibility Martial Arts School will offer Cardio Kick Boxing Classes for both the young and older adults. This will actively be marketed through handing out fliers, business cards, and advertisements. This is expected to generate 10-15 members for each of the first three months. Maintaining a class of 45-50 students by end of year one.
- Cents and Senseibility will offer Pilates Classes for young and older adults. Pilates is an aerobic exercise through stretching that is sweeping the country. The plan is to have a certified instructor by month one. Classes are expected to be enrolled at 10-15 members for each of the first three months. Maintaining a class of 45-50 students by the end of the first year.
- Cents and Senseibility plans to increase paid membership to 180-200 by the end of the first year (equivalent to 80% of school capacity).
- Develop a cash flow that allows for an investment build-up to support expansion, with plans to construct and own a stand-alone structure to support the functions of the Cents and Senseibility Martial Arts School in the future.
1.2 Mission
To offer students the best in martial arts training, physically and mentally, Cents and Senseibility Martial Arts School will be established to provide a place where one can learn the art of Taekwondo and enjoy the experience while making the commitment to learn and improve one’s self esteem, concentration, discipline and self control. As students advance in rank from white to black belt they will gain the knowledge and experience that will last a lifetime.

1.3 Keys to Success
- Implement a solid budget and business plan.
- Establish a unique, modern, safe and clean martial arts school and environment.
- Focus on a good marketing plan to actively recruit students.
- Keep the students and family members happy and part of the Cents and Senseibility family.
- Plan on expanding to multiple locations.
Company Summary
Cents and Senseibility Martial Arts School is associated with the Can-Am Taekwondo Instructors and Schools Confederation, a nationally recognized martial arts organization with over 1,500 active member schools across the United States. CATISC is one of the most successful martial arts organizations in the world.
Cents and Senseibility will serve a large community area. It will offer group and individual classes in the art of Taekwondo and self defense. Classes will also be provided in Cardio Kick Boxing and Pilates exercising. As Cents and Senseibility grows, future plans include to expand and accommodate a health club exercise gym to be offered for parents to enjoy while the children are in classes.
The initial Cents and Senseibility Martial Arts School store front will be located on a major street within a shopping center, with ample parking.
2.1 Company Ownership
Cents and Senseibility Martial Arts School will be operated as a sole proprietorship by owner Rolly BonTemps, Fifth Degree Black Belt. All proceeds from membership, programs, tournaments, merchandise and other school activities are that of the owner.
Cents and Senseibility will be affiliated with the Can-Am Taekwondo Instructors and Schools Confederation. Cents and Senseibility Martial Arts School will be obligated to pay the Can-Am Taekwondo Instructors and Schools Confederation approximately 15% of all testing fees. All other income will be that of the owner.
2.1.1 Fulfillment
Trained black belt instructors are the #1 resource. These instructors are well versed in the training of Taekwondo and are selected based upon their knowledge and ability to work with students. Instructors are not paid, rather they are members of the inner circle of the do-jahng, a club of top students. Instructors are given free membership and access to the do-jahng and receive payment for private lessons they perform on a contract basis. Instructor materials (i.e., belts, weapons) are provided free for their participation in training of students.
As the Cents and Senseibility Martial Arts School opens its doors, it will be actively seeking members with experience in the martial art of Songahm Taekwondo. Often times students are moving into the area and are looking for the nearest Can-Am Taekwondo Instructors and Schools Confederation affiliated school.
In the eventuality that no experienced instructors are available, the CATISC has several schools in nearby cities that could make instructors available should the owner become injured or disabled.
Also, within the first year of operation, students will progress through the belt ranks to achieve senior student status. Under the watchful eye of the instructor these students will be trained to assist with lower rank classes and be given the opportunity to join the inner circle of instructor ranks.
The Can-Am Taekwondo Instructors and Schools Confederation is very large and if immediate assistance is required due to some unforeseen circumstance, the organization would assist in all ways possible to assist the school owner.
2.2 Start-up Summary
The start-up funding requirements are estimated below. This amount ear-marked for start-up expenses, includes carpeting the floor, installing mirrors, restrooms and and office area, front desk sales counter and store front sign. The remaining funds will be applied to rent of the commercial property until profits are generated. In addition, the company will require some initial cash reserves and additional assets. The start-up costs are to be financed by the equity contributions of the owner, Rolly BonTemps, and his parents, as well as by a three-year commercial loan. These start-up expenses and funding requirements are summarized in the tables below.
The initial start-up for Cents and Senseibility will be relatively inexpensive. Martial arts schools do not require a substantial buildout to open their doors with a large overhead. The insurance needed to operate the Cents and Senseibility Martial Arts School will be offered by the Can-Am Taekwondo Instructors and Schools Confederation. The school will open with a one million dollar liability policy being offered.
CATISC will also provide the Cents and Senseibility Martial Arts School with a school number to open under the Can-Am Taekwondo Instructors and Schools Confederation organizational umbrella. All other required licenses to own and operate a small business will be obtained through the local community in which the do-jahng is located.
CATISC offers future martial arts school owners with a Business Clinic, outlining all the requirements needed to open a successful Taekwondo school.

| Start-up Funding | |
| Start-up Expenses to Fund | $36,000 |
| Start-up Assets to Fund | $59,000 |
| Total Funding Required | $95,000 |
| Assets | |
| Non-cash Assets from Start-up | $15,000 |
| Cash Requirements from Start-up | $44,000 |
| Additional Cash Raised | $0 |
| Cash Balance on Starting Date | $44,000 |
| Total Assets | $59,000 |
| Liabilities and Capital | |
| Liabilities | |
| Current Borrowing | $0 |
| Long-term Liabilities | $60,000 |
| Accounts Payable (Outstanding Bills) | $0 |
| Other Current Liabilities (interest-free) | $0 |
| Total Liabilities | $60,000 |
| Capital | |
| Planned Investment | |
| Rolly BonTemps | $25,000 |
| Parents | $10,000 |
| Other | $0 |
| Additional Investment Requirement | $0 |
| Total Planned Investment | $35,000 |
| Loss at Start-up (Start-up Expenses) | ($36,000) |
| Total Capital | ($1,000) |
| Total Capital and Liabilities | $59,000 |
| Total Funding | $95,000 |
| Start-up | |
| Requirements | |
| Start-up Expenses | |
| Legal | $800 |
| Stationery etc. | $500 |
| Brochures | $300 |
| Consultants | $0 |
| Insurance | $900 |
| Rent | $3,500 |
| Expensed Equipment | $5,000 |
| Facility Renovations | $25,000 |
| Total Start-up Expenses | $36,000 |
| Start-up Assets | |
| Cash Required | $44,000 |
| Start-up Inventory | $5,000 |
| Other Current Assets | $0 |
| Long-term Assets | $10,000 |
| Total Assets | $59,000 |
| Total Requirements | $95,000 |
2.3 Company Location
Cents and Senseibility Martial Arts School will be located in a major shopping center. Plans are to open a Taekwondo Center in a 3,000 square foot facility with a 1,800 square foot training area, 300 square foot viewing area (lobby) with a receptionist desk, large men’s and women’s dressing areas, showers and rest room facilities. There will be two offices, one will be used for storage and the other for the main office.
Plans are to have the building face a major street and have considerable foot and drive-by traffic. Parking will be available in the shopping center. The facility will be leased yearly, with plans for constructing or purchasing an independent building in future years.
Services
Cents and Senseibility Martial Arts School provides services to improve fitness and the capacity for self-defense, the Songahm Taekwondo is not just a physical activity. Taekwondo “is the martial art that trains people physically and mentally.” In addition to physical fitness, Taekwondo classes promote discipline, honor, self-control, respect, courtesy, perseverance and loyalty. Cents and Senseibility specializes in teaching ages 3-63. When students join they will not only be improving their fitness and learning to defend themselves, they will be embarking on a path to improve many important aspects of their lives. And the truly wonderful thing is they get to have fun while doing it!
Here are some benefits you can expect from training in Taekwondo:
- Fitness – The principles of Taekwondo techniques are based on the design of the human body. For power the body develops the larger, powerful muscles of the torso. The speed of the techniques comes from the fast, agile muscles of the arms and legs. As students progress in Taekwondo, they learn to coordinate this speed and power, and develop a concentration to focus all of their body’s strength into a small, hard striking surface like the edge of the hand or the heel of a foot.
- Self-defense – When the speed and power developed through Taekwondo is used in a self-defense situation against the vulnerable parts of an attacker’s body, the results can be incredible. Taekwondo allows a woman to emphasize many of her natural physical strengths, such as power in the legs, while learning a method of self-defense efficient against a much larger opponent. Knowing they can defend themselves, the student’s confidence will grow. And confidence alone is usually enough to deter potential attackers.
- Self-confidence – This does not come naturally for many people, but self-confidence can be developed over a period of time. Through Taekwondo, as students accomplish new goals, their confidence level increases. Taekwondo instils a sense of discipline and self confidence that can carry over to all aspects of life.
Five individual programs for different age and skill levels are presented in the following subtopics.
3.1 Tiny Tots Taekwondo Program
Cents and Senseibility Martial Arts School will offer Tiny Tots Taekwondo program. The 3T program was developed specifically for preschool children ages 3 through 6. This program offers children a strong foundation in essential character qualities such as courtesy, respect, and discipline. In addition, the program is designed to improve children’s motor skills and enhance their ability to pay attention and follow directions. All classes are taught using the most safe, fun, and exciting instruction methods available for this age group.
- Class will be held in the early evening and on Saturday
- Classes will be taught by Rolly BonTemps (5th Degree Black Belt) or experienced Certified Black Belt Instructor.
3Ts have their own unique achievement patch and “Starbursts.” Starbursts are earned with slight modifications in recognition of the preschool age of the child. Four different colored achievement patches are available to accommodate all the stars that can be earned by a high achieving 3T. The rank and testing system used by the 3Ts is slightly different from that of our regular programs. 3Ts can earn six collectable animal patches to display on the belts as follows: Lynx for orange belt; Jaguar for yellow; Badger for camo; Bear for green; Kestrel for purple; Falcon for blue. All six patches, as earned, can be displayed on the child’s belt.
Upon graduation from the 3T program students will be afforded the Basic, Black Belt Club, or Masters Club Program.
3.2 Basic Program
The Basic Program is for children and adults of all ages. Under this program the student will receive, upon membership, two times a week instruction in the basic core skills of Taekwondo. Classes will be divided by age groups.
- Classes will be held in the early and late evening and also on Saturdays.
- Classes will be taught by Rolly BonTemps (5th Degree Black Belt) or experienced black belt instructor.
3.3 Black Belt Club Program
The Black Belt Program is for children and adults of all ages. Students in this program will receive instructions three times weekly. This program also features free sparring, board breaking and street self-defense. Classes will be divided according to age group and rank.
- Classes will be held in the early and late evening and also on Saturdays.
- Classes will be taught by Rolly BonTemps (5th Degree Black Belt) or experienced black belt instructor.
3.4 Master Club Program
The Masters Club Program is for children and adults of all ages. All students will be encouraged to graduate into this program as they progress and experience the art of Taekwondo. This program provides unlimited weekly instruction. This program also features free sparring, board breaking, street self-defense and weapons training. This program offers the complete package for Self-Defense Classes and will hold the largest portion of the Cents and Senseibility Martial Arts School enrollment. Class instruction will be divided according to age group and rank.
- Classes will be held in the early and evening hours and also on Saturdays.
- Classes will be taught by Rolly BonTemps (5th Degree Black Belt) or experienced black belt instructor.
WEAPON TRAINING
- Single Ssahng Jeol Bong
- Double Ssahng Jeol Bong (Level I, II)
- Single Bahng Mahng Ee
- Double Bahng Mahng Ee (Level I, II)
- Jee Pahng Ee
- Jahng Bong (Level I, II)
- 3-Sectional Staff
- Sword
- Knife Throwing
SELF-DEFENSE TRAINING
- Joint Manipulation (Level I, II)
- Ground Fighting (Level I, II, III)
- Breathing Exercises
- Olympic Style Gyeoroogi
- Modern Tai Chi (Level I, II, III, IV, V, VI)
- PPCT Defensive Tactics
- PPCT Spontaneous Knife Defense
- PPCT Pressure Point Control Tactics
- PPCT Sexual Harassment / Rape Prevention
3.5 Belts And Rank
The concept of belts and rank is probably one that most people associate with Taekwondo and martial arts in general, even if they only have a passing interest in the subject.
In Songahm Taekwondo, our belts reflect a member’s proven level of competence and (just as importantly) the progression of colors reflects an inner journey that never truly ends. Each belt achieved is truly an accomplishment worthy of respect. It is also worth noting that achieving a belt isn’t just a matter of “spending enough time” in a previous belt. In order to achieve their next rank, a student must demonstrate their proficiency in their current belt’s techniques, to include Basic Moves, Sparring and Forms.
CATISC SONGAHM TAEKWONDO BELTS (RANKS)
White Belt
“Pure and without the knowledge of Songahm Taekwondo. As with the Pine Tree, the seed must now be planted and nourished to develop strong roots.” The student has no knowledge of Songahm Taekwondo and begins with a clean (pure) slate. Purity is often signified by the color white.
Orange Belt
“The sun is beginning to rise. As with the morning’s dawn, only the beauty of the sunrise is seen rather than the immense power.” The beginner student sees the beauty of the art of Taekwondo but has not yet experienced the power of the technique. Orange is found among the many colors of the sunrise.
Yellow Belt
“The seed is beginning to see the sunlight.” The student begins to understand the basics of Taekwondo. The sun appears to be yellow.
Camouflage (Camo) Belt
“The sapling is hidden amongst the taller pines and must now fight its way upward.” The student begins to realize his/her place in the world’s largest martial art. The student must now begin to spar in order to promote in rank. Camouflage (greens) is used to hide among the trees in the forest.
Green Belt
“The pine tree is beginning to develop and grow in strength.” The student’s technique is developing power. The components of the basic techniques are beginning to work in unison. As the pine tree develops, it sprouts green pine needles.
Purple Belt
“Coming to the mountain. The tree is in the mid-growth and now the path becomes steep.” The student has crossed over into a higher level of Songahm Taekwondo. The techniques, poom-sae (forms), and level of gyeo-roo-gi (sparring) becomes more difficult, creating a “mountain” that must be overcome. Mountains are often depicted as being purple.
Blue Belt
“The tree reaches for the sky toward new heights.” Having passed the mid-way point, the student focuses his/her energy upward toward black belt. The sky appears as blue.
Brown Belt
“The tree is firmly rooted in the earth.” At this point the student has mastered the basics and developed deep roots in Taekwondo. Brown is known as an earthy color, such as dirt.
Red Belt
“The sun is setting. The first phase of growth has been accomplished.” The first day (the period of time from white belt to red belt) of growth is coming to an end. The physical skill has been developed but lacks control; therefore, physical and mental discipline must now be achieved. Variations of red are found among the many colors of the sunset.
Red/Black Belt
“The dawn of a new day. The sun breaks through the darkness.” The previous day has ended, giving way to a new dawn. The student must begin a new phase of training; that of being a black belt. The red is the sun (in a sunrise) as it breaks through the black of night.
Black Belt
“The tree has reached maturity and has overcome the darkness… it must now ‘plant seeds for the future.'” The color black is created when all the colors of the light spectrum have been absorbed into an object. That object has “taken control” of the colors and retained them. If one color was to “escape”, the object would no longer be black but would appear as that color. The student has mastered the nine geup (grades) of Taekwondo. He/she has “absorbed” all the knowledge of the color ranks and overcome or “mastered” that level or training. The colors of the spectrum are bound together and are not reflected off an object, resulting in the absence of color, which we call black.
Market Analysis Summary
Cents and Senseibility Martial Arts School will be owned and operated by Rolly BonTemps, 5th Degree Black Belt of the Can-Am Taekwondo Instructors and Schools Confederation. Rolly BonTemps has been a Martial Arts Instructor for 10 years and has been studying the art of Taekwondo for 17 years.
Currently positioned as Lead Instructor in Metroburb, Rolly BonTemps has been actively involved with all aspects of the business and is now ready to own and operate Cents and Senseibility Martial Arts School. Since working in the Metroburb school, Rolly has developed a marketing plan that reaches out and actively seeks out membership. Through this plan the Metroburb school has nearly doubled in membership over the past two years. This school is now one of the top three single schools in the nation for membership.
Rolly BonTemps has devoted himself to the teaching of Taekwondo because he believes it makes a difference in our young children’s lives. Through the instruction of martial arts the parents can visually see the difference in their child’s daily behavior, attention span and their courtesy towards one another and the adult community. Seeing children develop and fine tune their skills as they progress through the belt levels to Black Belt is not only a joy for the instructors, but also for the parents as they watch their child mature into a fine young adult. An adult that walks with pride and gleam with self confidence.
The Can-Am Taekwondo Instructors and Schools Confederation is one of the largest martial arts organizations in North America today. Rolly BonTemps believes in it, is devoted to it, and plans to have the number one single school in the country. By achieving this goal, the Cents and Senseibility Martial Arts School will have helped hundreds of adults and children achieve their goal of becoming more confident in their actions and themselves. This will also develop the future leaders and Black Belts of tomorrow.
The demographic research has shown opportunity exists in our local marketplace. There are no CATISC affiliated Taekwondo martial arts schools in the area. A tremendous opportunity for growth exists in this market and Cents and Senseibility believes that our position as the potential leader in our marketplace is not an impossible task.
4.1 Market Segmentation
National sources relating to sports in general and martial arts specifically, it is estimated that 15% of the U.S. population have participated in some form of martial arts training during their lifetime.
It is estimated that 3% to 5% of the U.S. population are currently active in some form of martial arts training (the variation in numbers is a result of some surveys using Tai Chi, Kick boxing and Yoga as a martial art form, and some include school programs, where others do not).
Cents and Senseibility Martial Arts School will be located in a county with a population of 251,377 (Our County 2000 census). The population of Our County broken down by gender is 50.1% male and 49.9% female; broken by race; 87.4% White, 19.6% Hispanic (Latino), 5.5% African American and 0.8% Asian. The median age in the city is 44.1. The Neighboring County has a population of 440,888 (Lee County 2000 census). The population of Neighboring County broken by down by gender is 48.9% male and 51.1% female; broken by race – 87.7% White, 9.5% Hispanic (Latino), 6.6% African American and .08% Asian. The median age in the county is 45.2.
For purposes of this plan, we are going to address Our County (pop. 251,377, average age 44.1) with plans to expand to Neighboring County as we grow and prosper. The Census results indicate the following breakdown related to age groups for this area:
Our County Population 251,377 Neighboring County Population 440,888
| Under 5 years old |
13,441 |
5.3% |
22,970 |
5.2% |
| 5 to 9 years old |
14,444 |
5.7% |
24,224 |
5.5% |
|
10 to 14 years old |
13,677 |
5.4% |
25,034 |
5.7% |
|
15 to 19 years old |
3,382 |
5.3% |
22,501 |
5.1% |
|
20 to 24 years old |
11,708 |
4.7% |
18,816 |
4.3% |
|
25 to 34 years old |
28,262 |
11.2% |
46,491 |
10.5% |
|
35 to 44 years old |
33,458 |
13.3% |
59,232 |
13.4% |
|
45 to 54 years old |
29,515 |
11.7% |
54,833 |
12.4% |
|
55 to 59 years old |
15,518 |
6.2% |
26,820 |
6.1% |
|
60 to 64 years old |
16,459 |
6.5% |
27,856 |
6.3% |
|
65 to 74 years old |
35,088 |
14.0% |
60,563 |
13.7% |
|
75 to 84 years old |
21,060 |
8.4% |
40,630 |
9.2% |
|
85 and older |
5,365 |
2.1% |
10,918 |
2.5% |
Results from a national survey on martial arts schools indicated on average, kids ages 4-14 account for 70% of the individuals participating in martial arts training. Age groups 15-25, 26-49, and 50+ each account for approximately 10% of students enrolled in martial arts training. (In comparison to the CATISC School where Rolly BonTemps has instructed the membership was as follows: ages 4-14 (53%), 15-29 (12%), 30-49 (28%) and 50+ (7%)). Applying the national survey’s age segment enrollment statistics to the Census data on the age groups of Our County, we estimate our target market to be around 51,000 potential students.
The table below outlines our estimated breakdown of the potential market by the age groups.

| Market Analysis | |||||||
| Year 1 | Year 2 | Year 3 | Year 4 | Year 5 | |||
| Potential Customers | Growth | CAGR | |||||
| Kids under 14 years | 2% | 29,093 | 29,675 | 30,268 | 30,874 | 31,491 | 2.00% |
| Young adults 15-25 | 2% | 3,960 | 4,039 | 4,120 | 4,202 | 4,286 | 2.00% |
| Adults 26-49 | 2% | 9,133 | 9,316 | 9,502 | 9,692 | 9,886 | 2.00% |
| Adults over 50 | 2% | 9,349 | 9,536 | 9,727 | 9,921 | 10,120 | 2.00% |
| Total | 2.00% | 51,535 | 52,566 | 53,617 | 54,689 | 55,783 | 2.00% |
4.2 Target Market Segment Strategy
The target market has been broken into four age segments, all within the city limits and surrounding area. The strategy is based on the research confirmed by the statistics of the Can-Am Taekwondo Instructors and Schools Confederation and data collected as Lead Instructor from affiliated CATISC Schools. Parents want their children to learn karate to build confidence and to learn self defense, adults take karate for exercise and self-defense, and seniors take karate for social aspects and exercise.
While not specifically addressed, Cents and Senseibility Martial Arts School will be placing emphasis on the Hispanic (Latino) market as their population continues to increase in this area. Cents and Senseibility will also be targeting addresses with ZIP codes in medium and higher income brackets within our market, but not specifically in this plan.
Target market breakdown is as follows:
- Parents of kids ages 3-14: This market, is projected to provide the largest potential of students and offers the most potential for new members. In accordance with the Can-Am Taekwondo Instructors and Schools Confederation statistics this group accounts for 70% of our membership of which 67% are male and 33% female.
- Young Adults 15 -25: This market is projected to provide 10% of the market in accordance with the CATISC statistics. This group of the market will be targeted to increase the membership. The Cardio Kick boxing being offered is targeted to young adults as a fitness program.
- Adults 26-49: This market is projected to provide 10% of membership in accordance with the CATISC statistics. Cents and Senseibility will target this group to increase by 20% through Pilates Classes. This generally attracts adult population. Targeting this group will be to offer an alterative to health clubs and/or fitness centers. In addition, this group “controls” the number one market, their kids.
- Adults over 50: This is our unknown market. This group only accounts for 10% of the membership in accordance with the CATISC statistics. It is felt that our traditional martial arts services may be too rigorous and may not meet their “social” and “exercise” needs. However with the introduction of Pilates Classes this market may increase in participation and provide additional membership.
4.2.1 Market Needs
Based on a needs analysis taken at Rolly BonTemps’ current location in Metroburb, it was found that our survey was comparable to that of the national survey, reflecting similar results. Our marketing efforts will be addressing the needs of these groups in the order given:
- Kids 3-14 ( as outlined by both the kids and their parents): self-confidence, fun, exercise, discipline, self-defense and socialization.
- Ages 15-25: exercise, self-defense, self control, concentration.
- Ages 25-35: exercise, self-defense, stress reduction and weight control and participation with their children.
- Ages 35 +: exercise, stress reduction and socialization.
4.2.2 Market Trends
In the mid-1960s there was a boom in martial arts studios, partially brought on by the success of Bruce Lee movies and the TV show ‘Kung Fu’. In the mid-1980s, interest in martial arts moved towards offering children’s programs. In the mid-1990s it was estimated that 5 to 10 million Americans were active in some form of martial arts training.
Recent trends such as the popularity of the movie “Crouching Tiger, Hidden Dragon” not so suprisingly caused a mini-surge in the number of new applicants. In addition, martial arts for kids has shown a trend towards more activities and less “traditional” training. It has been noted that today’s kids have a lower level of patience, want to be involved in “movie” type karate styles (i.e., “Matrix”, “Shanghai Noon”, “Karate Kid” and “Power Rangers”) and are more demanding of their time.
Another trend is that larger health/fitness organizations are moving into the martial arts field and a general consolidation is occuring. Companies such as Bally Total Fitness and Gold’s Gym are offering kick-boxing, teabo and other forms of group “soft” martial arts training such as yoga.
Finally, there is a push in the health/fitness industry to attract the ‘over 50’ crowd. Fitness clubs have a difficult time applying their muscle building, fast-paced fitness programs into this market. However, the ‘over 50’ group is expected to be marketed to more aggressively, as fitness/health clubs realize the potential of the “baby boomers” and the fact that baby boomers have both the time and money to pursue outside recreational activities.
4.2.3 Market Growth
The U.S. Census (2000) shows that our region is experiencing tremendous growth. More families are moving into the our community area than ever before. Our region is experiencing a boom in adults ages 30 to 50 with young children, who can afford the ever increasing cost of homes in the area.
A national survey taken indicated there are approximately six million Americans actively involved in martial arts training. The survey indicated that a 14% growth rate was expected in the upcoming years as Americans move towards a more healthy lifestyle.
As our area was once known for elderly retirement communities, the trend is turning towards the younger families and children moving into the area. This could be a result of the cost of living, causing many seniors on retirement income to move to more affordable locations.
4.3 Service Business Analysis
The business of owning and operating the Cents and Senseibility Martial Arts School is similar to that of running a health/fitness club—membership is everything. The ‘do-jahng’ (Taekwondo facility) is the teacher and place of learning, and can be looked at as a place of experience, an elder. The word ‘do’ (way) ‘jahng’ (area) means “the area in which we learn the way.” Respect is given to the place where this training takes place. This respect is not to the do-jahng as an object, but to remind students to keep their minds right, attitudes proper, and take care of the facility in which they train.
Martial arts falls under the SIC (Standard Industrial Code) 7999 – Amusement and Recreational Services. Under this heading we find groupings from Astrologers to Card Rooms, from Carnival Operations to Yoga. In other words the code is too broad to provide solid analysis benefit, but it will be addressed in our comparative ratios analysis at the end of this plan.
The martial arts industry consists primarily of thousands of small independent schools, most belong to one of hundreds of loosely organized martial arts associations (usually divided by style type). The Cents and Senseibility Martial Arts School is proud to be affiliated with one of, if not the largest, martial arts organizations in the United States today, with over 1,500 Taekwondo Centers and 300,000 active students and growing.
Other industries should be considered in any competitive analysis. The health and fitness club industry (Bally Total Fitness, Gold’s Gym) and the non-profit (YMCA, YWCA and local schools) are in competition for the same group of potential customers.
4.3.1 Competition and Buying Patterns
The nature of the business of a Taekwondo Center is to offer a facility with martial arts training. Membership is everything and turnover (attrition) in the industry can be high. Several reports place the average turnover of a do-jahng at 40 to 60%. Selection of a do-jahng by a potential member is, in-part, done by the style of martial art (taekwondo, karate, judo, kung-fu or kick-boxing) the member wishes to participate.
However, selection of a do-jahng by a new student is more basic in nature. Based on past experience, generally a do-jahng selection is based on the following (most popular first):
- Friends/family attending
- Location
- Cost
- Facility environment
- Class schedule (times)
- Friendliness of instructors (personal attention)
- Class size
However, the marketing plan developed by the Can-Am Taekwondo Instructors and Schools Confederation and perfected by the owner of Cents and Senseibility Martial Arts School, Rolly BonTemps (5th Degree Black Belt), has generated more memberships for the school he has been affiliated with than all the advertisements and word-of-mouth put together. This marketing plan actively recruits and goes out after membership and does not wait for the membership to walk into the do-jahng. This marketing plan will be discussed within this Business Plan.
Potential members are most aware of a do-jahng’s physical existence because:
- The marketing activities (50%)
- Friends and family (25%);
- Drive/walk by storefront (15%);
- Yellow Page/media advertising (10%)
4.3.2 Competing Martial Arts School’s and Health Clubs
Two martial arts schools have been identified as being the most competitive with our location. All have a physical facility (dojo), both offer traditional martial arts training. Both offer competitive pricing and are open Monday thru Saturday (closed Sunday). In addition, each head instructor is well versed in his/her field. Both facilities are located approximately 7-10 miles from locations being sought after for the Cents and Senseibility Martial Arts School.
At this time there are no major health clubs in the immediate vicinity of our proposed location.
Strategy and Implementation Summary
In this somewhat competitive field, Cents and Senseibility Martial Arts School will focus on a broad market. Special focus will be placed on recruiting students from the four Elementary Schools, two Middle Schools, and two High Schools in the immediate area.
Special emphasis will be placed on these age groups:
- Age 3-5, the Tiny Tots Taekwondo Program is expected to make up 10% of the membership.
- Age 6 -12, is projected to make up 60% of the membership. This group tends to establish the largest student base in most CATISC Taekwondo schools across the nation.
- Age 13-18, is projected to make up 10% of the membership.
- Age 19-30, is projected to make up 10% of the membership.
- Age 30 and older, is projected to make up 10% of the membership.
5.1 Competitive Strengths and Weaknesses
Strengths:
- Can-Am Taekwondo Instructors and Schools Confederation has been established for over 30 years and is one of the largest martial arts organizations, if not the largest, in the United States.
- Cents and Senseibility Martial Arts School location will be located in a major shopping center with easy access and ample lighted parking.
- Mr. Rolly BonTemps (5th degree black belt) is very knowledgeable and is nationally recognized as one of the CATISC’s leading instructors.
- Mr. BonTemps is an experienced Instructor with over 10 years as a certified Instructor with CATISC. He has a strong desire and patience to teach the youth of today.
- Mr. BonTemps has been recognized by leading instructors in CATISC as one of the organization’s leading marketing specialists in recruitment.
- Mr. BonTemps has been recognized by the teachers in Metroburb, for his participation in “Show and Tell” activities at the Elementary Schools and is continuously being sought after to return to the classrooms for further presentations. This results in the largest recruitment of students and has proven to be a highly effective marketing plan.
- Competitive pricing and hours of operation.
- Solid untapped database from which to market.
- Lead Instructor for over 300 active students.
Weaknesses:
- New School.
- Lack of Instructors during start up.
- Student attrition.
- No website at this time but it is planned for the future.
5.2 Marketing Strategy
In the Marketing Strategy the target is very broad, kids 3 to 14, young adults 15 to 25, and adults 26 to 49. To address this market one must understand that Cents and Senseibility Martial Arts School will be a “showplace” and in marketing efforts we want potential members to judge our “book by its cover.”
The first strategy will be to open a fully decorated and functional Taekwondo School (Cents and Senseibility Martial Arts School). This school will be a fun and exciting place where members will want to train. The school will be neat, clean and offer a variety of functions and state of the art training facility.
Show and Tell
The first marketing initiative is to meet with the local School Administrators and introduce ourself to the community. The “Show and Tell” plan is introduced and when accepted lends the approach to meet the children in the classroom. The “Show and Tell” is organized in different segments. The first time the instructor addresses the children he/she will be in full Martial Art Uniform. Most children are thoroughly impressed and fascinated as they enter the room. Upon asking them if they would like to have a uniform and take Taekwondo, it immediately attracts their attention. This is where the instructor immediately reaches out and begins to teach the students the meaning of discipline. Discipline meaning how we act in the presence of adults and teachers and what is expected of students in the Taekwondo School. The students are rewarded for their behavior during the “Show and Tell” by letting them break styrofoam (simulated wood boards) as they do in the Taekwondo School. By the time the instructors leave the class room, the children are so fascinated by the instructor and his/her teaching application, all students are sitting straight up in their seats and answering the teacher and instructor with phrases like “Yes Sir, Yes Ma’am”.
Because of the success of the first visit, the teachers are so astonished at the children’s behavior change in the classroom that the Instructor(s) are invited back for a second and third and often a forth time during the school year. Each time the instructor is invited back he/she concentrates on a different element of the martial arts such as self control, concentration, respect. Each “Show and Tell” reflects the topic the teacher would like demonstrated to the children. This has been such a success that the word spreads quickly and the Instructors visit every classroom and address entire schools putting on demonstrations during the recalls in the Auditorium.
During each of these visits at the end of the session, each child is given a card for a free 30 days of instruction. On average 10 children will attend the free lessons. Getting the parents and child into the Taekwondo School will usually sell itself. However, once they enter the School, the instructor interviews the parents to see just what they would like their child to receive out of the Taekwondo Class. Depending on the parents’ answer—discipline, self-control, respect, etc.—the instructor gears his focus for that student to the parents’ wish. The child is then taken onto the do-jahng with the instructor for a one-hour introduction in Taekwondo. The instructor is gearing his one-hour orientation toward what the parent has requested (e.g., discipline, self-control, respect, etc.). Once the instructor returns with the child, the parent sees the immediate change in their child’s behavior after only a one-hour session. At this time, six to eight of the 10 students that enter that day enroll under contract to begin their Taekwondo lessons.
V.I.P. Program
The second marketing initiative is a V.I.P. program. Here we take to the parking lots of the local shopping and strip malls dressed in full uniform. We actively hand out flyers and business cards to all parents we see with children, or any interested adult that approaches. Again we offer 30 days of free lessons, to get the people in the door of the school. Once they enter the do-jahng, the same process as above is used. Through experience in exercising these methods, six to eight out of the 10 people that enter will sign a contract for lessons.
As the students begin to enroll, Cents and Senseibility Martial Arts School plans to participate in “Martial Arts” demonstrations at the local malls, Wal-Mart and grocery store location parking lots, public parks, etc., with the students participating in the demonstration.
Yellow Pages
The third marketing initiative is to advertise in the “Yellow Pages”, local newspaper, radio, websites and, as we become more profitable, on local television.
5.2.1 Positioning Statement
For adults in the city who want to learn and/or have their children learn the art of Taekwondo and to build self-confidence, we offer competitive pricing, convenient hours, and quality instruction, under the leadership of a 5th degree black belt, nationally recognized instructor.
Unlike the competition, Cents and Senseibility Martial Arts School plans to offer the most modern of facilities, in a convenient location with ample parking, and programs that are entertaining, adventuresome, with the tradition of Korean style Taekwondo.
5.2.2 Pricing Strategy
We must offer our services at a pricing structure that will both meet our financial needs and the needs of our members. Our value-priced fee structure of $80 per month membership for the Tiny Tots Taekwondo (3T) Program, $85 per month for the Basic Program and $90 per month for the Black Belt Club is competitive for schools that own their own facility. We will keep this fee but offer promotional discounts to members for bringing in new students.
There are as many introductory promotional pricing packages as there are do-jahngs. All the programs are designed to draw or introduce the potential member to the do-jahng without requiring them to sign a long-term contract. All offer the same basic package which includes anywhere from 1-6 months training, 1-3 private classes with gi (uniform), and prices varying from $50 to $99.
Our value-pricing strategy is to offer a very short introductory package of two personal training sessions and a gi for $29. If the potential member wants to continue, we will offer a six month introductory package at $299. After six months, if the potential member wants to continue we will offer the annual contract at $1,000 (with discounts for payment up front). Monthly or quarterly billing options will be offered.
In addition, we will be working to identify other pricing structures which address families and lower income students.
5.2.3 Promotion Strategy
Based on buying pattern research, we determined marketing in local schools and public places is the most successful marketing strategy, followed by “word-of-mouth” for promoting our do-jahng, followed by the “storefront” and finally advertising.” With this in mind we have established the following promotional strategies:
- Our members (students) must like who we are and what we do, in order for us to succeed.
- To assist in promotion, we will offer an incentive to members who bring in new members. We want potential members to judge our “book by its cover.”
- Our storefront (external and internal) will be redesigned to sell itself. People will want to go in just to see what a do-jahng looks like.
- We will be holding an annual Taekwondo Tournament as we grow in numbers. This will be held in the local community at a location that will handle several thousand participants, such as a school gym or civic center, etc.
- Cents and Senseibility will be holding Taekwondo demonstrations locally at the mall, shopping centers and at events around the city.
- Cents and Senseibility Martial Arts School will continue to offer free self-defense seminars to local grade schools and retirement communities.
- Cents and Senseibility will offer self-defense and weapon techniques to local law enforcement agencies.
- We will offer self-defense training for women.
- The Cents and Senseibility Martial Arts School Web page will be designed to reflect our image and be very informative.
- Cents and Senseibility will advertise in “The Yellow Pages”, the #1 source of new recruitment in media. We will purchase “competitive” ad space.
- We also will advertise in the local “entertainment and news” paper, which will also provide good advertisement opportunities.
5.2.4 Marketing Programs
In our Marketing Strategy the primary market will be kids 3 to 14 and young adults from 15 to 25 and adults 30 to 49. The senior adults (50+) market will be addressed separately.
- To address the largest market one must understand that the do-jahng is a “showplace” and in the marketing efforts we want potential customers to judge our “book by its cover.”
- Another key marketing program is to introduce simple methods of training to the instructors to reinforce students, i.e., “want to train, not have to train” concepts. This program is intended to reduce high level of membership attrition.
- The final program is to advertise in the Yellow Pages and weekly newspaper. Both programs will be tracked, but the weekly newspaper appears to offer more clearly defined (short-term) success to specific advertising promotions and plans can be adjusted accordingly.
- Cents and Senseibility Martial Arts School will create a very professional brochure on what the facility has to offer. Mr. BonTemps will head up this program.
5.2.5 Strategic Alliances
There are a number of establishments surrounding the do-jahng. We will contact select establishments for an agreed brochure trade, with emphasis on a positive, well-designed showcase that will benefit both parties with possible discounts being made available.
5.3 Sales Strategy
The overall strategy is to increase membership to 300 by year-end 2004, which is 80% of the do-jahng capacity and an aggressive two year growth. Through effective marketing efforts Cents and Senseibility Martial Arts School will make potential customers aware of the do-jahng. From this awareness Cents and Senseibility will increase the number of potential members that walk in the front door.
These new potential members will be met by either the Instructor or a well-trained sales associate/receptionist who will have all sales materials, promotions and a computer for data entry. The sales associate will be empowered to offer select promotions, however, if the potential member is interested in joining, an instructor will be made available for immediate consultation.
5.3.1 Sales Forecast
The following chart and table reflects the aggressive, but obtainable sales forecast. Membership is projected to grow at a steady pace. Introductory membership fees will be adjusted accordingly after the three month grand opening.
Special classes will be conducted upon demand. Weekend activities such as birthday parties and special events will also be conducted for a minimal price.
Private lessons will also be made available by Rolly BonTemps, 5th Degree Black Belt, upon the students request for lessons.
Belt testing will be conducted every 8 weeks and fees will be according to rank and group membership.
Self-defense seminars for women will be held periodically throughout the year, teaching females the basic self-defense techniques in case of emergencies.
Special Law Enforcement self-defense seminars will be held periodically throughout the year, teaching Law Enforcement Officers basic and advanced self-defense techniques.


| Sales Forecast | |||
| Year 1 | Year 2 | Year 3 | |
| Sales | |||
| 3T Membership | $38,000 | $54,000 | $63,000 |
| Basic Club Membership | $49,300 | $118,830 | $93,500 |
| Black Belt Club Membership | $30,960 | $61,920 | $92,880 |
| Masters Club Membership | $28,900 | $57,800 | $86,700 |
| Testing | $50,900 | $68,715 | $92,765 |
| Private Lessons | $1,950 | $2,048 | $2,150 |
| Weekend Specials | $2,375 | $2,494 | $2,618 |
| Merchandise | $14,700 | $17,640 | $21,168 |
| Pilates Membership | $21,000 | $23,100 | $25,410 |
| Cardio Kick Boxing Membership | $21,000 | $23,100 | $25,410 |
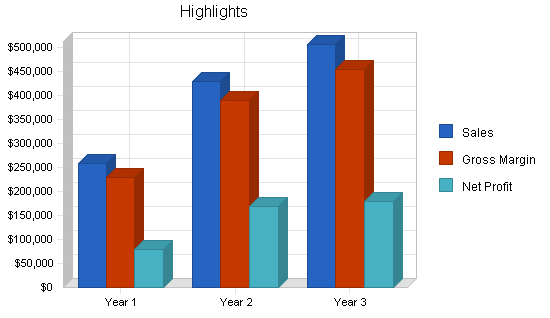
| Total Sales | $259,085 | $429,646 | $505,602 |
| Direct Cost of Sales | Year 1 | Year 2 | Year 3 |
| Merchandise | $7,350 | $8,820 | $10,584 |
| Testing – CATISC fees | $7,635 | $10,307 | $13,915 |
| Testing (inventory, etc.) | $15,270 | $20,615 | $27,830 |
| Subtotal Direct Cost of Sales | $30,255 | $39,742 | $52,328 |
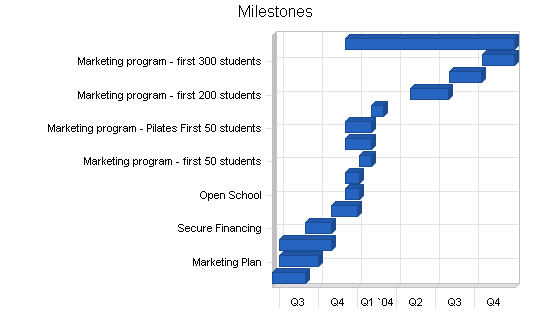
5.4 Milestones
The following table lists important program milestones, with dates and managers in charge, and budgets for each. The milestone schedule indicates the emphasis on planning for implementation. The most important programs are the sales and marketing programs listed in detail in the previous topics.
| Milestones | |||||
| Milestone | Start Date | End Date | Budget | Manager | Department |
| Business Plan | 6/15/2003 | 8/30/2003 | $150 | Fiorello & Rolly | Marketing |
| Marketing Plan | 6/30/2003 | 9/30/2003 | $250 | Rolly | Marketing |
| Find School Location | 7/1/2003 | 10/30/2003 | $0 | Fiorello & Rolly | Marketing |
| Secure Financing | 8/30/2003 | 10/30/2003 | $0 | Fiorello & Rolly | Marketing |
| Store Front Sign | 10/30/2003 | 12/30/2003 | $10,000 | Fiorello & Rolly | Marketing |
| Open School | 12/1/2003 | 1/3/2004 | $25,000 | Rolly | Marketing |
| Marketing program – first 25 students | 12/1/2003 | 1/3/2004 | $2,000 | Rolly | Marketing |
| Marketing program – first 50 students | 1/4/2004 | 1/31/2004 | $1,000 | Rolly | Web |
| Marketing program – Cardio Kick Boxing 50 students | 12/1/2003 | 1/31/2004 | $500 | Rolly | Marketing |
| Marketing program – Pilates First 50 students | 12/1/2003 | 1/31/2004 | $500 | Meg | Marketing |
| Marketing program – first 100 students | 2/2/2004 | 2/29/2004 | $1,000 | Rolly | Web |
| Marketing program – first 200 students | 5/2/2004 | 7/31/2004 | $2,000 | Rolly | Marketing |
| Marketing program – first 250 students | 8/2/2004 | 10/16/2004 | $1,500 | Rolly | Marketing |
| Marketing program – first 300 students | 10/18/2004 | 1/1/2005 | $1,500 | Rolly | Marketing |
| Marketing program – VIP Schools | 12/1/2003 | 12/31/2004 | $100/month | Rolly | Marketing |
| Totals | $45,400 | ||||
Management Summary
Rolly BonTemps is the owner of Cents and Senseibility Martial Arts School. Mr. BonTemps (5th degree black belt) is an experienced Taekwondo instructor with over 10 years as a certified Instructor with the Can-Am Taekwondo Instructors and Schools Confederation. He has also recognized by leading instructors in the Can-Am Taekwondo Instructors and Schools Confederation as one of the organization’s leading Marketing Specialists in recruitment.
Upon opening the School he will contract an accountant. At this time there are no other employees. The Taekwondo School will be a self-running establishment. The owner will oversee operations and provide all of the instruction at this time.
6.1 Personnel Plan
The do-jahng itself is a small business. However, the company is putting together a quality management team (Board of Advisors) to assist in business matters. Gaps in legal, tax, marketing and personnel will be covered by the Board of Advisors. Our strength will be in the technical and management fields. Computer graphic designing and software programs is expected to assist with the advertising and marketing for Cents and Senseibility Martial Arts School. While currently the Black Belt Academy has no employees, as soon as the school opens the owner’s father and mother will be assisting part-time as sales associate/receptionist to handle the expected increase in new membership and serve on the Board of Advisors for business issues. The Board of Advisors will consist of a three member team, each with experience in general business (insurance), accounting, small business, legal issues and human resources.
Cents and Senseibility Martial Arts School will have the below listed employees:
- Rolly BonTemps, Owner and Instructor. Rolly BonTemps has been actively involved in the Can-Am Taekwondo Instructors and Schools Confederation since he was 9 years old. Rolly achieved Black Belt status in June 1990. Since then he has progressed through the ranks achieving his Instructor Certification and in June 2003 received his 5th Degree Black Belt. Rolly has worked at the Taekwondo School in Metroburb as the Lead Instructor for the past five years. Mr. Pivayoke, 7th Degree Black Belt has been Rolly’s Instructor over this period. Mr. Pivayoke has entrusted Rolly with the full running and the operation of the Taekwondo School. Over this period, Rolly has learned all aspects needed to fully run his own establishment. He has mastered a marketing plan that has made the Metroburb School one of the top three single owned CATISC Taekwondo Schools in the United States. The membership at this location is actively operating at 450 to 500 students.
- Meg LeFevre, is the fiancee of Rolly BonTemps. Meg actively participates in several health club fitness programs. Meg is working on receiving her certification as a Pilates Instructor. Once this certification is achieved, the Cents and Senseibility Martial Arts School will also expand into the fitness program for young and and older adults.
- Fiorello BonTemps, father of the owner will serve as consultant, financial advisor, and manage the maintenance and any construction needs for the building. Mr. BonTemps will enter into this business retired from the United States Department of Justice, where he served for 23 years. Mr. BonTemps retired as Facility Administrator for our region of the United States. His knowledge in business management, construction industry, business finances, legal issues, human resources and computer programs, will assist Rolly BonTemps, owner and operator with business decisions and expansions. Mr. BonTemps will serve as a Board of Advisors Member for the Cents and Senseibility Martial Arts School.
- Merry BonTemps, mother of the owner will serve as consultant and financial advisor and manage the bookkeeping and financial affairs for the business. Mrs. BonTemps has worked in the medical field for 25 years and has managed office finances and has worked for ten years in human resources. Mrs. BonTemps will serve as a Board of Advisors Member for the Cents and Senseibility Martial Arts School.
The owner will actively seek advice from SCORE “Counselors to America’s Small Business”, a national non-profit organization with an office in our community. This is a group of retired executives and business owners who donate their time to serve as counselors and advisors to aspiring entrepreneurs and business owners.
These experienced counselors provide FREE small business counseling for business owners in the region from their office in downtown.
In calendar year 2002, our SCORE Chapter handled 824 new cases, 341 follow-up cases (of which 335 were new e-mail cases and 181 were follow-on e-mail cases). Also, SCORE counselors put in a total of 1,748 volunteer hours. Currently, there are five counselors approved by National SCORE to handle U.S.-wide e-mail cases.
| Personnel Plan | |||
| Year 1 | Year 2 | Year 3 | |
| Rolly BonTemps (Owner) | $33,000 | $45,000 | $65,000 |
| Meg LeFevre (Instructor) | $7,000 | $10,000 | $15,000 |
| Fiorello BonTemps (Board of Directors) | $6,000 | $8,000 | $10,000 |
| Merry BonTemps (Board of Directors) | $6,000 | $8,000 | $10,000 |
| Total People | 4 | 4 | 4 |
| Total Payroll | $52,000 | $71,000 | $100,000 |
Financial Plan
The initial investment in the Cents and Senseibility Martial Arts School will be provided by Rolly BonTemps and his parents. The owner will also seek a 3-year bank loan to provide the remainder of the required initial funding.
Our financial plan is built on the assumption that Cents and Senseibility will be able to recruit the required amount of students on a rolling basis. The owner strongly believes that his previous successful experience as one of the industry’s most distinguished marketing specialists will allow him to become successful with the enrollment for his own Taekwondo school.
The break-even point of + or – 70 students should be achieved in just three months. The goal of 300 students in 12-18 months is very obtainable. When this goal is met, Cents and Senseibility Martial Arts School will be a very profitable business. The long-term goal is to have enough cash on-hand and a solid credit history to pursue the ultimate goal of owning our own building. This facility will include the Cents and Senseibility Martial Arts School and a fitness center for young and older adults to participate in several fitness programs, as well as a universal gym.
7.1 Important Assumptions
It was necessary to make certain broad-based assumptions in planning for the future. The financial assumptions are listed below in the table. In addition, several other important assumptions have been made:
- The economy will grow at a steady pace, without a major recession. Our network of local communities is among the fastest growing areas in the country. The Cents and Senseibility Martial Arts School is expected to grow with the growth of the local communities.
- There will be no major change in the martial arts industry, other then those discussed in the trends section earlier in this document.
- The State will not enact “impact” legislation on the unregulated martial arts industry.
| General Assumptions | |||
| Year 1 | Year 2 | Year 3 | |
| Plan Month | 1 | 2 | 3 |
| Current Interest Rate | 7.00% | 7.00% | 7.00% |
| Long-term Interest Rate | 9.00% | 9.00% | 9.00% |
| Tax Rate | 30.00% | 30.00% | 30.00% |
| Other | 0 | 0 | 0 |
7.2 Break-even Analysis
For the break-even analysis, the assumed running costs will include full payroll, rent, and utilities, and an estimation of other running costs. Based on our assumed variable cost, we show below our estimated break-even sales volume per month. We expect to reach that sales volume by our fourth month of operations.

| Break-even Analysis | |
| Monthly Revenue Break-even | $10,605 |
| Assumptions: | |
| Average Percent Variable Cost | 12% |
| Estimated Monthly Fixed Cost | $9,367 |
7.3 Projected Profit and Loss
Cents and Senseibility’s monthly profit for the first year varies considerably, as we aggressively seek improvements and begin marketing the business. However, after the first six months, profitability should take hold, which will allow a modest increase to the owner’s salary.


| Pro Forma Profit and Loss | |||
| Year 1 | Year 2 | Year 3 | |
| Sales | $259,085 | $429,646 | $505,602 |
| Direct Cost of Sales | $30,255 | $39,742 | $52,328 |
| Other costs | $0 | $0 | $0 |
| Total Cost of Sales | $30,255 | $39,742 | $52,328 |
| Gross Margin | $228,830 | $389,905 | $453,273 |
| Gross Margin % | 88.32% | 90.75% | 89.65% |
| Expenses | |||
| Payroll | $52,000 | $71,000 | $100,000 |
| Sales and Marketing and Other Expenses | $15,000 | $25,000 | $40,000 |
| Depreciation | $1,000 | $1,000 | $1,000 |
| Rent | $30,000 | $30,000 | $30,000 |
| Utilities | $4,200 | $4,500 | $4,600 |
| Janitorial services | $3,000 | $3,500 | $4,000 |
| Insurance | $1,200 | $1,200 | $1,200 |
| Payroll Taxes | $0 | $0 | $0 |
| Miscellaneous | $6,000 | $10,000 | $15,000 |
| Total Operating Expenses | $112,400 | $146,200 | $195,800 |
| Profit Before Interest and Taxes | $116,430 | $243,705 | $257,473 |
| EBITDA | $117,430 | $244,705 | $258,473 |
| Interest Expense | $4,523 | $2,861 | $982 |
| Taxes Incurred | $33,572 | $72,253 | $76,947 |
| Net Profit | $78,335 | $168,590 | $179,544 |
| Net Profit/Sales | 30.24% | 39.24% | 35.51% |
7.4 Projected Cash Flow
Like profit, the first year’s monthly cash flows will vary. Since we will mostly deal with private customers, we expect that most of our sales will be done in cash or by credit card, which will positively affect our planned cash flow, especially during the most crucial first year of operations. A 3-year commercial loan sought by the owner will be required to cover working capital requirement.
Our projected cash flow, as summarized in the table below, is expected to meet the needs. In the following years, excess cash will be used to finance more aggressive service plans.

| Pro Forma Cash Flow | |||
| Year 1 | Year 2 | Year 3 | |
| Cash Received | |||
| Cash from Operations | |||
| Cash Sales | $207,268 | $343,717 | $404,481 |
| Cash from Receivables | $37,428 | $76,457 | $96,902 |
| Subtotal Cash from Operations | $244,697 | $420,174 | $501,383 |
| Additional Cash Received | |||
| Sales Tax, VAT, HST/GST Received | $0 | $0 | $0 |
| New Current Borrowing | $0 | $0 | $0 |
| New Other Liabilities (interest-free) | $0 | $0 | $0 |
| New Long-term Liabilities | $0 | $0 | $0 |
| Sales of Other Current Assets | $0 | $0 | $0 |
| Sales of Long-term Assets | $0 | $0 | $0 |
| New Investment Received | $0 | $0 | $0 |
| Subtotal Cash Received | $244,697 | $420,174 | $501,383 |
| Expenditures | Year 1 | Year 2 | Year 3 |
| Expenditures from Operations | |||
| Cash Spending | $52,000 | $71,000 | $100,000 |
| Bill Payments | $115,234 | $193,364 | $226,001 |
| Subtotal Spent on Operations | $167,234 | $264,364 | $326,001 |
| Additional Cash Spent | |||
| Sales Tax, VAT, HST/GST Paid Out | $0 | $0 | $0 |
| Principal Repayment of Current Borrowing | $0 | $0 | $0 |
| Other Liabilities Principal Repayment | $0 | $0 | $0 |
| Long-term Liabilities Principal Repayment | $18,236 | $19,947 | $21,817 |
| Purchase Other Current Assets | $0 | $0 | $0 |
| Purchase Long-term Assets | $0 | $0 | $0 |
| Dividends | $0 | $0 | $0 |
| Subtotal Cash Spent | $185,470 | $284,311 | $347,818 |
| Net Cash Flow | $59,227 | $135,863 | $153,565 |
| Cash Balance | $103,227 | $239,090 | $392,655 |
7.5 Projected Balance Sheet
The balance sheet is quite solid. Cents and Senseibility Martial Arts School does not project any real trouble meeting its debt obligations—as long as it can achieve the specific objectives. We are very confident we will meet all objectives in the Business Plan, if not exceed them.
| Pro Forma Balance Sheet | |||
| Year 1 | Year 2 | Year 3 | |
| Assets | |||
| Current Assets | |||
| Cash | $103,227 | $239,090 | $392,655 |
| Accounts Receivable | $14,388 | $23,861 | $28,079 |
| Inventory | $9,575 | $12,577 | $16,561 |
| Other Current Assets | $0 | $0 | $0 |
| Total Current Assets | $127,190 | $275,528 | $437,295 |
| Long-term Assets | |||
| Long-term Assets | $10,000 | $10,000 | $10,000 |
| Accumulated Depreciation | $1,000 | $2,000 | $3,000 |
| Total Long-term Assets | $9,000 | $8,000 | $7,000 |
| Total Assets | $136,190 | $283,528 | $444,295 |
| Liabilities and Capital | Year 1 | Year 2 | Year 3 |
| Current Liabilities | |||
| Accounts Payable | $17,091 | $15,786 | $18,825 |
| Current Borrowing | $0 | $0 | $0 |
| Other Current Liabilities | $0 | $0 | $0 |
| Subtotal Current Liabilities | $17,091 | $15,786 | $18,825 |
| Long-term Liabilities | $41,764 | $21,817 | $0 |
| Total Liabilities | $58,855 | $37,603 | $18,825 |
| Paid-in Capital | $35,000 | $35,000 | $35,000 |
| Retained Earnings | ($36,000) | $42,335 | $210,925 |
| Earnings | $78,335 | $168,590 | $179,544 |
| Total Capital | $77,335 | $245,925 | $425,469 |
| Total Liabilities and Capital | $136,190 | $283,528 | $444,295 |
| Net Worth | $77,335 | $245,925 | $425,469 |
7.6 Business Ratios
As indicated in the “Service Business Analysis” the martial arts industry is not properly reflected in the SIC Code provided (7999). However, with this said, we have made some preliminary business ratio comparisons using the SIC (2000 figures). The results are very favorable.
We have much lower long-term assets than the industry standard because we are beginning our business with a rented space, rather than buying one. If Cents and Senseibility sees sufficient growth over the first three yeears, we may buy a suitable location for permanent space.
| Ratio Analysis | ||||
| Year 1 | Year 2 | Year 3 | Industry Profile | |
| Sales Growth | 0.00% | 65.83% | 17.68% | 2.76% |
| Percent of Total Assets | ||||
| Accounts Receivable | 10.57% | 8.42% | 6.32% | 4.27% |
| Inventory | 7.03% | 4.44% | 3.73% | 4.31% |
| Other Current Assets | 0.00% | 0.00% | 0.00% | 31.38% |
| Total Current Assets | 93.39% | 97.18% | 98.42% | 39.96% |
| Long-term Assets | 6.61% | 2.82% | 1.58% | 60.04% |
| Total Assets | 100.00% | 100.00% | 100.00% | 100.00% |
| Current Liabilities | 12.55% | 5.57% | 4.24% | 23.98% |
| Long-term Liabilities | 30.67% | 7.69% | 0.00% | 24.53% |
| Total Liabilities | 43.22% | 13.26% | 4.24% | 48.51% |
| Net Worth | 56.78% | 86.74% | 95.76% | 51.49% |
| Percent of Sales | ||||
| Sales | 100.00% | 100.00% | 100.00% | 100.00% |
| Gross Margin | 88.32% | 90.75% | 89.65% | 100.00% |
| Selling, General & Administrative Expenses | 30.44% | 23.59% | 23.82% | 75.54% |
| Advertising Expenses | 0.39% | 0.23% | 0.20% | 3.11% |
| Profit Before Interest and Taxes | 44.94% | 56.72% | 50.92% | 1.52% |
| Main Ratios | ||||
| Current | 7.44 | 17.45 | 23.23 | 1.04 |
| Quick | 6.88 | 16.66 | 22.35 | 0.68 |
| Total Debt to Total Assets | 43.22% | 13.26% | 4.24% | 64.79% |
| Pre-tax Return on Net Worth | 144.70% | 97.93% | 60.28% | 2.30% |
| Pre-tax Return on Assets | 82.17% | 84.95% | 57.73% | 6.54% |
| Additional Ratios | Year 1 | Year 2 | Year 3 | |
| Net Profit Margin | 30.24% | 39.24% | 35.51% | n.a |
| Return on Equity | 101.29% | 68.55% | 42.20% | n.a |
| Activity Ratios | ||||
| Accounts Receivable Turnover | 3.60 | 3.60 | 3.60 | n.a |
| Collection Days | 56 | 81 | 94 | n.a |
| Inventory Turnover | 5.12 | 3.59 | 3.59 | n.a |
| Accounts Payable Turnover | 7.74 | 12.17 | 12.17 | n.a |
| Payment Days | 27 | 31 | 28 | n.a |
| Total Asset Turnover | 1.90 | 1.52 | 1.14 | n.a |
| Debt Ratios | ||||
| Debt to Net Worth | 0.76 | 0.15 | 0.04 | n.a |
| Current Liab. to Liab. | 0.29 | 0.42 | 1.00 | n.a |
| Liquidity Ratios | ||||
| Net Working Capital | $110,099 | $259,742 | $418,469 | n.a |
| Interest Coverage | 25.74 | 85.18 | 262.25 | n.a |
| Additional Ratios | ||||
| Assets to Sales | 0.53 | 0.66 | 0.88 | n.a |
| Current Debt/Total Assets | 13% | 6% | 4% | n.a |
| Acid Test | 6.04 | 15.15 | 20.86 | n.a |
| Sales/Net Worth | 3.35 | 1.75 | 1.19 | n.a |
| Dividend Payout | 0.00 | 0.00 | 0.00 | n.a |
Appendix
| Sales Forecast | |||||||||||||
| Month 1 | Month 2 | Month 3 | Month 4 | Month 5 | Month 6 | Month 7 | Month 8 | Month 9 | Month 10 | Month 11 | Month 12 | ||
| Sales | |||||||||||||
| 3T Membership | 8000% | $400 | $1,200 | $2,000 | $2,800 | $3,600 | $4,000 | $4,000 | $4,000 | $4,000 | $4,000 | $4,000 | $4,000 |
| Basic Club Membership | 8500% | $425 | $1,275 | $2,125 | $2,975 | $3,825 | $4,250 | $4,675 | $5,100 | $5,525 | $5,950 | $6,375 | $6,800 |
| Black Belt Club Membership | 9000% | $450 | $630 | $900 | $1,350 | $1,530 | $1,800 | $2,250 | $3,150 | $4,050 | $4,950 | $4,950 | $4,950 |
| Masters Club Membership | 10000% | $0 | $500 | $700 | $1,000 | $1,200 | $1,500 | $2,000 | $2,500 | $3,500 | $4,500 | $5,500 | $6,000 |
| Testing | 0% | $0 | $0 | $1,150 | $2,300 | $3,200 | $4,500 | $5,050 | $5,600 | $6,150 | $6,700 | $7,500 | $8,750 |
| Private Lessons | 0% | $0 | $0 | $150 | $200 | $200 | $200 | $200 | $200 | $200 | $200 | $200 | $200 |
| Weekend Specials | 0% | $0 | $150 | $150 | $200 | $200 | $225 | $225 | $225 | $250 | $250 | $250 | $250 |
| Merchandise | 0% | $0 | $800 | $1,000 | $1,250 | $1,250 | $1,250 | $1,250 | $1,500 | $1,500 | $1,500 | $1,700 | $1,700 |
| Pilates Membership | 0% | $0 | $0 | $750 | $1,250 | $1,750 | $2,250 | $2,500 | $2,500 | $2,500 | $2,500 | $2,500 | $2,500 |
| Cardio Kick Boxing Membership | 0% | $0 | $0 | $750 | $1,250 | $1,750 | $2,250 | $2,500 | $2,500 | $2,500 | $2,500 | $2,500 | $2,500 |
| Total Sales | $1,275 | $4,555 | $9,675 | $14,575 | $18,505 | $22,225 | $24,650 | $27,275 | $30,175 | $33,050 | $35,475 | $37,650 | |
| Direct Cost of Sales | Month 1 | Month 2 | Month 3 | Month 4 | Month 5 | Month 6 | Month 7 | Month 8 | Month 9 | Month 10 | Month 11 | Month 12 | |
| Merchandise | 50% | $0 | $400 | $500 | $625 | $625 | $625 | $625 | $750 | $750 | $750 | $850 | $850 |
| Testing – CATISC fees | 15% | $0 | $0 | $173 | $345 | $480 | $675 | $758 | $840 | $923 | $1,005 | $1,125 | $1,313 |
| Testing (inventory, etc.) | 30% | $0 | $0 | $345 | $690 | $960 | $1,350 | $1,515 | $1,680 | $1,845 | $2,010 | $2,250 | $2,625 |
| Subtotal Direct Cost of Sales | $0 | $400 | $1,018 | $1,660 | $2,065 | $2,650 | $2,898 | $3,270 | $3,518 | $3,765 | $4,225 | $4,788 | |
| Personnel Plan | |||||||||||||
| Month 1 | Month 2 | Month 3 | Month 4 | Month 5 | Month 6 | Month 7 | Month 8 | Month 9 | Month 10 | Month 11 | Month 12 | ||
| Rolly BonTemps (Owner) | 0% | $2,000 | $2,000 | $2,000 | $2,500 | $2,500 | $2,500 | $3,000 | $3,000 | $3,000 | $3,500 | $3,500 | $3,500 |
| Meg LeFevre (Instructor) | 0% | $500 | $500 | $500 | $500 | $500 | $500 | $500 | $500 | $750 | $750 | $750 | $750 |
| Fiorello BonTemps (Board of Directors) | 0% | $500 | $500 | $500 | $500 | $500 | $500 | $500 | $500 | $500 | $500 | $500 | $500 |
| Merry BonTemps (Board of Directors) | 0% | $500 | $500 | $500 | $500 | $500 | $500 | $500 | $500 | $500 | $500 | $500 | $500 |
| Total People | 4 | 4 | 4 | 4 | 4 | 4 | 4 | 4 | 4 | 4 | 4 | 4 | |
| Total Payroll | $3,500 | $3,500 | $3,500 | $4,000 | $4,000 | $4,000 | $4,500 | $4,500 | $4,750 | $5,250 | $5,250 | $5,250 | |
| General Assumptions | |||||||||||||
| Month 1 | Month 2 | Month 3 | Month 4 | Month 5 | Month 6 | Month 7 | Month 8 | Month 9 | Month 10 | Month 11 | Month 12 | ||
| Plan Month | 1 | 2 | 3 | 4 | 5 | 6 | 7 | 8 | 9 | 10 | 11 | 12 | |
| Current Interest Rate | 7.00% | 7.00% | 7.00% | 7.00% | 7.00% | 7.00% | 7.00% | 7.00% | 7.00% | 7.00% | 7.00% | 7.00% | |
| Long-term Interest Rate | 9.00% | 9.00% | 9.00% | 9.00% | 9.00% | 9.00% | 9.00% | 9.00% | 9.00% | 9.00% | 9.00% | 9.00% | |
| Tax Rate | 30.00% | 30.00% | 30.00% | 30.00% | 30.00% | 30.00% | 30.00% | 30.00% | 30.00% | 30.00% | 30.00% | 30.00% | |
| Other | 0 | 0 | 0 | 0 | 0 | 0 | 0 | 0 | 0 | 0 | 0 | 0 | |
| Pro Forma Profit and Loss | |||||||||||||
| Month 1 | Month 2 | Month 3 | Month 4 | Month 5 | Month 6 | Month 7 | Month 8 | Month 9 | Month 10 | Month 11 | Month 12 | ||
| Sales | $1,275 | $4,555 | $9,675 | $14,575 | $18,505 | $22,225 | $24,650 | $27,275 | $30,175 | $33,050 | $35,475 | $37,650 | |
| Direct Cost of Sales | $0 | $400 | $1,018 | $1,660 | $2,065 | $2,650 | $2,898 | $3,270 | $3,518 | $3,765 | $4,225 | $4,788 | |
| Other costs | 0% | $0 | $0 | $0 | $0 | $0 | $0 | $0 | $0 | $0 | $0 | $0 | $0 |
| Total Cost of Sales | $0 | $400 | $1,018 | $1,660 | $2,065 | $2,650 | $2,898 | $3,270 | $3,518 | $3,765 | $4,225 | $4,788 | |
| Gross Margin | $1,275 | $4,155 | $8,658 | $12,915 | $16,440 | $19,575 | $21,753 | $24,005 | $26,658 | $29,285 | $31,250 | $32,863 | |
| Gross Margin % | 100.00% | 91.22% | 89.48% | 88.61% | 88.84% | 88.08% | 88.25% | 88.01% | 88.34% | 88.61% | 88.09% | 87.28% | |
| Expenses | |||||||||||||
| Payroll | $3,500 | $3,500 | $3,500 | $4,000 | $4,000 | $4,000 | $4,500 | $4,500 | $4,750 | $5,250 | $5,250 | $5,250 | |
| Sales and Marketing and Other Expenses | $4,000 | $1,000 | $1,000 | $1,000 | $1,000 | $1,000 | $1,000 | $1,000 | $1,000 | $1,000 | $1,000 | $1,000 | |
| Depreciation | $83 | $83 | $83 | $83 | $83 | $83 | $83 | $83 | $83 | $83 | $83 | $83 | |
| Rent | $2,500 | $2,500 | $2,500 | $2,500 | $2,500 | $2,500 | $2,500 | $2,500 | $2,500 | $2,500 | $2,500 | $2,500 | |
| Utilities | $350 | $350 | $350 | $350 | $350 | $350 | $350 | $350 | $350 | $350 | $350 | $350 | |
| Janitorial services | $250 | $250 | $250 | $250 | $250 | $250 | $250 | $250 | $250 | $250 | $250 | $250 | |
| Insurance | $100 | $100 | $100 | $100 | $100 | $100 | $100 | $100 | $100 | $100 | $100 | $100 | |
| Payroll Taxes | 15% | $0 | $0 | $0 | $0 | $0 | $0 | $0 | $0 | $0 | $0 | $0 | $0 |
| Miscellaneous | $500 | $500 | $500 | $500 | $500 | $500 | $500 | $500 | $500 | $500 | $500 | $500 | |
| Total Operating Expenses | $11,283 | $8,283 | $8,283 | $8,783 | $8,783 | $8,783 | $9,283 | $9,283 | $9,533 | $10,033 | $10,033 | $10,033 | |
| Profit Before Interest and Taxes | ($10,008) | ($4,128) | $374 | $4,132 | $7,657 | $10,792 | $12,469 | $14,722 | $17,124 | $19,252 | $21,217 | $22,829 | |
| EBITDA | ($9,925) | ($4,045) | $458 | $4,215 | $7,740 | $10,875 | $12,553 | $14,805 | $17,208 | $19,335 | $21,300 | $22,913 | |
| Interest Expense | $439 | $428 | $417 | $406 | $394 | $383 | $372 | $360 | $349 | $337 | $325 | $313 | |
| Taxes Incurred | ($3,134) | ($1,367) | ($13) | $1,118 | $2,179 | $3,123 | $3,629 | $4,308 | $5,033 | $5,674 | $6,267 | $6,755 | |
| Net Profit | ($7,313) | ($3,189) | ($30) | $2,608 | $5,084 | $7,286 | $8,468 | $10,053 | $11,743 | $13,240 | $14,624 | $15,761 | |
| Net Profit/Sales | -573.58% | -70.02% | -0.31% | 17.89% | 27.47% | 32.78% | 34.35% | 36.86% | 38.92% | 40.06% | 41.22% | 41.86% | |
| Pro Forma Cash Flow | |||||||||||||
| Month 1 | Month 2 | Month 3 | Month 4 | Month 5 | Month 6 | Month 7 | Month 8 | Month 9 | Month 10 | Month 11 | Month 12 | ||
| Cash Received | |||||||||||||
| Cash from Operations | |||||||||||||
| Cash Sales | $1,020 | $3,644 | $7,740 | $11,660 | $14,804 | $17,780 | $19,720 | $21,820 | $24,140 | $26,440 | $28,380 | $30,120 | |
| Cash from Receivables | $0 | $9 | $277 | $945 | $1,968 | $2,941 | $3,726 | $4,461 | $4,948 | $5,474 | $6,054 | $6,626 | |
| Subtotal Cash from Operations | $1,020 | $3,653 | $8,017 | $12,605 | $16,772 | $20,721 | $23,446 | $26,281 | $29,088 | $31,914 | $34,434 | $36,746 | |
| Additional Cash Received | |||||||||||||
| Sales Tax, VAT, HST/GST Received | 0.00% | $0 | $0 | $0 | $0 | $0 | $0 | $0 | $0 | $0 | $0 | $0 | $0 |
| New Current Borrowing | $0 | $0 | $0 | $0 | $0 | $0 | $0 | $0 | $0 | $0 | $0 | $0 | |
| New Other Liabilities (interest-free) | $0 | $0 | $0 | $0 | $0 | $0 | $0 | $0 | $0 | $0 | $0 | $0 | |
| New Long-term Liabilities | $0 | $0 | $0 | $0 | $0 | $0 | $0 | $0 | $0 | $0 | $0 | $0 | |
| Sales of Other Current Assets | $0 | $0 | $0 | $0 | $0 | $0 | $0 | $0 | $0 | $0 | $0 | $0 | |
| Sales of Long-term Assets | $0 | $0 | $0 | $0 | $0 | $0 | $0 | $0 | $0 | $0 | $0 | $0 | |
| New Investment Received | $0 | $0 | $0 | $0 | $0 | $0 | $0 | $0 | $0 | $0 | $0 | $0 | |
| Subtotal Cash Received | $1,020 | $3,653 | $8,017 | $12,605 | $16,772 | $20,721 | $23,446 | $26,281 | $29,088 | $31,914 | $34,434 | $36,746 | |
| Expenditures | Month 1 | Month 2 | Month 3 | Month 4 | Month 5 | Month 6 | Month 7 | Month 8 | Month 9 | Month 10 | Month 11 | Month 12 | |
| Expenditures from Operations | |||||||||||||
| Cash Spending | $3,500 | $3,500 | $3,500 | $4,000 | $4,000 | $4,000 | $4,500 | $4,500 | $4,750 | $5,250 | $5,250 | $5,250 | |
| Bill Payments | $167 | $4,963 | $3,806 | $5,188 | $7,705 | $10,211 | $12,028 | $12,136 | $13,407 | $14,123 | $15,020 | $16,479 | |
| Subtotal Spent on Operations | $3,667 | $8,463 | $7,306 | $9,188 | $11,705 | $14,211 | $16,528 | $16,636 | $18,157 | $19,373 | $20,270 | $21,729 | |
| Additional Cash Spent | |||||||||||||
| Sales Tax, VAT, HST/GST Paid Out | $0 | $0 | $0 | $0 | $0 | $0 | $0 | $0 | $0 | $0 | $0 | $0 | |
| Principal Repayment of Current Borrowing | $0 | $0 | $0 | $0 | $0 | $0 | $0 | $0 | $0 | $0 | $0 | $0 | |
| Other Liabilities Principal Repayment | $0 | $0 | $0 | $0 | $0 | $0 | $0 | $0 | $0 | $0 | $0 | $0 | |
| Long-term Liabilities Principal Repayment | $1,458 | $1,469 | $1,480 | $1,491 | $1,502 | $1,513 | $1,525 | $1,536 | $1,548 | $1,559 | $1,571 | $1,583 | |
| Purchase Other Current Assets | $0 | $0 | $0 | $0 | $0 | $0 | $0 | $0 | $0 | $0 | $0 | $0 | |
| Purchase Long-term Assets | $0 | $0 | $0 | $0 | $0 | $0 | $0 | $0 | $0 | $0 | $0 | $0 | |
| Dividends | $0 | $0 | $0 | $0 | $0 | $0 | $0 | $0 | $0 | $0 | $0 | $0 | |
| Subtotal Cash Spent | $5,125 | $9,932 | $8,786 | $10,679 | $13,207 | $15,724 | $18,053 | $18,173 | $19,705 | $20,932 | $21,841 | $23,312 | |
| Net Cash Flow | ($4,105) | ($6,280) | ($769) | $1,926 | $3,564 | $4,997 | $5,393 | $8,108 | $9,382 | $10,982 | $12,593 | $13,434 | |
| Cash Balance | $39,895 | $33,615 | $32,846 | $34,772 | $38,337 | $43,334 | $48,727 | $56,835 | $66,217 | $77,199 | $89,792 | $103,227 | |
| Pro Forma Balance Sheet | |||||||||||||
| Month 1 | Month 2 | Month 3 | Month 4 | Month 5 | Month 6 | Month 7 | Month 8 | Month 9 | Month 10 | Month 11 | Month 12 | ||
| Assets | Starting Balances | ||||||||||||
| Current Assets | |||||||||||||
| Cash | $44,000 | $39,895 | $33,615 | $32,846 | $34,772 | $38,337 | $43,334 | $48,727 | $56,835 | $66,217 | $77,199 | $89,792 | $103,227 |
| Accounts Receivable | $0 | $255 | $1,158 | $2,816 | $4,786 | $6,519 | $8,023 | $9,227 | $10,221 | $11,308 | $12,444 | $13,485 | $14,388 |
| Inventory | $5,000 | $5,000 | $4,600 | $3,583 | $3,320 | $4,130 | $5,300 | $5,795 | $6,540 | $7,035 | $7,530 | $8,450 | $9,575 |
| Other Current Assets | $0 | $0 | $0 | $0 | $0 | $0 | $0 | $0 | $0 | $0 | $0 | $0 | $0 |
| Total Current Assets | $49,000 | $45,150 | $39,373 | $39,245 | $42,878 | $48,986 | $56,656 | $63,748 | $73,596 | $84,561 | $97,173 | $111,727 | $127,190 |
| Long-term Assets | |||||||||||||
| Long-term Assets | $10,000 | $10,000 | $10,000 | $10,000 | $10,000 | $10,000 | $10,000 | $10,000 | $10,000 | $10,000 | $10,000 | $10,000 | $10,000 |
| Accumulated Depreciation | $0 | $83 | $167 | $250 | $333 | $417 | $500 | $583 | $667 | $750 | $833 | $917 | $1,000 |
| Total Long-term Assets | $10,000 | $9,917 | $9,833 | $9,750 | $9,667 | $9,583 | $9,500 | $9,417 | $9,333 | $9,250 | $9,167 | $9,083 | $9,000 |
| Total Assets | $59,000 | $55,067 | $49,206 | $48,995 | $52,545 | $58,569 | $66,156 | $73,165 | $82,929 | $93,811 | $106,340 | $120,810 | $136,190 |
| Liabilities and Capital | Month 1 | Month 2 | Month 3 | Month 4 | Month 5 | Month 6 | Month 7 | Month 8 | Month 9 | Month 10 | Month 11 | Month 12 | |
| Current Liabilities | |||||||||||||
| Accounts Payable | $0 | $4,838 | $3,636 | $4,934 | $7,367 | $9,810 | $11,625 | $11,690 | $12,938 | $13,624 | $14,472 | $15,890 | $17,091 |
| Current Borrowing | $0 | $0 | $0 | $0 | $0 | $0 | $0 | $0 | $0 | $0 | $0 | $0 | $0 |
| Other Current Liabilities | $0 | $0 | $0 | $0 | $0 | $0 | $0 | $0 | $0 | $0 | $0 | $0 | $0 |
| Subtotal Current Liabilities | $0 | $4,838 | $3,636 | $4,934 | $7,367 | $9,810 | $11,625 | $11,690 | $12,938 | $13,624 | $14,472 | $15,890 | $17,091 |
| Long-term Liabilities | $60,000 | $58,542 | $57,073 | $55,593 | $54,102 | $52,600 | $51,086 | $49,562 | $48,025 | $46,478 | $44,918 | $43,347 | $41,764 |
| Total Liabilities | $60,000 | $63,380 | $60,709 | $60,527 | $61,469 | $62,410 | $62,711 | $61,252 | $60,963 | $60,101 | $59,390 | $59,237 | $58,855 |
| Paid-in Capital | $35,000 | $35,000 | $35,000 | $35,000 | $35,000 | $35,000 | $35,000 | $35,000 | $35,000 | $35,000 | $35,000 | $35,000 | $35,000 |
| Retained Earnings | ($36,000) | ($36,000) | ($36,000) | ($36,000) | ($36,000) | ($36,000) | ($36,000) | ($36,000) | ($36,000) | ($36,000) | ($36,000) | ($36,000) | ($36,000) |
| Earnings | $0 | ($7,313) | ($10,503) | ($10,533) | ($7,924) | ($2,841) | $4,445 | $12,913 | $22,966 | $34,709 | $47,950 | $62,574 | $78,335 |
| Total Capital | ($1,000) | ($8,313) | ($11,503) | ($11,533) | ($8,924) | ($3,841) | $3,445 | $11,913 | $21,966 | $33,709 | $46,950 | $61,574 | $77,335 |
| Total Liabilities and Capital | $59,000 | $55,067 | $49,206 | $48,995 | $52,545 | $58,569 | $66,156 | $73,165 | $82,929 | $93,811 | $106,340 | $120,810 | $136,190 |
| Net Worth | ($1,000) | ($8,313) | ($11,503) | ($11,533) | ($8,924) | ($3,841) | $3,445 | $11,913 | $21,966 | $33,709 | $46,950 | $61,574 | $77,335 |

