
MarketCamp
Executive Summary
MarketCamp is a Mexico City based start-up business that provides local businesses with world-class qualified traffic generation and lead closures for Internet businesses. MarketCamp will offer a wide range of services including: detailed research, internet targeting, mini-site development, search engine submissions, and statistical reporting.
The Market
Mexico City’s business community will be the primary market for our company. The business size that we service can be relatively small because the cost per month is only $1,000, but services can be scaled up to meet the needs of huge clients due to the focus and expertise of the business. Internet connectivity in Mexico, in comparison with the U.S., is currently low, but interest is growing. Though far behind the major industrial countries, Mexico maintains one of the fastest growth rates on the Internet with thousands of users and thousands of WWW sites. Mexican WWW sites have been growing at the rate of 200-300 per month this year. CompuServe Mexico, the largest commercial Internet service provider in Mexico has 30,000 subscribers, while Spin Internet has 28,000 Mexican members.
Competitive Edge
MarketCamp has the competitive edge of experience and market expertise in a complicated field. This is truly an advantage as the founder and principal Paul Berry has spent the last five years in the United States honing his e-business skills. Paul received his MBA from the University of Oregon in 1992 and worked at a local software company for a few years. Wanting to see the East Coast, Paul moved to Boston and worked at Forrester Research, the premier Internet marketing research company. It was Paul’s work at Forrester Research that provided him with the experience and insight that he will leverage for MarketCamp.
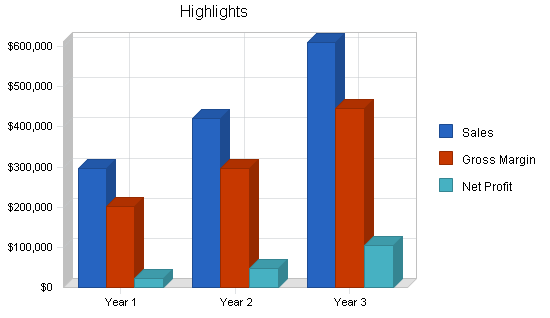
MarketCamp has conservatively forecasted sales for year onewith sales more than doubling in year three. Profitability will be reached by year one. MarketCamp’s profit margin will steadily increase from year one to year three.
1.1 Objectives
The following are the objectives for the company:
- To be self sufficient within three months.
- Healthy sales in Year 1, steadily growing in Year 2 and Year 3.
1.2 Mission
MarketCamp will provide full-service Internet marketing campaigns, focusing directly on keyword combination search results, targeted advertising and mini-sites that deliver an offer in a clean, statistically monitored environment.
1.3 Keys to Success
- Keeping existing clients to develop repeat business.
- Clients must make money, and know it.
- Start with easily-demonstratable simple module, and build up from there.
Company Summary
MarketCamp is a Web marketing business based in Mexico City. The company will start up as a simple consulting business billing directly in the founder’s name.
2.1 Company Ownership
This company is owned 100% by its founder, Paul Berry.
2.2 Start-up Summary
Start-up costs are detailed in the chart and table below.

| Start-up Funding | |
| Start-up Expenses to Fund | $3,500 |
| Start-up Assets to Fund | $20,000 |
| Total Funding Required | $23,500 |
| Assets | |
| Non-cash Assets from Start-up | $0 |
| Cash Requirements from Start-up | $20,000 |
| Additional Cash Raised | $0 |
| Cash Balance on Starting Date | $20,000 |
| Total Assets | $20,000 |
| Liabilities and Capital | |
| Liabilities | |
| Current Borrowing | $0 |
| Long-term Liabilities | $0 |
| Accounts Payable (Outstanding Bills) | $0 |
| Other Current Liabilities (interest-free) | $0 |
| Total Liabilities | $0 |
| Capital | |
| Planned Investment | |
| Paul Berry | $23,500 |
| Other | $0 |
| Additional Investment Requirement | $0 |
| Total Planned Investment | $23,500 |
| Loss at Start-up (Start-up Expenses) | ($3,500) |
| Total Capital | $20,000 |
| Total Capital and Liabilities | $20,000 |
| Total Funding | $23,500 |
| Start-up | |
| Requirements | |
| Start-up Expenses | |
| Legal | $1,000 |
| Stationery etc. | $1,000 |
| Brochures | $1,000 |
| Insurance | $500 |
| Other | $0 |
| Total Start-up Expenses | $3,500 |
| Start-up Assets | |
| Cash Required | $20,000 |
| Other Current Assets | $0 |
| Long-term Assets | $0 |
| Total Assets | $20,000 |
| Total Requirements | $23,500 |
2.3 Company Locations and Facilities
MarketCamp will begin as a home-office business in the founder’s apartment in Mexico City. After six months of operation it will expand to a formal office space in Mexico City.
Services
- Detailed Research.
- Internet Targeting Proposal.
- Focused Mini-Site Development.
- Top Search Results on Keywords.
- Advertising Creative Design.
- Monthly Statistical Reporting.
- Campaign Maintenance.
3.1 Service Description
**Details and a description of services have been omitted from this published plan because they were strategic and proprietary.
3.2 Competitive Comparison
Competition isn’t the most important factor at this time, there is plenty of need and potential customers out there.
3.3 Sales Literature
Our website will serve as sales literature.
3.4 Fulfillment
For the present time, until there is real growth, services will be delivered by the founder.
3.5 Technology
**Details have been omitted from this published plan because they were strategic and proprietary.
3.6 Future Services
**Details have been omitted from this published plan because they were strategic and proprietary.
Market Analysis Summary
Mexico City’s business community will be the primary market for our company. We will attempt to work with business models that attract customers and sign contracts. The business size can be relatively small because the cost per month is only $1,000, but services can be scaled up to meet the needs of huge clients due to the focus and expertise of the business.
Internet connectivity in Mexico, in comparison with the U.S., is currently low, but interest is growing. Though far behind the major industrial countries, Mexico maintains one of the fastest growth rates on the Internet with thousands of users and thousands of WWW sites. Mexican WWW sites have been growing at the rate of 200-300 per month this year. CompuServe Mexico, the largest commercial Internet service provider in Mexico has 30,000 subscribers, while Spin Internet has 28,000 Mexican members. Microsoft Mexico, a division of Microsoft’s recently-launched online service named Microsoft Network, will charge $4.95 per month (about one half of CompuServe’s $9.95 per month rate) and will offer local telephone access in Mexico City, Guadalajara, Monterrey, and three other cities. The service will be English-only and U.S.-oriented for at least the first six months, but will eventually include local content.
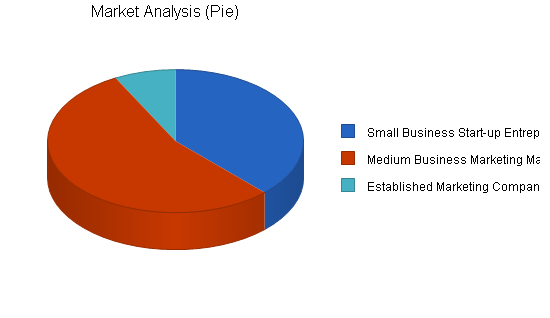
Many companies in Mexico City currently have Internet access and more are realizing the importance of presence on the Web in order to attract international business. For this reason, our Market Analysis table predicts rapid growth amongst potential small businesses and marketing managers for medium-sized businesses to grow in-line with the growth of Internet usage.
We will try to work with other more established marketing companies, giving up some of the margin in order to get access to more clients more quickly.
We will need to make a decision on pricing, whether to keep rates at an attractive sign-up rate or focus on the more successful clients and raise rates.
| Market Analysis | |||||||
| Year 1 | Year 2 | Year 3 | Year 4 | Year 5 | |||
| Potential Customers | Growth | CAGR | |||||
| Small Business Start-up Entrepreneurs | 100% | 475 | 950 | 1,900 | 3,800 | 7,600 | 100.00% |
| Medium Business Marketing Managers | 80% | 684 | 1,231 | 2,216 | 3,989 | 7,180 | 80.00% |
| Established Marketing Companies | 20% | 97 | 116 | 139 | 167 | 200 | 19.83% |
| Total | 85.84% | 1,256 | 2,297 | 4,255 | 7,956 | 14,980 | 85.84% |
Strategy and Implementation Summary
We will obtain our first clients through word-of-mouth from the board of directors and board of advisors as well as the previous connections of Paul Berry’s freelance business. Each mini-site will contain a small “powered by MarketCamp” logo which will lead to information about us. Because of the quality of our work, and the desirability of our expertise, we expect to add a number of clients in the near future.
5.1 Competitive Edge
The strongest competitive edge that MarketCamp has is our expertise in a very complicated field. Obtaining high click-through and top placement in search engines is a fine art that our founder has tremendous, world-class experience in. Because Mexico is somewhere between three and five years behind the American Internet, the expertise of the founder has huge leverage. We will essentially be the first to market this service in Mexico City, and we will be years ahead of competitors.

5.2 Sales Strategy
The beauty of this business is in the subscription model and the commissions based earnings. Once we sign a client, most will stay for a long period of time, possibly for the lifetime of the business. We feel 30% to 60% growth rates are very modest, therefore we could potentially sign many clients more quickly.
5.3 Sales Forecast
We expect that a 30% to 60% growth rate throughout the first year is very modest. If we find more clients signing up we can scale the team quickly to reach those expectations. The back-end of the business will be built by the founder and a network of top programmers.


| Sales Forecast | |||
| Year 1 | Year 2 | Year 3 | |
| Sales | |||
| Monthly Revenue | $210,550 | $290,000 | $410,000 |
| Commission Sales | $86,760 | $130,000 | $200,000 |
| Total Sales | $297,310 | $420,000 | $610,000 |
| Direct Cost of Sales | Year 1 | Year 2 | Year 3 |
| Monthly Revenue | $39,831 | $54,860 | $77,561 |
| Commission Sales | $17,352 | $26,000 | $40,000 |
| Subtotal Direct Cost of Sales | $57,183 | $80,860 | $117,561 |
5.4 Milestones
The specific milestones are shown in the following chart and table.

| Milestones | |||||
| Milestone | Start Date | End Date | Budget | Manager | Department |
| Site Finished, Company Emails Set | 1/1/2001 | 3/1/2001 | $0 | Paul Berry | Founder |
| First Client Signs | 4/1/2001 | 4/30/2001 | $0 | Paul Berry | Founder |
| Second Client Signs | 4/15/2001 | 5/15/2001 | $0 | Paul Berry | Founder |
| Third Client Signs | 5/1/2001 | 6/1/2001 | $0 | Paul Berry | Founder |
| Official Investment and Equity Transactions | 6/1/2001 | 8/31/2001 | $0 | Paul Berry | Founder |
| 10th Client Signs | 8/1/2001 | 10/31/2001 | $0 | Paul Berry | Founder |
| Second Marketing Push | 11/1/2001 | 1/31/2001 | $0 | Paul Berry | Founder |
| Totals | $0 | ||||
Management Summary
Paul Berry will be president, responsible for decisions on all hires and expenses. Paul will also do the work behind the scenes, structuring a system that will enable other future employees to scale the business as clients are added.
Carlos Silva will be an initial investor, possibly also a co-founder and part of the board of directors.
Gabriela Lopez will be one of the first employees, contracted part-time for her expertise in design and knowledge of the Web.
Raul Garcia will be another of the first employees, contracted part-time for his expertise as a sales person and junior executive in Mexico City.
6.1 Personnel Plan
Paul will be paid somewhere between $3,000 and $5,000 in the initial months, depending on the amount of clients signed, and the nature of those contracts.
Gabriela Lopez will be contracted for $1,000 to $2,000 depending on the load of work and her availability. She will be responsible for the corporate identity and all stationery and brochures.
Raul Garcia will be contracted for $1,000 to $2,000 depending on his involvement with the company and he will also receive a commission structure for additional clients beyond the expected ones.
| Personnel Plan | |||
| Year 1 | Year 2 | Year 3 | |
| Paul Berry | $43,000 | $60,000 | $75,000 |
| Commission | $17,352 | $26,000 | $40,000 |
| Programmers | $19,900 | $27,000 | $43,000 |
| Total People | 0 | 0 | 0 |
| Total Payroll | $80,252 | $113,000 | $158,000 |
6.2 Management Team
**Details have been omitted from this published plan because they were strategic and proprietary.
6.3 Management Team Gaps
**Details have been omitted from this published plan because they were strategic and proprietary.
Financial Plan
MarketCamp will finance growth mainly through cash flow. We recognize that this means we will have to grow more slowly than we might like.
The most important factor to our success is collection days. We can’t push our clients hard on collection days, because they are in larger companies and will normally have marketing authority, not financial authority. Therefore, we need to develop a permanent system of receivables financing, using one of the established financial companies in that business.
We are also assuming start-up capital which will be more than enough to cover salaries, artwork and other expenses while the business begins to produce more cash.
We may take more financing than we originally planned to be able to bring in some very key investors as equity partners, more for their connections to potential clients in Mexico City than for the investment itself.
7.1 Important Assumptions
The Financial Plan depends on important assumptions, most of which are shown in the following table as annual assumptions. The monthly assumptions are included in the appendix. From the beginning, we recognize that collection days are critical, but are not a factor we can influence easily. Interest rates, tax rates, and personnel burden are based on conservative assumptions.
Some of the more important underlying assumptions are:
- We assume an economy slightly crippled by the George W. Bush administration in the U.S. and by the skepticism caused by the fall of the dot-coms with terrible business models.
- We assume that we can communicate the service to Mexican business owners.
| General Assumptions | |||
| Year 1 | Year 2 | Year 3 | |
| Plan Month | 1 | 2 | 3 |
| Current Interest Rate | 10.00% | 10.00% | 10.00% |
| Long-term Interest Rate | 10.00% | 10.00% | 10.00% |
| Tax Rate | 25.42% | 25.00% | 25.42% |
| Other | 0 | 0 | 0 |
7.2 Key Financial Indicators
The Benchmarks chart shows our projections on an index basis for key financial indicators.

7.3 Break-even Analysis
The following chart and table summarize our Break-even Analysis showing fixed costs in U.S. dollars per month at the outset (a bare minimum), and what we need to bill to cover our costs. We don’t really expect to reach break-even until a few months into the business operation.

| Break-even Analysis | |
| Monthly Revenue Break-even | $17,510 |
| Assumptions: | |
| Average Percent Variable Cost | 19% |
| Estimated Monthly Fixed Cost | $14,142 |
7.4 Projected Profit and Loss
Projected Profit and Loss is presented in the following table and charts.


| Pro Forma Profit and Loss | |||
| Year 1 | Year 2 | Year 3 | |
| Sales | $297,310 | $420,000 | $610,000 |
| Direct Cost of Sales | $57,183 | $80,860 | $117,561 |
| Other | $39,581 | $44,000 | $48,000 |
| Total Cost of Sales | $96,763 | $124,860 | $165,561 |
| Gross Margin | $200,547 | $295,140 | $444,439 |
| Gross Margin % | 67.45% | 70.27% | 72.86% |
| Expenses | |||
| Payroll | $80,252 | $113,000 | $158,000 |
| Sales and Marketing and Other Expenses | $41,372 | $48,000 | $61,000 |
| Depreciation | $0 | $0 | $0 |
| Leased Equipment | $15,832 | $17,000 | $19,000 |
| Utilities | $1,800 | $2,000 | $2,000 |
| Insurance | $2,400 | $3,000 | $3,000 |
| Rent | $12,000 | $24,000 | $26,000 |
| Payroll Taxes | $16,050 | $22,600 | $31,600 |
| Other | $0 | $0 | $0 |
| Total Operating Expenses | $169,707 | $229,600 | $300,600 |
| Profit Before Interest and Taxes | $30,840 | $65,540 | $143,839 |
| EBITDA | $30,840 | $65,540 | $143,839 |
| Interest Expense | $667 | $3,000 | $3,500 |
| Taxes Incurred | $7,420 | $15,635 | $35,669 |
| Net Profit | $22,753 | $46,905 | $104,669 |
| Net Profit/Sales | 7.65% | 11.17% | 17.16% |
7.5 Projected Cash Flow
Cash flow is going to rely on the time to collect from account receivables. Carlos Silva, Raul Garcia and others who have more experience working with Mexican businesses will be able to help us estimate both the collection and payment times. We are working on an assumption of 30 days to collect. Clients will pay at the beginning of each month except when this is impossible for them.
The present cash flow projection assumes sacrificed salaries taken as equity contribution for the first few months. The inputs for capital input are actually “sweat equity” contributions from the founder.

| Pro Forma Cash Flow | |||
| Year 1 | Year 2 | Year 3 | |
| Cash Received | |||
| Cash from Operations | |||
| Cash Sales | $0 | $0 | $0 |
| Cash from Receivables | $197,360 | $378,754 | $546,126 |
| Subtotal Cash from Operations | $197,360 | $378,754 | $546,126 |
| Additional Cash Received | |||
| Sales Tax, VAT, HST/GST Received | $0 | $0 | $0 |
| New Current Borrowing | $20,000 | $40,000 | $0 |
| New Other Liabilities (interest-free) | $0 | $0 | $0 |
| New Long-term Liabilities | $0 | $0 | $0 |
| Sales of Other Current Assets | $0 | $0 | $0 |
| Sales of Long-term Assets | $0 | $0 | $0 |
| New Investment Received | $14,000 | $0 | $0 |
| Subtotal Cash Received | $231,360 | $418,754 | $546,126 |
| Expenditures | Year 1 | Year 2 | Year 3 |
| Expenditures from Operations | |||
| Cash Spending | $80,252 | $113,000 | $158,000 |
| Bill Payments | $159,263 | $273,759 | $340,161 |
| Subtotal Spent on Operations | $239,515 | $386,759 | $498,161 |
| Additional Cash Spent | |||
| Sales Tax, VAT, HST/GST Paid Out | $0 | $0 | $0 |
| Principal Repayment of Current Borrowing | $0 | $20,000 | $10,000 |
| Other Liabilities Principal Repayment | $0 | $0 | $0 |
| Long-term Liabilities Principal Repayment | $0 | $0 | $0 |
| Purchase Other Current Assets | $0 | $0 | $0 |
| Purchase Long-term Assets | $0 | $0 | $0 |
| Dividends | $0 | $0 | $0 |
| Subtotal Cash Spent | $239,515 | $406,759 | $508,161 |
| Net Cash Flow | ($8,155) | $11,995 | $37,965 |
| Cash Balance | $11,845 | $23,840 | $61,805 |
7.6 Projected Balance Sheet
The Balance Sheet in the following table shows managed but sufficient growth of net worth, and a sufficiently healthy financial position. The monthly estimates are included in the appendix.
| Pro Forma Balance Sheet | |||
| Year 1 | Year 2 | Year 3 | |
| Assets | |||
| Current Assets | |||
| Cash | $11,845 | $23,840 | $61,805 |
| Accounts Receivable | $99,950 | $141,196 | $205,070 |
| Other Current Assets | $0 | $0 | $0 |
| Total Current Assets | $111,795 | $165,036 | $266,875 |
| Long-term Assets | |||
| Long-term Assets | $0 | $0 | $0 |
| Accumulated Depreciation | $0 | $0 | $0 |
| Total Long-term Assets | $0 | $0 | $0 |
| Total Assets | $111,795 | $165,036 | $266,875 |
| Liabilities and Capital | Year 1 | Year 2 | Year 3 |
| Current Liabilities | |||
| Accounts Payable | $35,041 | $21,378 | $28,548 |
| Current Borrowing | $20,000 | $40,000 | $30,000 |
| Other Current Liabilities | $0 | $0 | $0 |
| Subtotal Current Liabilities | $55,041 | $61,378 | $58,548 |
| Long-term Liabilities | $0 | $0 | $0 |
| Total Liabilities | $55,041 | $61,378 | $58,548 |
| Paid-in Capital | $37,500 | $37,500 | $37,500 |
| Retained Earnings | ($3,500) | $19,253 | $66,158 |
| Earnings | $22,753 | $46,905 | $104,669 |
| Total Capital | $56,753 | $103,658 | $208,327 |
| Total Liabilities and Capital | $111,795 | $165,036 | $266,875 |
| Net Worth | $56,753 | $103,658 | $208,327 |
7.7 Business Ratios
Business Ratios for the years of this plan are shown below. Industry profile ratios based on the Standard Industrial Classification (SIC) code 8742, Management Consulting Services, are shown for comparison.
| Ratio Analysis | ||||
| Year 1 | Year 2 | Year 3 | Industry Profile | |
| Sales Growth | 0.00% | 41.27% | 45.24% | 8.60% |
| Percent of Total Assets | ||||
| Accounts Receivable | 89.40% | 85.55% | 76.84% | 24.40% |
| Other Current Assets | 0.00% | 0.00% | 0.00% | 46.70% |
| Total Current Assets | 100.00% | 100.00% | 100.00% | 74.90% |
| Long-term Assets | 0.00% | 0.00% | 0.00% | 25.10% |
| Total Assets | 100.00% | 100.00% | 100.00% | 100.00% |
| Current Liabilities | 49.23% | 37.19% | 21.94% | 42.80% |
| Long-term Liabilities | 0.00% | 0.00% | 0.00% | 17.20% |
| Total Liabilities | 49.23% | 37.19% | 21.94% | 60.00% |
| Net Worth | 50.77% | 62.81% | 78.06% | 40.00% |
| Percent of Sales | ||||
| Sales | 100.00% | 100.00% | 100.00% | 100.00% |
| Gross Margin | 67.45% | 70.27% | 72.86% | 0.00% |
| Selling, General & Administrative Expenses | 59.84% | 59.10% | 55.60% | 83.50% |
| Advertising Expenses | 1.01% | 1.43% | 2.46% | 1.20% |
| Profit Before Interest and Taxes | 10.37% | 15.60% | 23.58% | 2.60% |
| Main Ratios | ||||
| Current | 2.03 | 2.69 | 4.56 | 1.59 |
| Quick | 2.03 | 2.69 | 4.56 | 1.26 |
| Total Debt to Total Assets | 49.23% | 37.19% | 21.94% | 60.00% |
| Pre-tax Return on Net Worth | 53.17% | 60.33% | 67.36% | 4.40% |
| Pre-tax Return on Assets | 26.99% | 37.89% | 52.59% | 10.90% |
| Additional Ratios | Year 1 | Year 2 | Year 3 | |
| Net Profit Margin | 7.65% | 11.17% | 17.16% | n.a |
| Return on Equity | 40.09% | 45.25% | 50.24% | n.a |
| Activity Ratios | ||||
| Accounts Receivable Turnover | 2.97 | 2.97 | 2.97 | n.a |
| Collection Days | 54 | 105 | 104 | n.a |
| Accounts Payable Turnover | 5.55 | 12.17 | 12.17 | n.a |
| Payment Days | 27 | 40 | 26 | n.a |
| Total Asset Turnover | 2.66 | 2.54 | 2.29 | n.a |
| Debt Ratios | ||||
| Debt to Net Worth | 0.97 | 0.59 | 0.28 | n.a |
| Current Liab. to Liab. | 1.00 | 1.00 | 1.00 | n.a |
| Liquidity Ratios | ||||
| Net Working Capital | $56,753 | $103,658 | $208,327 | n.a |
| Interest Coverage | 46.26 | 21.85 | 41.10 | n.a |
| Additional Ratios | ||||
| Assets to Sales | 0.38 | 0.39 | 0.44 | n.a |
| Current Debt/Total Assets | 49% | 37% | 22% | n.a |
| Acid Test | 0.22 | 0.39 | 1.06 | n.a |
| Sales/Net Worth | 5.24 | 4.05 | 2.93 | n.a |
| Dividend Payout | 0.00 | 0.00 | 0.00 | n.a |
Appendix
| Personnel Plan | |||||||||||||
| Month 1 | Month 2 | Month 3 | Month 4 | Month 5 | Month 6 | Month 7 | Month 8 | Month 9 | Month 10 | Month 11 | Month 12 | ||
| Paul Berry | 0% | $3,000 | $3,000 | $3,000 | $3,000 | $3,000 | $3,000 | $4,000 | $4,000 | $4,000 | $4,000 | $4,000 | $5,000 |
| Commission | 0% | $50 | $400 | $623 | $911 | $1,019 | $1,559 | $1,163 | $1,163 | $1,703 | $2,547 | $3,035 | $3,179 |
| Programmers | 0% | $0 | $0 | $0 | $0 | $1,200 | $1,400 | $1,800 | $2,500 | $3,000 | $3,000 | $3,300 | $3,700 |
| Total People | 0 | 0 | 0 | 1 | 1 | 1 | 2 | 0 | 0 | 0 | 0 | 0 | |
| Total Payroll | $3,050 | $3,400 | $3,623 | $3,911 | $5,219 | $5,959 | $6,963 | $7,663 | $8,703 | $9,547 | $10,335 | $11,879 | |
| General Assumptions | |||||||||||||
| Month 1 | Month 2 | Month 3 | Month 4 | Month 5 | Month 6 | Month 7 | Month 8 | Month 9 | Month 10 | Month 11 | Month 12 | ||
| Plan Month | 1 | 2 | 3 | 4 | 5 | 6 | 7 | 8 | 9 | 10 | 11 | 12 | |
| Current Interest Rate | 10.00% | 10.00% | 10.00% | 10.00% | 10.00% | 10.00% | 10.00% | 10.00% | 10.00% | 10.00% | 10.00% | 10.00% | |
| Long-term Interest Rate | 10.00% | 10.00% | 10.00% | 10.00% | 10.00% | 10.00% | 10.00% | 10.00% | 10.00% | 10.00% | 10.00% | 10.00% | |
| Tax Rate | 30.00% | 25.00% | 25.00% | 25.00% | 25.00% | 25.00% | 25.00% | 25.00% | 25.00% | 25.00% | 25.00% | 25.00% | |
| Other | 0 | 0 | 0 | 0 | 0 | 0 | 0 | 0 | 0 | 0 | 0 | 0 | |
| Pro Forma Profit and Loss | |||||||||||||
| Month 1 | Month 2 | Month 3 | Month 4 | Month 5 | Month 6 | Month 7 | Month 8 | Month 9 | Month 10 | Month 11 | Month 12 | ||
| Sales | $5,250 | $10,000 | $10,650 | $13,890 | $16,230 | $22,530 | $20,050 | $22,450 | $32,250 | $42,470 | $47,710 | $53,830 | |
| Direct Cost of Sales | $1,300 | $1,600 | $2,063 | $2,639 | $3,093 | $4,047 | $4,149 | $4,746 | $6,003 | $7,707 | $9,227 | $10,609 | |
| Other | 10% | $1,000 | $1,200 | $1,440 | $1,728 | $2,074 | $2,488 | $2,986 | $3,583 | $4,300 | $5,160 | $6,192 | $7,430 |
| Total Cost of Sales | $2,300 | $2,800 | $3,503 | $4,367 | $5,166 | $6,536 | $7,135 | $8,329 | $10,303 | $12,867 | $15,418 | $18,039 | |
| Gross Margin | $2,950 | $7,200 | $7,147 | $9,523 | $11,064 | $15,994 | $12,915 | $14,121 | $21,947 | $29,603 | $32,292 | $35,791 | |
| Gross Margin % | 56.19% | 72.00% | 67.11% | 68.56% | 68.17% | 70.99% | 64.41% | 62.90% | 68.05% | 69.70% | 67.68% | 66.49% | |
| Expenses | |||||||||||||
| Payroll | $3,050 | $3,400 | $3,623 | $3,911 | $5,219 | $5,959 | $6,963 | $7,663 | $8,703 | $9,547 | $10,335 | $11,879 | |
| Sales and Marketing and Other Expenses | $1,000 | $1,175 | $1,393 | $1,663 | $2,001 | $2,422 | $2,950 | $3,610 | $4,439 | $5,481 | $6,792 | $8,445 | |
| Depreciation | $0 | $0 | $0 | $0 | $0 | $0 | $0 | $0 | $0 | $0 | $0 | $0 | |
| Leased Equipment | 10% | $400 | $480 | $576 | $691 | $829 | $995 | $1,194 | $1,433 | $1,720 | $2,064 | $2,477 | $2,972 |
| Utilities | 10% | $150 | $150 | $150 | $150 | $150 | $150 | $150 | $150 | $150 | $150 | $150 | $150 |
| Insurance | 10% | $200 | $200 | $200 | $200 | $200 | $200 | $200 | $200 | $200 | $200 | $200 | $200 |
| Rent | 10% | $0 | $0 | $0 | $0 | $0 | $0 | $2,000 | $2,000 | $2,000 | $2,000 | $2,000 | $2,000 |
| Payroll Taxes | 20% | $610 | $680 | $725 | $782 | $1,044 | $1,192 | $1,393 | $1,533 | $1,741 | $1,909 | $2,067 | $2,376 |
| Other | $0 | $0 | $0 | $0 | $0 | $0 | $0 | $0 | $0 | $0 | $0 | $0 | |
| Total Operating Expenses | $5,410 | $6,085 | $6,666 | $7,398 | $9,443 | $10,919 | $14,850 | $16,589 | $18,953 | $21,351 | $24,021 | $28,022 | |
| Profit Before Interest and Taxes | ($2,460) | $1,115 | $481 | $2,125 | $1,621 | $5,076 | ($1,935) | ($2,469) | $2,995 | $8,252 | $8,271 | $7,769 | |
| EBITDA | ($2,460) | $1,115 | $481 | $2,125 | $1,621 | $5,076 | ($1,935) | ($2,469) | $2,995 | $8,252 | $8,271 | $7,769 | |
| Interest Expense | $0 | $0 | $0 | $0 | $0 | $0 | $0 | $0 | $167 | $167 | $167 | $167 | |
| Taxes Incurred | ($738) | $279 | $120 | $531 | $405 | $1,269 | ($484) | ($617) | $707 | $2,021 | $2,026 | $1,900 | |
| Net Profit | ($1,722) | $836 | $361 | $1,594 | $1,216 | $3,807 | ($1,451) | ($1,851) | $2,121 | $6,064 | $6,078 | $5,701 | |
| Net Profit/Sales | -32.80% | 8.36% | 3.39% | 11.48% | 7.49% | 16.90% | -7.24% | -8.25% | 6.58% | 14.28% | 12.74% | 10.59% | |
| Pro Forma Cash Flow | |||||||||||||
| Month 1 | Month 2 | Month 3 | Month 4 | Month 5 | Month 6 | Month 7 | Month 8 | Month 9 | Month 10 | Month 11 | Month 12 | ||
| Cash Received | |||||||||||||
| Cash from Operations | |||||||||||||
| Cash Sales | $0 | $0 | $0 | $0 | $0 | $0 | $0 | $0 | $0 | $0 | $0 | $0 | |
| Cash from Receivables | $0 | $175 | $5,408 | $10,022 | $10,758 | $13,968 | $16,440 | $22,447 | $20,130 | $22,777 | $32,591 | $42,645 | |
| Subtotal Cash from Operations | $0 | $175 | $5,408 | $10,022 | $10,758 | $13,968 | $16,440 | $22,447 | $20,130 | $22,777 | $32,591 | $42,645 | |
| Additional Cash Received | |||||||||||||
| Sales Tax, VAT, HST/GST Received | 0.00% | $0 | $0 | $0 | $0 | $0 | $0 | $0 | $0 | $0 | $0 | $0 | $0 |
| New Current Borrowing | $0 | $0 | $0 | $0 | $0 | $0 | $0 | $0 | $20,000 | $0 | $0 | $0 | |
| New Other Liabilities (interest-free) | $0 | $0 | $0 | $0 | $0 | $0 | $0 | $0 | $0 | $0 | $0 | $0 | |
| New Long-term Liabilities | $0 | $0 | $0 | $0 | $0 | $0 | $0 | $0 | $0 | $0 | $0 | $0 | |
| Sales of Other Current Assets | $0 | $0 | $0 | $0 | $0 | $0 | $0 | $0 | $0 | $0 | $0 | $0 | |
| Sales of Long-term Assets | $0 | $0 | $0 | $0 | $0 | $0 | $0 | $0 | $0 | $0 | $0 | $0 | |
| New Investment Received | $7,000 | $4,000 | $3,000 | $0 | $0 | $0 | $0 | $0 | $0 | $0 | $0 | $0 | |
| Subtotal Cash Received | $7,000 | $4,175 | $8,408 | $10,022 | $10,758 | $13,968 | $16,440 | $22,447 | $40,130 | $22,777 | $32,591 | $42,645 | |
| Expenditures | Month 1 | Month 2 | Month 3 | Month 4 | Month 5 | Month 6 | Month 7 | Month 8 | Month 9 | Month 10 | Month 11 | Month 12 | |
| Expenditures from Operations | |||||||||||||
| Cash Spending | $3,050 | $3,400 | $3,623 | $3,911 | $5,219 | $5,959 | $6,963 | $7,663 | $8,703 | $9,547 | $10,335 | $11,879 | |
| Bill Payments | $131 | $3,983 | $5,794 | $6,724 | $8,432 | $9,894 | $12,823 | $14,608 | $16,798 | $21,607 | $27,007 | $31,462 | |
| Subtotal Spent on Operations | $3,181 | $7,383 | $9,417 | $10,635 | $13,651 | $15,853 | $19,786 | $22,271 | $25,501 | $31,154 | $37,342 | $43,341 | |
| Additional Cash Spent | |||||||||||||
| Sales Tax, VAT, HST/GST Paid Out | $0 | $0 | $0 | $0 | $0 | $0 | $0 | $0 | $0 | $0 | $0 | $0 | |
| Principal Repayment of Current Borrowing | $0 | $0 | $0 | $0 | $0 | $0 | $0 | $0 | $0 | $0 | $0 | $0 | |
| Other Liabilities Principal Repayment | $0 | $0 | $0 | $0 | $0 | $0 | $0 | $0 | $0 | $0 | $0 | $0 | |
| Long-term Liabilities Principal Repayment | $0 | $0 | $0 | $0 | $0 | $0 | $0 | $0 | $0 | $0 | $0 | $0 | |
| Purchase Other Current Assets | $0 | $0 | $0 | $0 | $0 | $0 | $0 | $0 | $0 | $0 | $0 | $0 | |
| Purchase Long-term Assets | $0 | $0 | $0 | $0 | $0 | $0 | $0 | $0 | $0 | $0 | $0 | $0 | |
| Dividends | $0 | $0 | $0 | $0 | $0 | $0 | $0 | $0 | $0 | $0 | $0 | $0 | |
| Subtotal Cash Spent | $3,181 | $7,383 | $9,417 | $10,635 | $13,651 | $15,853 | $19,786 | $22,271 | $25,501 | $31,154 | $37,342 | $43,341 | |
| Net Cash Flow | $3,819 | ($3,208) | ($1,009) | ($613) | ($2,893) | ($1,885) | ($3,346) | $176 | $14,629 | ($8,377) | ($4,751) | ($697) | |
| Cash Balance | $23,819 | $20,611 | $19,602 | $18,989 | $16,096 | $14,211 | $10,865 | $11,041 | $25,670 | $17,293 | $12,541 | $11,845 | |
| Pro Forma Balance Sheet | |||||||||||||
| Month 1 | Month 2 | Month 3 | Month 4 | Month 5 | Month 6 | Month 7 | Month 8 | Month 9 | Month 10 | Month 11 | Month 12 | ||
| Assets | Starting Balances | ||||||||||||
| Current Assets | |||||||||||||
| Cash | $20,000 | $23,819 | $20,611 | $19,602 | $18,989 | $16,096 | $14,211 | $10,865 | $11,041 | $25,670 | $17,293 | $12,541 | $11,845 |
| Accounts Receivable | $0 | $5,250 | $15,075 | $20,317 | $24,185 | $29,657 | $38,219 | $41,829 | $41,832 | $53,952 | $73,645 | $88,764 | $99,950 |
| Other Current Assets | $0 | $0 | $0 | $0 | $0 | $0 | $0 | $0 | $0 | $0 | $0 | $0 | $0 |
| Total Current Assets | $20,000 | $29,069 | $35,686 | $39,919 | $43,174 | $45,753 | $52,430 | $52,694 | $52,873 | $79,622 | $90,938 | $101,306 | $111,795 |
| Long-term Assets | |||||||||||||
| Long-term Assets | $0 | $0 | $0 | $0 | $0 | $0 | $0 | $0 | $0 | $0 | $0 | $0 | $0 |
| Accumulated Depreciation | $0 | $0 | $0 | $0 | $0 | $0 | $0 | $0 | $0 | $0 | $0 | $0 | $0 |
| Total Long-term Assets | $0 | $0 | $0 | $0 | $0 | $0 | $0 | $0 | $0 | $0 | $0 | $0 | $0 |
| Total Assets | $20,000 | $29,069 | $35,686 | $39,919 | $43,174 | $45,753 | $52,430 | $52,694 | $52,873 | $79,622 | $90,938 | $101,306 | $111,795 |
| Liabilities and Capital | Month 1 | Month 2 | Month 3 | Month 4 | Month 5 | Month 6 | Month 7 | Month 8 | Month 9 | Month 10 | Month 11 | Month 12 | |
| Current Liabilities | |||||||||||||
| Accounts Payable | $0 | $3,791 | $5,572 | $6,444 | $8,105 | $9,469 | $12,339 | $14,053 | $16,084 | $20,712 | $25,964 | $30,254 | $35,041 |
| Current Borrowing | $0 | $0 | $0 | $0 | $0 | $0 | $0 | $0 | $0 | $20,000 | $20,000 | $20,000 | $20,000 |
| Other Current Liabilities | $0 | $0 | $0 | $0 | $0 | $0 | $0 | $0 | $0 | $0 | $0 | $0 | $0 |
| Subtotal Current Liabilities | $0 | $3,791 | $5,572 | $6,444 | $8,105 | $9,469 | $12,339 | $14,053 | $16,084 | $40,712 | $45,964 | $50,254 | $55,041 |
| Long-term Liabilities | $0 | $0 | $0 | $0 | $0 | $0 | $0 | $0 | $0 | $0 | $0 | $0 | $0 |
| Total Liabilities | $0 | $3,791 | $5,572 | $6,444 | $8,105 | $9,469 | $12,339 | $14,053 | $16,084 | $40,712 | $45,964 | $50,254 | $55,041 |
| Paid-in Capital | $23,500 | $30,500 | $34,500 | $37,500 | $37,500 | $37,500 | $37,500 | $37,500 | $37,500 | $37,500 | $37,500 | $37,500 | $37,500 |
| Retained Earnings | ($3,500) | ($3,500) | ($3,500) | ($3,500) | ($3,500) | ($3,500) | ($3,500) | ($3,500) | ($3,500) | ($3,500) | ($3,500) | ($3,500) | ($3,500) |
| Earnings | $0 | ($1,722) | ($886) | ($525) | $1,069 | $2,284 | $6,091 | $4,640 | $2,789 | $4,910 | $10,974 | $17,052 | $22,753 |
| Total Capital | $20,000 | $25,278 | $30,114 | $33,475 | $35,069 | $36,284 | $40,091 | $38,640 | $36,789 | $38,910 | $44,974 | $51,052 | $56,753 |
| Total Liabilities and Capital | $20,000 | $29,069 | $35,686 | $39,919 | $43,174 | $45,753 | $52,430 | $52,694 | $52,873 | $79,622 | $90,938 | $101,306 | $111,795 |
| Net Worth | $20,000 | $25,278 | $30,114 | $33,475 | $35,069 | $36,284 | $40,091 | $38,640 | $36,789 | $38,910 | $44,974 | $51,052 | $56,753 |
| Sales Forecast | |||||||||||||
| Month 1 | Month 2 | Month 3 | Month 4 | Month 5 | Month 6 | Month 7 | Month 8 | Month 9 | Month 10 | Month 11 | Month 12 | ||
| Sales | |||||||||||||
| Monthly Revenue | 40% | $5,000 | $8,000 | $7,535 | $9,335 | $11,135 | $14,735 | $14,235 | $16,635 | $23,735 | $29,735 | $32,535 | $37,935 |
| Commission Sales | 50% | $250 | $2,000 | $3,115 | $4,555 | $5,095 | $7,795 | $5,815 | $5,815 | $8,515 | $12,735 | $15,175 | $15,895 |
| Total Sales | $5,250 | $10,000 | $10,650 | $13,890 | $16,230 | $22,530 | $20,050 | $22,450 | $32,250 | $42,470 | $47,710 | $53,830 | |
| Direct Cost of Sales | Month 1 | Month 2 | Month 3 | Month 4 | Month 5 | Month 6 | Month 7 | Month 8 | Month 9 | Month 10 | Month 11 | Month 12 | |
| Monthly Revenue | $1,250 | $1,200 | $1,440 | $1,728 | $2,074 | $2,488 | $2,986 | $3,583 | $4,300 | $5,160 | $6,192 | $7,430 | |
| Commission Sales | $50 | $400 | $623 | $911 | $1,019 | $1,559 | $1,163 | $1,163 | $1,703 | $2,547 | $3,035 | $3,179 | |
| Subtotal Direct Cost of Sales | $1,300 | $1,600 | $2,063 | $2,639 | $3,093 | $4,047 | $4,149 | $4,746 | $6,003 | $7,707 | $9,227 | $10,609 | |

