
JTB Products and Services
Executive Summary
This plan provides detailed investor information and includes the basic strategic business plan information necessary for initial establishment and operation of JTB Products and Services, Inc, a division of JTB Technologies, Inc. JTB Products and Services, Inc will be formed in Richfield, Louisiana, as a corporation under the laws of the Commonwealth of Louisiana.
JTB’s Products and Services Division will manufacture custom tools tailored to the Automotive, Auto Body Repair, Sports Service, and Commercial Drilling Industries. Additionally, this division will also provide re-conditioning services to clients using our quality products from the the JTB product line.
The management team responsible for the Product and Services Division’s development, and hands-on management of the daily operations are Mitchell R. Jeremy and Rachel L. Jeremy. In addition, a team-oriented, customer-focused staff of 3 will support the management team. JTB Products and Services, Inc. will retain the services of a CPA firm to perform professional company audits, prepare taxes, payroll and serve as a business consultant to assist in setting achievable long-range strategic goals.
Based on the current prices in the Products and Services market, JTB Products and Services, Inc. has the potential of making sales of $348,000 within the first eighteen months of operation. With good management, a revenue growth of approximately 24.53% percent is expected. The projected ratios at the end of Fiscal Year 2 are quite solid.
The equity for each investor will be based on his or her investment. An in-depth look at Ratios can be found the Financial Plan section.
Our primary markets are:
- Auto repair, and Automotive industries. (JTB Tools)
- Commercial and Private Utility contractors. (JTB hole-making products and services)
- Sporting Goods Industry. (JTB drills, and drill refurbishing services)
- Metalworking and Manufacturing industries as a service provider.
Ways to minimize risk factors to JTB Products and Services, Inc.’s success include:
- Obtaining sufficient capital to properly fund the project to completion.
- Maintain a lower than projected overhead which increases the bottom line profit. Multi-skilled personnel will be employed, management will provide a continual training program will ensure they deliver consistent superior service, as customer satisfaction is a high priority goal to developing the business.
- Build a sufficient customer base. An excellent location has been determined by demographics, and an aggressive marketing program by a full-time shared marketing associate will ensure the desired results.
- Establish community involvement to demonstrate how the business will contribute to a better quality of life. Community projects using the company facilities will be developed to help civic groups obtain their financial goals. Schools, churches, and other groups will be welcomed to reach out to the company and its employees for fundraisers.

1.1 Objectives
- Integrate our products and services into the Industrial Distribution market.
- Direct-market our own product lines to over 100,000 potential clients throughout the U.S.
- Utilize our Business Technology Software to gain market share.
- Provide our clients with quality products and services while maintaining high profitability.
For many years, we have seen a niche in helping the above mentioned businesses with their production processes, external job costing, and expediting the above services. These services are handled in a one on one fashion, the clients process for using the various products is reviewed, then a recommendation is made to either scrap, rebuild or replace the items in question. Also at this point we can recommend one of our distributor partner products as a substitute.
JTB Products and Services, Inc. will be a partner in the JTB network, and will also use this network to promote its products and services throughout our industrial distribution partners.
1.2 Mission
JTB will develop and offer only the highest quality products and services.
- Our products will reduce customers’ costs, and have a longer life than the competitors’ products.
- Our re-manufacturing services will also offer the client a solid, value-based purchase backed by a 100% quality commitment and effort by our employees and management.
Using JTB own manufacturing facility as a model and test bed for our products, JTB will provide the mid-sized corporate market with new and exciting ways to cost effectively manage all external vendor and customer transactions, yielding continual savings for the users of our products and services. Our manufacturing partners will also add value to our offering of services, further allowing JTB to grow into a high-quality, long-term growth corporation.
1.3 Keys to Success
- Seasoned management with over twenty years of business experience in Industrial Distribution and Metalworking.
- Focused and well-defined long-range goals for longevity. Our plan has been developed to allow flexibility and growth.
- Strong project-management staffing with extensive prior Engineering experience, providing clients with product and service support in an industrial setting.
- Strong marketing goals with niche products and services; targeted services and products delivered with unique marketing approaches.
- Very low internal development costs at startup. Management is well-suited to oversee and develop all projects described in this business plan, limiting pre-production expenses by utilizing industry partnerships to lower the initial costs to bring its services and products to market.
- Previous base of high-quality external support vendors available to build on, with over twenty years of industry contacts to work with, in both the purchasing of quality products, and also in the marketing of our own products.
- Previous successful business plans and experience to draw from. Management’s previous business plan helped in closing an SBA package valued at $240,000 for the acquisition of C.N.C manufacturing equipment. Management will implement and perfect all aspects of the business plan, expecting that a great deal of its own creativity, positive attitude, and energy will be brought into all of the required projects.
Company Summary
JTB Products and Services is one of the three sub-divisions of JTB Technologies, Inc.
JTB Technologies, Inc. will be located in Richfield, Louisiana. This location is very close to the I-82 corridor, providing excellent access to the Mississippi, Arkansas and Texas industrial markets. JTB management acquired its roots in the industrial marketplace while managing RL&I Tool and Machine, Inc., a privately held corporation that operated in Missouri for over twenty-five years.
Further experience was also acquired while managing RL&I’s industrial supply division of RL&I Tool and Machine. Eventually the Missouri corporation was closed and the management shown in this plan relocated here to Louisiana. Prior to leaving Missouri, Technical Marketing Technologies LLC, a spin-off of the Missouri based corporation was established, and operates as a sole proprietorship here in Louisiana. With our roots firmly planted in the Industrial marketplace, JTB will provide Industrial and Commercial Tools, Safety Products, and Engineered Sales expertise.
The primary partners in this plan are responsible for all phases of business and product development with special emphasis on bringing the latest Machining and Computer design into the business. With our roots firmly planted in the products and services market, JTB will provide Industrial and Commercial Tools, Re-manufacturing Services and engineering expertise acquired over the last twenty-five years while working with the following business types:

- Automotive – Automotive repair, and Auto body industry.
- Automotive – Auto Makers, and their support industries.
- Primary Metals – Machining Industry – Turbine, Valve, Specialty Manufacturers, and Machining industries.
- Sporting Goods Industry – Sporting Goods manufacturers, and Services industries.
- Mining and Contractor Industry – Hole drilling and Utility service providers
In addition to providing these clients with industrial products, JTB will also provide technical expertise, engineering assistance and all types of outsourced industrial services.
2.1 Company Ownership
JTB will be a privately held corporation co-owned by Rachel L. Jeremy and her husband, Mitchell R. Jeremy. Rachel Jeremy has 10 years experience in production management, and customer services acquired while she worked with RL&I Tool and Machine, Inc where she was also the Secretary for that corporation. Rachel will also add a large percentage to the minority owned shares, allowing the firm to participate in larger contracts requiring minority involvement.
Mitchell R. Jeremy owns and operates Technical Marketing Technologies LLC, a technology and marketing consulting firm. Mr. Jeremy is an innovator with over 25 years of technical experience in the Industrial market with an additional 15 years of integrating computers and other technologies into the manufacturing and distribution of industrial products. Mr. Jeremy has a proven track record of success in launching new business projects and directing operations for a previous Missouri-based corporation as President of RL&I Tool and Machine.
To achieve our objectives, Mr. Jeremy is seeking $230,000 in investment and $45,000 in long-term loans for JTB Products and Services. A percentage of the stock and royalties of its products will be offered to the initial investors.
2.2 Start-up Summary
Initial startup will consist of setting up the equipment, shipping area, and Inventory areas in the 2,500 sq. ft. of production space described, with provisions for further expansion when needed.
Once established, Mr. Jeremy will utilize all of his previous business contacts to develop the JTB’s products for immediate resale. This will include several custom catalog offerings with over 50,000 products each. As many of the customers require similar products sold by the Industrial Sales Division, a stock list will also be compiled of the major items to be offered adding more customer support value to the business.
In the production area, we will add approximately $45,000 of machinery, allowing the firm to produce its products and services. Further leased equipment will be added starting in the first month of the plan. This equipment will be both manually operated and computer controlled, depending on availability. At present the machine tool market has an excess of available equipment which is driving the costs to purchase these items down considerably. Included in this amount is $30,000 of specialty prototyping equipment which will allow us to solicit specialty prototype work.
We intend to add 3 Service Team Members to be trained on the equipment, and handle order processing with our intended local customer base. Rachel Jeremy will oversee the production and shipping aspects. Mr. Jeremy will oversee training, and make personal contact with all potential clients to develop long term solid relationships.
During this time, several developers will be hired as part of the JTB Integrated Technologies Division, located in the same facility as Industrial Sales, to begin development of the software to later drive the inventory-sharing and customer-interactivity aspects of the business. (Payroll and income figures related to these portions of the plan can be found in the JTB IT Division business plan.)
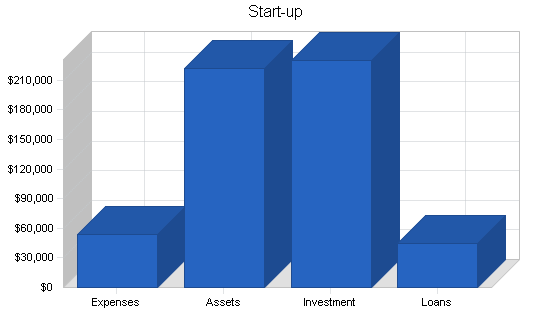
| Start-up Funding | |
| Start-up Expenses to Fund | $53,350 |
| Start-up Assets to Fund | $221,650 |
| Total Funding Required | $275,000 |
| Assets | |
| Non-cash Assets from Start-up | $51,000 |
| Cash Requirements from Start-up | $170,650 |
| Additional Cash Raised | $0 |
| Cash Balance on Starting Date | $170,650 |
| Total Assets | $221,650 |
| Liabilities and Capital | |
| Liabilities | |
| Current Borrowing | $0 |
| Long-term Liabilities | $45,000 |
| Accounts Payable (Outstanding Bills) | $0 |
| Other Current Liabilities (interest-free) | $0 |
| Total Liabilities | $45,000 |
| Capital | |
| Planned Investment | |
| Investor 1 | $230,000 |
| Other | $0 |
| Additional Investment Requirement | $0 |
| Total Planned Investment | $230,000 |
| Loss at Start-up (Start-up Expenses) | ($53,350) |
| Total Capital | $176,650 |
| Total Capital and Liabilities | $221,650 |
| Total Funding | $275,000 |
| Start-up | |
| Requirements | |
| Start-up Expenses | |
| Legal | $1,200 |
| Patent process | $18,000 |
| Stationery etc. | $450 |
| Brochures | $4,500 |
| Demo Models | $1,200 |
| Consultants | $6,000 |
| Insurance | $750 |
| Rent | $750 |
| Research and Development | $18,000 |
| Office | $2,500 |
| Total Start-up Expenses | $53,350 |
| Start-up Assets | |
| Cash Required | $170,650 |
| Start-up Inventory | $1,000 |
| Other Current Assets | $5,000 |
| Long-term Assets | $45,000 |
| Total Assets | $221,650 |
| Total Requirements | $275,000 |
Products and Services
JTB Products and Services will provide the following:
- Manufacturing of patented products from the JTB line of Automotive tool products.
- Manufacturing of patented JTB – Commcut-commercial waterline hole tools.
- Manufacturing of patented JTB – Sportcut drill system for the sports industry.
- Providing reconditioning for the Commcut commercial waterline tools.
- Providing reconditioning for the Sportcut drill system for the sports industry.
- Providing reconditioning of industrial tools sold by JTB Industrial Sales.
- Prototype building from clients’ CAD drawings.
With the proper mix of equipment, JTB can work as both a manufacturer and a service provider, repairing its own products and its competitors products as well. Additionally, the equipment gives the business an opportunity to sell itself to its clients at the production managers level and at the shop level, forging solid ties with production and engineering managers.
Our prototype services will be handled via the Internet: a client sends a CAD file to our secure dedicated servers, we download the CAD file into the 3-D software, and the process of developing a tangible prototype begins. Including this type of technology will bring JTB much closer to the Aerospace and Automotive industries. This process can also help JTB develop additional products for different markets. Related engineering technology will consist of 3-D Computer Aided Design where applicable in the prototype work.
The mix of JTB’s Industrial Sales and Products and Services Division makes the actual sale, as the business can respond to the clients in any way needed. Our ability to share information about order status and offer products and service from our distributor partners will allow for even more opportunity with the clients, as they are always looking for ways to reduce purchasing costs.
3.1 Competitive Comparison
Why should the industrial buyers work with JTB Products and Services?
JTB’s products are developed to perform better than the competition. Our products are developed with the goal of providing our clients a good, value-based purchase that will help them be more profitable in their day-to-day operations. Our commitment to high quality and consistency in our products and services is what sets us apart from others.
Our services also combine a good value-based approach, and still provide quality. Our attention to customer detail is a critical component in our customer service area. Our custom sales software allows our staff to keep detailed, accurate notes on our customers’ requirements, allowing us to fulfill orders to their preferences. This commitment to consistency allows the customer to feel confident when they ship orders in for service.
3.2 Future Products and Services
JTB will methodically seek out additional products to match our customers’ requirements while working closely on applications to provide our clients with a better overall result in their manufacturing process.
In particular, we will add products to our own lines, and develop a sales strategy around each product. The additional products and services will likely come from our distributor partners, allowing us to develop quality product and service offerings. Our distributor partners can also produce private label products for us.
Further development on this strategy will come from our engineering software applications. These applications will allow us to work one on one with plant application engineers to fine tune products to maximize the product’s life, yielding the best possible results.
Market Analysis Summary
National market Description consists of 314,555 potential clients in the following categories:
- Aerospace Industry – High Tech Manufacturers, and supporting sub-industries
- Automotive – Automotive repair, and Auto body industry.
- Automotive – Auto Makers, and their support industries.
- Primary Metals – Machining Industry – Turbine, Valve, Specialty Manufacturers, and Machining industries.
- Sporting Industry – Sporting Goods manufacturers, and Services industries.
- Mining and Contractor Industry – Hole drilling and Utility service providers
The Louisiana Market consists of 4,553 potential clients in the same categories.
Our sales goal is to integrate our Industrial Products and Services into the above markets. Our sales approach is simple, utilizing a well trained inside sales staff to approach new clients, and to respond to well-placed ads in industrial publications. Our software applications will make it possible for these businesses to interact closely with JTB and its distributor partners.
4.1 Market Segmentation
- Our customers are seeking cost reduction in their daily operations. As JTB will function as a distributor and a service provider, we can deliver custom specialty products faster, with fair, competitive prices.
- All of the above markets are seeking longer product life, resulting in higher profitability. Our overall experience in machining, grinding, and production management can provide our clients with actual measurable results.
- All market segments purchase similar products and services, consolidating our internal purchasing and marketing costs, maximizing long range profitability, while reducing external costs as we gradually implement our order placement systems.
- All can be serviced via existing modes of transportation (UPS, Fedex, DHL).

| Market Analysis | |||||||
| Year 1 | Year 2 | Year 3 | Year 4 | Year 5 | |||
| Potential Customers | Growth | CAGR | |||||
| Aerospace, High Tech manufacturing | 3% | 25,587 | 26,355 | 27,146 | 27,960 | 28,799 | 3.00% |
| Automotive, Repair, Autobody | 9% | 61,228 | 66,739 | 72,746 | 79,293 | 86,429 | 9.00% |
| Automotive, Auto makers, support sub-industry | 2% | 4,000 | 4,080 | 4,162 | 4,245 | 4,330 | 2.00% |
| Primary Metals, and Machining industry | 7% | 210,000 | 224,700 | 240,429 | 257,259 | 275,267 | 7.00% |
| Sporting Goods and related services | 7% | 6,058 | 6,482 | 6,936 | 7,422 | 7,942 | 7.00% |
| Mining, and Contractor industry | 9% | 3,149 | 3,432 | 3,741 | 4,078 | 4,445 | 9.00% |
| Total | 7.06% | 310,022 | 331,788 | 355,160 | 380,257 | 407,212 | 7.06% |
4.2 Target Market Segment Strategy
Our marketing strategy for each target market segment will vary slightly. We will focus our direct marketing efforts on the Aerospace, Automotive, and Primary Metals and Machining industries, introducing these clients to our products and services. In particular, our combination of over 300,000 catalog items, and our industrial services, providing re-manufacturing and secondary services, will allow us to sell ourselves in many different ways. Also, our base of sub-contract service providers will allow us to offer many different programs via our distributorship.
When order management and inventory systems are completed by the Integrated Technologies Division, they will make it faster and easier to place repeat orders. Special incentives will be given to the businesses using the system as well, further reducing our external costs.
4.3 Service Business Analysis
JTB products and services are focused on some rather unique markets. As such, these markets are supported by niche product and service providers all over the U.S.
Industry by count:
- Auto Body clients available: 62,361
- Commercial utilities and drilling services available: 3,200
- Sporting Good Service Centers: 6,164
- Metalworking and Manufacturing: 238,764
The above client numbers are based on data available from Hugo Dunhill Mailing Lists, Inc., our preferred database provider. Larger firms like Peoplesoftware, Profit2100, Dimasystems, and Net2soft have developed very expensive software and netware packages starting at $10,000 – $50,000 and up. Our cost analysis has shown that there are many cost competitive options available for businesses to choose from, in many cases they are simply unaware they are available. As a service business that will utilize our own products, we can market and demo our products simultaneously, further reducing our costs per solicitation.
4.3.1 Competition and Buying Patterns
Automotive clients: These clients are made up of individual auto repair businesses. They purchase supplies via local suppliers and catalogs. Our products for this market are specialized time savers, and will be marketed as such. Also, our industrial sales division can sell to these clients via catalogs and through our online sales process. Competition in this marketplace is well developed as local suppliers providing standard products, our unique lines will be directly marketed to the shops, along with information about our industrial supply services.
Commercial Utilities and Drilling clients: These clients are made up of individual commercial service providers and contractors providing hole drilling services. Our process for re-manufacturing / re-building their drilling units will better the OEM’s efforts to make and sell a quality tool. The base cost index for these tools is very high, typically in excess of $2675 per unit. These clients generally pay a minimum of 50% for a rebuild. Competition in this marketplace is developed as commercial plumbing supply houses; typically, the client is on their own in terms of technical help. Our unique cost saving rebuild process will be directly marketed to them, also our industrial sales division can service these clients as well.
Sporting Good Service Centers: These clients are made up of bowling suppliers. Our patented products will out-perform any available products, and create a large re-conditioning market for JTB, as our patented products can only be reproduced by us. Competition in this marketplace is not very strong, as no one has developed a product for this process, nor has there been any standardization for this process. Our Max-Drill product line re-defines the process giving the shops a place for technical help, good service, and a product that provides ease of use, and a very cost-effective process.
Metalworking and Manufacturing: These clients are made up of Machine shops, Aerospace Manufacturers, and other specialty manufacturers requiring industrial products and services. Our services department will add value and services to Rachel industrial sales division, as it can utilize the services division’s equipment to provide its clients with custom solutions. Competition is strong, as these clients work with both local suppliers, and catalog companies. As JTB has a very marketable mix of industrial sales, and industrial services, this will provide the added edge to acquire clients.
4.3.2 Distributing a Service
JTB’s primary goal is focused on developing one-on-one business relations during the first four years of the business plan; however, beyond that, we may consider working through distribution for additional business.
As our plan describes our primary goal of repayment to our initial investors by the fourth year, we will not make arrangements for distribution of our products or services unless it represents a major addition to the business, and maintains our projected profits as well.
Strategy and Implementation Summary
Our strategy and implementation will be a very straightforward approach to extending our products and services to potential clients via every cost-effective approach possible. Our combined services offering is very unique, and allows for more profitability while staying ahead of other industrial distributors and services providers in terms of delivery and competitive pricing. The combination of our distributorship’s solid inventory, and the ability of the service area to provide re-conditioning and special services to industrial products quickly, allows for faster shipments with fewer logistical problems. For our customers, this means lower costs.
Presently, the local industrial suppliers and service providers do not really provide an effective combination of supplying a cost-effective service strategy that yields the customer any real savings. The local distributors must also rely heavily on outsourcing for many of their services, which drives up the shipping costs to the customer dramatically. This business plan allows for low-cost implementation of Internet-based customer access, as well as direct marketing where needed. The plan also focuses on the needs of our clients, working within particular parameters that permits the business to respond to small and large clients equally efficiently.
5.1 Competitive Edge
Our competitive edge is our combined services, products, and the engineering skills required to properly interact with our customers and vendors. Our mix of inventory, industrial distribution, and the service capabilities to respond to the customer’s needs quickly will make JTB a respected vendor in the industry.
JTB’s competitive edge incorporates an overall approach to market our goods and services to many different industries. Our unique approach of developing our own branded sales and marketing applications will strengthen our ties to our distributor partners and direct clients. As computer networking is a strong area for me personally, I see the benefits to businesses that have solid network based sales and marketing tools in place. Our overall goal is to utilize our own applications and developed software to integrate our distributor partners services. When completed, JTB will be able to offer much larger clients an extremely large variety of products and services drawing from our distributor partners services and products.
All of the JTB divisions will benefit from the marketing, strategic ad placements and the direct marketing products offered by every other JTB division.
5.2 Marketing Strategy
Key Goals to our marketing strategy are as follows:
- Develop a high profile sales environment, to bring our products to new and existing clients.
- Develop new ways to market our products to potential clients via our branded applications and software.
- Develop channel partnerships utilizing our own applications, drawing from these partners services and products to develop a large base of products and services to be offered to larger clients.
- Develop and maintain a quality customer service and follow-up program for all of the JTB divisions.
- Develop and utilize an ongoing automated marketing system to contact potential clients.
- Carefully target marketing expenditures to maximize returns on the campaigns.
5.2.1 Marketing Programs
JTB’s marketing programs will directly target our intended customer base, utilizing many different avenues of marketing. Initially, we will mass-market introductory offers and letters of introduction indexed against our customer database. Further secondary marketing will be through our Internet-based marketing systems. Additional follow-up work will be done by our staff.
JTB’s customer databases will overlap as they are similar. Every opportunity will be explored as each branch solicits new business, allowing for additional cost effective introduction of our other products and services. JTB will also develop Internet marketplaces where our products and services can be marketed as well, taking full advantage of the very low costs offered by developing and managing our own sites.
5.3 Sales Strategy
JTB’s sales strategy will rely on a straight-forward approach of developing the company’s long term sales goal of providing quality engineered products and services tailored to the customer. Our overall goal will be to pay close attention to details gathered regarding other vendors, and how they interact with the clients, constantly fine tuning our transaction process until it is almost effortless for the clients to do business with us.
Customer access to our sales staff is also critical, as we intend to offer phone, fax, and Internet-based inventory access and order processing. Further Internet access on our main site will let clients develop budgets and gather engineering information about the products we offer. This will be further enhanced by the custom software products of JTB Integrated Technologies, when developed. Our sales staff will have a tremendous source of information available to act as an advisor to our clients.
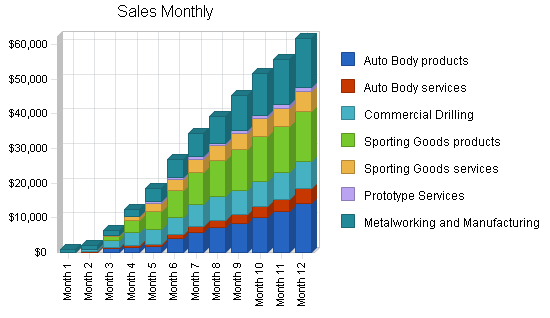
5.3.1 Sales Forecast
Our sales forecast table uses the following assumptions:
- Auto Body Products average growth rate of 34% annually.
- Auto Body Services average growth rate of 14% annually.
- Commercial Drilling average growth rate of 22% annually.
- Sporting Goods Products average growth rate of 19% annually.
- Sporting Goods Services average growth rate of 17% annually.
- Metalworking and Manufacturing growth rate of 18% annually.
- Industry Analysis Compounded Annual Growth Rate of 7.02%
The sales growth is controlled by several factors including:
- The JTB’s ability to find quality service associates to train, and the length of the training process.
- JTB’s ability to partner with other quality channel partners to handle over capacity situations.
- Limitations in actual shop time available ie. constraints in available work area and personnel.
Many of the services provided are billable hourly at nearly $60 per hour for service work; in comparison, some products manufactured internally will need to be at a lower shop rate to provide for more competitive pricing to break into the different markets.
We will work to have many of the patented products manufactured externally, allowing our equipment to be utilized on more profitable work. Contingencies need to be in place to backup all products and services offered in the event of personnel issues, or equipment failure. Direct costs in the Sales Forecast table reflect these outsourced manufacturing costs, after initial design.

| Sales Forecast | |||||
| Year 1 | Year 2 | Year 3 | Year 4 | Year 5 | |
| Sales | |||||
| Auto Body products | $66,000 | $90,520 | $122,234 | $139,846 | $166,212 |
| Auto Body services | $20,205 | $23,842 | $28,133 | $33,197 | $39,173 |
| Commercial Drilling | $57,880 | $71,771 | $88,996 | $110,355 | $136,841 |
| Sporting Goods products | $89,800 | $109,556 | $133,658 | $163,063 | $198,937 |
| Sporting Goods services | $35,820 | $43,700 | $53,314 | $65,044 | $79,353 |
| Prototype Services | $7,200 | $28,800 | $43,200 | $54,000 | $72,000 |
| Metalworking and Manufacturing | $77,800 | $93,360 | $132,032 | $164,438 | $210,326 |
| Total Sales | $354,705 | $461,550 | $601,569 | $729,944 | $902,842 |
| Direct Cost of Sales | Year 1 | Year 2 | Year 3 | Year 4 | Year 5 |
| Auto body products and Services | $43,546 | $48,635 | $55,751 | $69,849 | $86,067 |
| Commercial Drilling | $37,939 | $39,267 | $50,020 | $58,800 | $74,633 |
| Sporting Goods | $62,388 | $73,440 | $89,520 | $110,880 | $133,920 |
| Prototype Services | $1,908 | $7,632 | $11,448 | $14,310 | $19,080 |
| Metalworking and Manufacturing | $53,270 | $61,000 | $73,000 | $89,000 | $106,000 |
| Subtotal Direct Cost of Sales | $199,051 | $229,974 | $279,739 | $342,839 | $419,700 |
5.4 Strategic Alliances
JTB will develop and implement many strategic alliances to build its product and services offering. Alliances to manufacture our higher volume products will aid in keeping our internal costs in check while allowing unlimited growth potential by utilizing our channel partners’ production capabilities. Further development on this will be to purchase on a contractual basis to help lock in pricing on our product offering. Our distributor partners will allow us to offer additional products and services that we could not otherwise offer, also reducing our investments in additional personnel and equipment while maximizing profits.
5.5 Milestones
Secure Leasing, Banking, and Attorney Arrangements – Long term arrangements to secure the equipment financing, banking relations, and general and patent attorney needs.
Set up JTB’s Industrial Services Location – Prepare working area for incoming equipment, wiring, shipping and receiving areas, networked accounting systems, and develop a work flow methodology for the entire shop.
Complete the equipment selections and installation – Equipment will be selected from various machine tool dealers throughout the U.S. These machine tools will be inspected closely for quality, selecting the best possible pieces while working within our budget.
Manager selections and training begins – JTB will be looking for individuals who posess a good aptitude for engineering, preferably with a background in QC and Machining.
Contractor selection for outsourced manufacturing – Competing contract manufacturers will be providing sample parts and quotations for our products, in particular, contractors will be quoting on the Automotive and Sporting Goods lines as they have the highest potential volume and will require substantially more manufacturing capacity than we will have available.
JTB Industrial Services Marketing Campaign – Our marketing campaign will initially target the local Louisiana market with a letter to the key personnel within the target businesses. This introduction will be a combination letter marketing the JTB Industrial Sales Division as well; alternately, the Industrial Sales Divisions sales personnel will follow up on these accounts.
JTB outsourced product line development – Once the contractor selection is complete, we will place orders from the suppliers for components, packaging, and replacement parts.
JTB services development – JTB’s service area will begin servicing clients as soon as the core machine tools are in place; some specialty equipment may take several months to locate. During the first year, management will be processing most of the work.
JTB Service associate selection and training – Service Associates will be from a production background, familiar with manufacturing and general machining, training will be ongoing for at least 1 year. Management will work with these individuals on a one-on-one basis to accomplish this, and minimize training costs while still competing orders as needed.

| Milestones | |||||
| Milestone | Start Date | End Date | Budget | Manager | Department |
| Secure Leasing and Banking Arrangements | 2/1/2005 | 2/15/2005 | $1,500 | M. Jeremy | Corporate Management |
| Setup JTB’s Industrial services location | 2/1/2005 | 3/1/2005 | $6,500 | M. Jeremy | Corporate Management |
| Contractor selections for services and products | 2/15/2005 | 3/15/2005 | $3,500 | M. Jeremy | Media development |
| Manager selections and training begin | 2/1/2005 | 4/15/2005 | $12,000 | R. Jeremy | Corporate Management |
| Complete equipment selections and installations | 2/1/2004 | 6/15/2005 | $125,000 | M. Jeremy | Corporate Management |
| JTB outsourced Product line development | 3/15/2005 | 6/15/2005 | $18,000 | M. Jeremy | Products and Services |
| JTB Service Associate selection and training | 3/10/2005 | 10/1/2005 | $15,000 | R. Jeremy | Products and Services |
| JTB Services development | 4/15/2005 | 1/1/2006 | $7,500 | R. Jeremy | Products and services |
| JTB Industrial Services Marketing campaign | 3/1/2005 | 1/30/2006 | $3,500 | R. Jeremy | Marketing |
| Totals | $192,500 | ||||
Web Plan Summary
JTB’s Web-based marketing plan is essentially the same for all of the JTB divisions, with the exception of how each division targets its clients. As JTB will be able to add its services offering into the marketplaces to be developed, we will get day to day information and feedback from the various paid ads we place in industrial trade magazines, and with other websites as well. The Web plan is to link our products and services with as many affiliate sites as possible.
When established, these marketplaces and affiliate sites will serve as a very cost effective marketing tool for all of the JTB divisions, again keeping in mind that each division’s approach to this will be tailored towards its intended potential clients. Each division will have dedicated websites operating under the JTB logo. With a customer database available at all times via our servers, we can easily track our marketing expenditures and customer demographics.
6.1 Website Marketing Strategy
JTB will develop and manage as many industrial marketplaces as possible, seeking out niche marketing that drives customers to our industrial products and services sites. Also, JTB will embed itself into many other sites utilizing search engine technology, affiliate marketing programs, and paid banner ads.
As JTB’s Integrated Technologies Division will develop all of its sites and software applications, this will be done at a considerably lower overall cost than our competitors would spend to develop the same type of applications.
Management Summary
Operations Manager
Mitchell R. Jeremy
Mitchell will work with the managers and staff daily to help oversee the development for all of the anticipated projects. He will personally develop the procedures and techniques for all of the products and services to be offered. Additionally, he will provide hands on training to all employees within the company ensuring the company’s ability to grow.
Service and Production Manager
Rachel L. Jeremy
During year one Rachel will act as the Service Team Manager. She will oversee order processing, scheduling of outsourced orders, and act as the general business manager in Mr. Jeremy’s absence. After year one, the service team members and manager will be fully trained to handle the day-to-day workload in their area. Rachel will then continue to maintain the ongoing day-to-day work schedule, track time and billing issues, and remain in close contact with the clients to ensure that JTB is meeting all the customer’s requirements.
7.1 Personnel Plan
Service Team Manager
Initially, Rachel Jeremy will fill this role, while the service team manager undergoes training. The service team manager is a working manager position requiring complete knowledge of all the manufacturing processes. This position will answer directly to the Operations Manager.
Service Team Member
TBA. Service Associates will perform the manual labor required in the service and production department.
Sales and Marketing Associate
TBA. This is a shared position, costs and responsibilities distributed among all divisions; this member contributes Sales and Marketing help in all areas.
| Personnel Plan | |||||
| Year 1 | Year 2 | Year 3 | Year 4 | Year 5 | |
| Production Personnel | |||||
| Service Team Manager | $35,200 | $36,000 | $36,000 | $38,000 | $38,000 |
| Service Team Member | $8,800 | $21,000 | $23,000 | $25,000 | $28,000 |
| Subtotal | $44,000 | $57,000 | $59,000 | $63,000 | $66,000 |
| Sales and Marketing Personnel | |||||
| Shared Marketing Associate | $2,750 | $4,000 | $6,000 | $8,000 | $10,000 |
| Name or Title | $0 | $0 | $0 | $0 | $0 |
| Other | $0 | $0 | $0 | $0 | $0 |
| Subtotal | $2,750 | $4,000 | $6,000 | $8,000 | $10,000 |
| General and Administrative Personnel | |||||
| Production Manager/Service Team Coordinator | $43,200 | $43,500 | $44,000 | $45,000 | $45,000 |
| Name or Title | $0 | $0 | $0 | $0 | $0 |
| Other | $0 | $0 | $0 | $0 | $0 |
| Subtotal | $43,200 | $43,500 | $44,000 | $45,000 | $45,000 |
| Other Personnel | |||||
| Name or Title | $0 | $0 | $0 | $0 | $0 |
| Name or Title | $0 | $0 | $0 | $0 | $0 |
| Other | $0 | $0 | $0 | $0 | $0 |
| Subtotal | $0 | $0 | $0 | $0 | $0 |
| Total People | 4 | 4 | 4 | 4 | 4 |
| Total Payroll | $89,950 | $104,500 | $109,000 | $116,000 | $121,000 |
Financial Plan
JTB’s financial plan is based on raising $230,000 by way of private equity to setup the industrial products and services division of the corporation. We are also securing a 12 year loan for $45,000 to cover initial equipment costs necessary to produce our products and services. We expect the Product and Service Division to achieve a small net profit in just over two years.
By year three we expect to be in a strong enough cash position to begin paying dividends to the initial investors, and secure proper lines of credit with other banking resources as the company will need to attract further investment for equipment and expansion. It would be in the company’s best interest to repay the initial investors earlier than the plan allows for.
8.1 Important Assumptions
This plan is one of a three part business plan providing details of each business segment for more accurate projections, the main plan is used to show the overall development of the business in its entirety. Key assumptions around which we developed this plan are as follows:
- Current business, banking, and economic trends continue to be stable.
- Customer buying trends and orders remain strong.
- Overhead and other external operating cost grow as projected.
- External outsourced costs grow as anticipated.
- Internet buying trends continue to grow in the industrial sector.
The General Assumptions table below shows assumptions which play heavily into the businesses long term plan.
If the business can be developed in its entirety in one location would greatly reduce operating costs, and provide a more flexible staff situation for cross-training and other issues.
Upon reviewing the plan, you may have noticed management has mentioned expansion through use of its online marketing system via numerous distributor partners throughout the U.S. The possible revenues from this have not been added into any projections. Management’s position on the plan’s assumptions is we feel we can make better long term arrangements which should better the projected cash position shown.
Note 8.1.1: We have selected a high-quality networked accounting system with capabilities of having multiple businesses running while still offering full consolidation of the business for accounting purposes. This system is complete with project management capabilities and budgeting; as such, management will implement a budgeted approach for the projects while adjusting costs in JTB’s favor wherever possible.
All Profit and Loss tables in this plan include only the projections for the Products and Services Division. We suggest that each plan is reviewed, as each is quite different.
| General Assumptions | |||||
| Year 1 | Year 2 | Year 3 | Year 4 | Year 5 | |
| Plan Month | 1 | 2 | 3 | 4 | 5 |
| Current Interest Rate | 10.00% | 10.00% | 10.00% | 10.00% | 10.00% |
| Long-term Interest Rate | 10.00% | 10.00% | 10.00% | 10.00% | 10.00% |
| Tax Rate | 30.00% | 30.00% | 30.00% | 30.00% | 30.00% |
| Other | 0 | 0 | 0 | 0 | 0 |
8.2 Break-even Analysis
The break-even analysis for JTB Products and Services is shown in the following table and chart.
JTB’s break even analysis is difficult to project as our industrial products and services are a mix of both labor charged hourly, and outsourced manufactured goods for resale. Initial goals are to bring the hard manufactured product lines to market within 60 days from startup. Additionally, we will begin completing service based orders (labor based) immediately while offering numerous well accepted industrial products for resale through the other divisions.
What will set JTB apart from the other industrial entities is its ability for flexibility, expansion, and its individual divisions with key individuals all under one roof targeting each market segment JTB will pursue. All of the service personnel will be cross-trained with the sales staff, and will be expected to handle clients with a positive and helpful attitude. With this in mind, the goal is to build a solid base for the corporation with our primary products and services while continuing the long term development of our distribution and secondary services business.

| Break-even Analysis | |
| Monthly Revenue Break-even | $31,884 |
| Assumptions: | |
| Average Percent Variable Cost | 69% |
| Estimated Monthly Fixed Cost | $10,036 |
8.3 Projected Profit and Loss
Please be sure to read the note in the Important Assumptions section, regarding our Accounting system and methodology.
The Projected Profit and Loss table takes into consideration all of the basic operating costs for the Products and Services Division only. This division will reach the break-even point late in the first year, and become increasingly profitable thereafter. At full capacity in later years, we expect net profit margins between 12% and 19%.
The Profit and Loss in this business plan also includes a full depreciation schedule. Management’s eventual goal is to work with a leasing company that will provide a construction-type loan/lease situation allowing us time to hand-select the best possible equipment while minimizing the cash outlay during this process. For the purposes of this plan, and to maintain a conservative approach, we have bought some starting equipment as long-term assets in the start-up table. We will add some leased equipment as we go, as initial equipment depreciates.
The Profit and Loss table in this plan does not reflect the burden of management, and management’s output – related personnel costs can be found in the plan for the holding company, JTB Technologies, Inc. Please remember when you do review the P&L, that the 3 JTB divisions will actually be operating under one roof. As such, overhead is low, and management’s role will be to fill in, in all areas of production wherever needed to complete orders.
Management’s operating schedule will also be overlapped to “keep our doors open” more operating hours than any of the other 9 to 5 operations. Management anticipates running at least 50 hours per week allowing us to develop more business on the west coast.


| Pro Forma Profit and Loss | |||||
| Year 1 | Year 2 | Year 3 | Year 4 | Year 5 | |
| Sales | $354,705 | $461,550 | $601,569 | $729,944 | $902,842 |
| Direct Cost of Sales | $199,051 | $229,974 | $279,739 | $342,839 | $419,700 |
| Production Payroll | $44,000 | $57,000 | $59,000 | $63,000 | $66,000 |
| Other Costs of Goods | $0 | $0 | $0 | $0 | $0 |
| Total Cost of Sales | $243,051 | $286,974 | $338,739 | $405,839 | $485,700 |
| Gross Margin | $111,654 | $174,576 | $262,830 | $324,105 | $417,142 |
| Gross Margin % | 31.48% | 37.82% | 43.69% | 44.40% | 46.20% |
| Operating Expenses | |||||
| Sales and Marketing Expenses | |||||
| Sales and Marketing Payroll | $2,750 | $4,000 | $6,000 | $8,000 | $10,000 |
| Advertising/Promotion | $4,950 | $6,000 | $7,500 | $8,500 | $9,500 |
| Other Sales and Marketing Expenses | $0 | $0 | $0 | $0 | $0 |
| Total Sales and Marketing Expenses | $7,700 | $10,000 | $13,500 | $16,500 | $19,500 |
| Sales and Marketing % | 2.17% | 2.17% | 2.24% | 2.26% | 2.16% |
| General and Administrative Expenses | |||||
| General and Administrative Payroll | $43,200 | $43,500 | $44,000 | $45,000 | $45,000 |
| Sales and Marketing and Other Expenses | $5,400 | $7,200 | $8,500 | $9,500 | $10,200 |
| Depreciation | $7,750 | $7,750 | $7,750 | $7,750 | $7,750 |
| Rent | $8,400 | $8,400 | $8,400 | $8,400 | $8,400 |
| Equipment Lease | $35,988 | $35,988 | $35,988 | $35,988 | $35,988 |
| Utilities | $7,200 | $7,200 | $7,200 | $7,200 | $7,200 |
| Insurance | $4,800 | $5,400 | $7,200 | $9,000 | $9,600 |
| Payroll Taxes | $0 | $0 | $0 | $0 | $0 |
| Other General and Administrative Expenses | $0 | $0 | $0 | $0 | $0 |
| Total General and Administrative Expenses | $112,738 | $115,438 | $119,038 | $122,838 | $124,138 |
| General and Administrative % | 31.78% | 25.01% | 19.79% | 16.83% | 13.75% |
| Other Expenses: | |||||
| Other Payroll | $0 | $0 | $0 | $0 | $0 |
| Consultants | $0 | $6,000 | $6,000 | $6,000 | $6,000 |
| Other Other Expenses | $0 | $0 | $0 | $0 | $0 |
| Total Other Expenses | $0 | $6,000 | $6,000 | $6,000 | $6,000 |
| Other % | 0.00% | 1.30% | 1.00% | 0.82% | 0.66% |
| Total Operating Expenses | $120,438 | $131,438 | $138,538 | $145,338 | $149,638 |
| Profit Before Interest and Taxes | ($8,784) | $43,138 | $124,292 | $178,767 | $267,504 |
| EBITDA | ($1,034) | $50,888 | $132,042 | $186,517 | $275,254 |
| Interest Expense | $4,297 | $3,938 | $3,563 | $3,188 | $2,813 |
| Taxes Incurred | $0 | $11,760 | $36,219 | $52,674 | $79,408 |
| Net Profit | ($13,081) | $27,440 | $84,511 | $122,906 | $185,284 |
| Net Profit/Sales | -3.69% | 5.95% | 14.05% | 16.84% | 20.52% |
8.4 Projected Cash Flow
JTB’s projected cash flow reflects the business’ cash position. Please remember when you review this table, it is for the Products and Services Division only. The table shows our planned repayment of the 12 year loan and dividends to investors beginning in year 3.
When reviewing the projected cash flow, its important to note that the largest growth in sales is from outsourced manufacturing, as this is not really segmented for review. Additional segmentation information can be found in the market segmentation table in section 4.1.
The outsourced manufacturing allows the company to have the product line it desires while utilizing its internal personnel one the more profitable services to be offered. The outsourced products operate under a fixed cost situation, while the services area will for the most part be working in a cost plus situation filling special and rush requests that carry a much higher shop rate. As the cash flow projects only the base products described in the business plan, its highly probable JTB will be involved with more outsourced products in years two through five, furthering our potential profitability.
Please review section 8.1 regarding the Important Assumptions to get a better feel for the explained projected cash flow.

| Pro Forma Cash Flow | |||||
| Year 1 | Year 2 | Year 3 | Year 4 | Year 5 | |
| Cash Received | |||||
| Cash from Operations | |||||
| Cash Sales | $88,676 | $115,387 | $150,392 | $182,486 | $225,711 |
| Cash from Receivables | $207,172 | $328,433 | $427,943 | $526,156 | $648,442 |
| Subtotal Cash from Operations | $295,848 | $443,821 | $578,335 | $708,642 | $874,153 |
| Additional Cash Received | |||||
| Sales Tax, VAT, HST/GST Received | $0 | $0 | $0 | $0 | $0 |
| New Current Borrowing | $0 | $0 | $0 | $0 | $0 |
| New Other Liabilities (interest-free) | $0 | $0 | $0 | $0 | $0 |
| New Long-term Liabilities | $0 | $0 | $0 | $0 | $0 |
| Sales of Other Current Assets | $0 | $0 | $0 | $0 | $0 |
| Sales of Long-term Assets | $0 | $0 | $0 | $0 | $0 |
| New Investment Received | $0 | $0 | $0 | $0 | $0 |
| Subtotal Cash Received | $295,848 | $443,821 | $578,335 | $708,642 | $874,153 |
| Expenditures | Year 1 | Year 2 | Year 3 | Year 4 | Year 5 |
| Expenditures from Operations | |||||
| Cash Spending | $89,950 | $104,500 | $109,000 | $116,000 | $121,000 |
| Bill Payments | $260,345 | $346,477 | $402,835 | $487,427 | $594,783 |
| Subtotal Spent on Operations | $350,295 | $450,977 | $511,835 | $603,427 | $715,783 |
| Additional Cash Spent | |||||
| Sales Tax, VAT, HST/GST Paid Out | $0 | $0 | $0 | $0 | $0 |
| Principal Repayment of Current Borrowing | $0 | $0 | $0 | $0 | $0 |
| Other Liabilities Principal Repayment | $0 | $0 | $0 | $0 | $0 |
| Long-term Liabilities Principal Repayment | $3,750 | $3,750 | $3,750 | $3,750 | $3,750 |
| Purchase Other Current Assets | $0 | $0 | $0 | $0 | $0 |
| Purchase Long-term Assets | $0 | $0 | $0 | $0 | $0 |
| Dividends | $0 | $0 | $20,000 | $50,000 | $80,000 |
| Subtotal Cash Spent | $354,045 | $454,727 | $535,585 | $657,177 | $799,533 |
| Net Cash Flow | ($58,197) | ($10,906) | $42,750 | $51,465 | $74,620 |
| Cash Balance | $112,453 | $101,547 | $144,298 | $195,763 | $270,383 |
8.5 Projected Balance Sheet
JTB Products and Services’ projected balance sheet shows a strong cash development capability over the projected 5 year plan. The projected balance sheet, like the rest of the business plan, assumes the business remains at its startup location during the first five years of operations, keeping costs relatively fixed for the projections. Again, as mentioned in the Important Assumptions section 8.1, management still feels it can develop a stronger situation than what is reflected.
As projected in the Balance Sheet, the products and services division builds its cash position while also developing a sound net worth. As the industrial Products and Services Division is a manufacturing setting, this business plan reflects the development of a large amount of hard, non-cash assets, excluding ending year 5 receivables. A full depreciation schedule and payment schedule is included to depreciate the long-term assets.
During the life of the plan, inventory requirements may change as we offer our clients different purchasing options and build our inventory of used products; any differences in cash flow and inventory would show that the cash is tied up in inventory. With this in mind, we would try to keep the required inventory down to reasonable levels wherever possible.
This division is also a service oriented segment of the business; many of the services offered are tied to particular product lines offered, allowing the business to create multiple income streams throughout the development of the plan. For segmentation purposes some products have both labor and materials to manufacture a product, some have labor only when providing a service. We have chosen not to show the breakdown of these finer details in the plan.
| Pro Forma Balance Sheet | |||||
| Year 1 | Year 2 | Year 3 | Year 4 | Year 5 | |
| Assets | |||||
| Current Assets | |||||
| Cash | $112,453 | $101,547 | $144,298 | $195,763 | $270,383 |
| Accounts Receivable | $58,857 | $76,586 | $99,820 | $121,121 | $149,811 |
| Inventory | $37,048 | $42,803 | $52,066 | $63,177 | $78,141 |
| Other Current Assets | $5,000 | $5,000 | $5,000 | $5,000 | $5,000 |
| Total Current Assets | $213,358 | $225,937 | $301,184 | $385,061 | $503,335 |
| Long-term Assets | |||||
| Long-term Assets | $45,000 | $45,000 | $45,000 | $45,000 | $45,000 |
| Accumulated Depreciation | $7,750 | $15,500 | $23,250 | $31,000 | $38,750 |
| Total Long-term Assets | $37,250 | $29,500 | $21,750 | $14,000 | $6,250 |
| Total Assets | $250,608 | $255,437 | $322,934 | $399,061 | $509,585 |
| Liabilities and Capital | Year 1 | Year 2 | Year 3 | Year 4 | Year 5 |
| Current Liabilities | |||||
| Accounts Payable | $45,789 | $26,927 | $33,663 | $40,636 | $49,625 |
| Current Borrowing | $0 | $0 | $0 | $0 | $0 |
| Other Current Liabilities | $0 | $0 | $0 | $0 | $0 |
| Subtotal Current Liabilities | $45,789 | $26,927 | $33,663 | $40,636 | $49,625 |
| Long-term Liabilities | $41,250 | $37,500 | $33,750 | $30,000 | $26,250 |
| Total Liabilities | $87,039 | $64,427 | $67,413 | $70,636 | $75,875 |
| Paid-in Capital | $230,000 | $230,000 | $230,000 | $230,000 | $230,000 |
| Retained Earnings | ($53,350) | ($66,431) | ($58,990) | ($24,480) | $18,426 |
| Earnings | ($13,081) | $27,440 | $84,511 | $122,906 | $185,284 |
| Total Capital | $163,569 | $191,010 | $255,520 | $328,426 | $433,710 |
| Total Liabilities and Capital | $250,608 | $255,437 | $322,934 | $399,061 | $509,585 |
| Net Worth | $163,569 | $191,010 | $255,520 | $328,426 | $433,710 |
8.6 Business Ratios
The following table shows standard business ratios for the years of our plan, and a comparison column for data from Manufacturing Industries, nec (SIC Code 3999).
JTB’s Products and Services Division’s ratios reflect a strong growth with regards to its Gross Margins.
In the long term, our Long Term Assets decline below industry profiles as equipment is paid down, but our overall Debt to Asset ratios are better than the industry in overall results as leaner manufacturing and better coordinated use of our channel partners come into play allowing for more growth without incurring additional expense.
Our General and Administrative ratios are much higher than the industry, but this personnel plays an essential role as the business grows towards its growth and outsourcing goals. Also the industry standard profile could reflect more automation than we have at this point, thus our requirement for more personnel.
| Ratio Analysis | ||||||
| Year 1 | Year 2 | Year 3 | Year 4 | Year 5 | Industry Profile | |
| Sales Growth | 0.00% | 30.12% | 30.34% | 21.34% | 23.69% | -0.33% |
| Percent of Total Assets | ||||||
| Accounts Receivable | 23.49% | 29.98% | 30.91% | 30.35% | 29.40% | 23.08% |
| Inventory | 14.78% | 16.76% | 16.12% | 15.83% | 15.33% | 15.97% |
| Other Current Assets | 2.00% | 1.96% | 1.55% | 1.25% | 0.98% | 34.94% |
| Total Current Assets | 85.14% | 88.45% | 93.26% | 96.49% | 98.77% | 73.99% |
| Long-term Assets | 14.86% | 11.55% | 6.74% | 3.51% | 1.23% | 26.01% |
| Total Assets | 100.00% | 100.00% | 100.00% | 100.00% | 100.00% | 100.00% |
| Current Liabilities | 18.27% | 10.54% | 10.42% | 10.18% | 9.74% | 23.82% |
| Long-term Liabilities | 16.46% | 14.68% | 10.45% | 7.52% | 5.15% | 17.66% |
| Total Liabilities | 34.73% | 25.22% | 20.88% | 17.70% | 14.89% | 41.48% |
| Net Worth | 65.27% | 74.78% | 79.12% | 82.30% | 85.11% | 58.52% |
| Percent of Sales | ||||||
| Sales | 100.00% | 100.00% | 100.00% | 100.00% | 100.00% | 100.00% |
| Gross Margin | 31.48% | 37.82% | 43.69% | 44.40% | 46.20% | 36.34% |
| Selling, General & Administrative Expenses | 39.96% | 31.88% | 29.64% | 27.56% | 25.68% | 17.49% |
| Advertising Expenses | 2.22% | 2.31% | 2.42% | 2.44% | 2.35% | 1.27% |
| Profit Before Interest and Taxes | -2.48% | 9.35% | 20.66% | 24.49% | 29.63% | 3.23% |
| Main Ratios | ||||||
| Current | 4.66 | 8.39 | 8.95 | 9.48 | 10.14 | 2.18 |
| Quick | 3.85 | 6.80 | 7.40 | 7.92 | 8.57 | 1.33 |
| Total Debt to Total Assets | 34.73% | 25.22% | 20.88% | 17.70% | 14.89% | 50.82% |
| Pre-tax Return on Net Worth | -8.00% | 20.52% | 47.25% | 53.46% | 61.03% | 7.44% |
| Pre-tax Return on Assets | -5.22% | 15.35% | 37.39% | 44.00% | 51.94% | 15.13% |
| Additional Ratios | Year 1 | Year 2 | Year 3 | Year 4 | Year 5 | |
| Net Profit Margin | -3.69% | 5.95% | 14.05% | 16.84% | 20.52% | n.a |
| Return on Equity | -8.00% | 14.37% | 33.07% | 37.42% | 42.72% | n.a |
| Activity Ratios | ||||||
| Accounts Receivable Turnover | 4.52 | 4.52 | 4.52 | 4.52 | 4.52 | n.a |
| Collection Days | 38 | 71 | 71 | 74 | 73 | n.a |
| Inventory Turnover | 12.00 | 5.76 | 5.90 | 5.95 | 5.94 | n.a |
| Accounts Payable Turnover | 6.69 | 12.17 | 12.17 | 12.17 | 12.17 | n.a |
| Payment Days | 27 | 41 | 27 | 27 | 27 | n.a |
| Total Asset Turnover | 1.42 | 1.81 | 1.86 | 1.83 | 1.77 | n.a |
| Debt Ratios | ||||||
| Debt to Net Worth | 0.53 | 0.34 | 0.26 | 0.22 | 0.17 | n.a |
| Current Liab. to Liab. | 0.53 | 0.42 | 0.50 | 0.58 | 0.65 | n.a |
| Liquidity Ratios | ||||||
| Net Working Capital | $167,569 | $199,010 | $267,520 | $344,426 | $453,710 | n.a |
| Interest Coverage | -2.04 | 10.96 | 34.89 | 56.08 | 95.11 | n.a |
| Additional Ratios | ||||||
| Assets to Sales | 0.71 | 0.55 | 0.54 | 0.55 | 0.56 | n.a |
| Current Debt/Total Assets | 18% | 11% | 10% | 10% | 10% | n.a |
| Acid Test | 2.57 | 3.96 | 4.44 | 4.94 | 5.55 | n.a |
| Sales/Net Worth | 2.17 | 2.42 | 2.35 | 2.22 | 2.08 | n.a |
| Dividend Payout | 0.00 | 0.00 | 0.24 | 0.41 | 0.43 | n.a |
8.7 Long-term Plan
JTB’s Product and Services Division’s long term plan has been projected out to a 10 year review to highlight the businesses long term results, and the added potential of the distributor partnerships. Additionally, the 4th & 5th year cash position can be shown for pay-out analysis of the initial investors; this plan also give a much better equity picture.
- Gross Sales over $900,000 by year 6 of this plan.
- Gross Margins over $450,000 by year 5 of this plan.
- Net Income over $160,000 by year 6 of this plan.
- Current Assets over $600,000 by year 6 of the plan.
- Equity of over $600,000 by year 7 of this plan.

Appendix
| Sales Forecast | |||||||||||||
| Month 1 | Month 2 | Month 3 | Month 4 | Month 5 | Month 6 | Month 7 | Month 8 | Month 9 | Month 10 | Month 11 | Month 12 | ||
| Sales | |||||||||||||
| Auto Body products | 0% | $0 | $0 | $1,200 | $1,400 | $1,800 | $4,000 | $5,800 | $7,200 | $8,400 | $10,200 | $11,800 | $14,200 |
| Auto Body services | 0% | $0 | $315 | $360 | $510 | $540 | $1,200 | $1,740 | $2,160 | $2,520 | $3,060 | $3,540 | $4,260 |
| Commercial Drilling | 0% | $0 | $600 | $1,800 | $3,800 | $4,200 | $4,800 | $6,200 | $6,800 | $6,980 | $7,200 | $7,700 | $7,800 |
| Sporting Goods products | 0% | $0 | $0 | $1,200 | $3,400 | $5,400 | $7,800 | $9,400 | $10,400 | $11,700 | $12,900 | $13,200 | $14,400 |
| Sporting Goods services | 0% | $0 | $0 | $460 | $1,360 | $2,160 | $3,120 | $3,760 | $4,160 | $4,600 | $5,160 | $5,280 | $5,760 |
| Prototype Services | 0% | $0 | $0 | $0 | $0 | $600 | $600 | $800 | $800 | $1,000 | $1,000 | $1,200 | $1,200 |
| Metalworking and Manufacturing | 0% | $1,000 | $1,000 | $1,200 | $1,800 | $3,800 | $5,400 | $6,600 | $7,800 | $10,200 | $12,000 | $12,800 | $14,200 |
| Total Sales | $1,000 | $1,915 | $6,220 | $12,270 | $18,500 | $26,920 | $34,300 | $39,320 | $45,400 | $51,520 | $55,520 | $61,820 | |
| Direct Cost of Sales | Month 1 | Month 2 | Month 3 | Month 4 | Month 5 | Month 6 | Month 7 | Month 8 | Month 9 | Month 10 | Month 11 | Month 12 | |
| Auto body products and Services | $0 | $0 | $936 | $1,146 | $1,404 | $3,120 | $3,770 | $4,680 | $5,460 | $6,630 | $7,170 | $9,230 | |
| Commercial Drilling | $0 | $290 | $870 | $1,900 | $2,600 | $2,990 | $3,800 | $3,980 | $4,848 | $5,328 | $5,633 | $5,700 | |
| Sporting Goods | $0 | $0 | $664 | $1,920 | $3,024 | $4,368 | $5,922 | $6,990 | $7,700 | $9,100 | $10,800 | $11,900 | |
| Prototype Services | 27% | $0 | $0 | $0 | $0 | $159 | $159 | $212 | $212 | $265 | $265 | $318 | $318 |
| Metalworking and Manufacturing | $490 | $760 | $870 | $1,100 | $2,400 | $3,900 | $4,950 | $5,400 | $6,300 | $8,400 | $8,800 | $9,900 | |
| Subtotal Direct Cost of Sales | $490 | $1,050 | $3,340 | $6,066 | $9,587 | $14,537 | $18,654 | $21,262 | $24,573 | $29,723 | $32,721 | $37,048 | |
| Personnel Plan | |||||||||||||
| Month 1 | Month 2 | Month 3 | Month 4 | Month 5 | Month 6 | Month 7 | Month 8 | Month 9 | Month 10 | Month 11 | Month 12 | ||
| Production Personnel | |||||||||||||
| Service Team Manager | $0 | $3,200 | $3,200 | $3,200 | $3,200 | $3,200 | $3,200 | $3,200 | $3,200 | $3,200 | $3,200 | $3,200 | |
| Service Team Member | $0 | $0 | $0 | $0 | $1,100 | $1,100 | $1,100 | $1,100 | $1,100 | $1,100 | $1,100 | $1,100 | |
| Subtotal | $0 | $3,200 | $3,200 | $3,200 | $4,300 | $4,300 | $4,300 | $4,300 | $4,300 | $4,300 | $4,300 | $4,300 | |
| Sales and Marketing Personnel | |||||||||||||
| Shared Marketing Associate | $0 | $250 | $250 | $250 | $250 | $250 | $250 | $250 | $250 | $250 | $250 | $250 | |
| Name or Title | $0 | $0 | $0 | $0 | $0 | $0 | $0 | $0 | $0 | $0 | $0 | $0 | |
| Other | $0 | $0 | $0 | $0 | $0 | $0 | $0 | $0 | $0 | $0 | $0 | $0 | |
| Subtotal | $0 | $250 | $250 | $250 | $250 | $250 | $250 | $250 | $250 | $250 | $250 | $250 | |
| General and Administrative Personnel | |||||||||||||
| Production Manager/Service Team Coordinator | $3,600 | $3,600 | $3,600 | $3,600 | $3,600 | $3,600 | $3,600 | $3,600 | $3,600 | $3,600 | $3,600 | $3,600 | |
| Name or Title | $0 | $0 | $0 | $0 | $0 | $0 | $0 | $0 | $0 | $0 | $0 | $0 | |
| Other | $0 | $0 | $0 | $0 | $0 | $0 | $0 | $0 | $0 | $0 | $0 | $0 | |
| Subtotal | $3,600 | $3,600 | $3,600 | $3,600 | $3,600 | $3,600 | $3,600 | $3,600 | $3,600 | $3,600 | $3,600 | $3,600 | |
| Other Personnel | |||||||||||||
| Name or Title | $0 | $0 | $0 | $0 | $0 | $0 | $0 | $0 | $0 | $0 | $0 | $0 | |
| Name or Title | $0 | $0 | $0 | $0 | $0 | $0 | $0 | $0 | $0 | $0 | $0 | $0 | |
| Other | $0 | $0 | $0 | $0 | $0 | $0 | $0 | $0 | $0 | $0 | $0 | $0 | |
| Subtotal | $0 | $0 | $0 | $0 | $0 | $0 | $0 | $0 | $0 | $0 | $0 | $0 | |
| Total People | 2 | 3 | 3 | 3 | 4 | 4 | 4 | 4 | 4 | 4 | 4 | 4 | |
| Total Payroll | $3,600 | $7,050 | $7,050 | $7,050 | $8,150 | $8,150 | $8,150 | $8,150 | $8,150 | $8,150 | $8,150 | $8,150 | |
| General Assumptions | |||||||||||||
| Month 1 | Month 2 | Month 3 | Month 4 | Month 5 | Month 6 | Month 7 | Month 8 | Month 9 | Month 10 | Month 11 | Month 12 | ||
| Plan Month | 1 | 2 | 3 | 4 | 5 | 6 | 7 | 8 | 9 | 10 | 11 | 12 | |
| Current Interest Rate | 10.00% | 10.00% | 10.00% | 10.00% | 10.00% | 10.00% | 10.00% | 10.00% | 10.00% | 10.00% | 10.00% | 10.00% | |
| Long-term Interest Rate | 10.00% | 10.00% | 10.00% | 10.00% | 10.00% | 10.00% | 10.00% | 10.00% | 10.00% | 10.00% | 10.00% | 10.00% | |
| Tax Rate | 30.00% | 30.00% | 30.00% | 30.00% | 30.00% | 30.00% | 30.00% | 30.00% | 30.00% | 30.00% | 30.00% | 30.00% | |
| Other | 0 | 0 | 0 | 0 | 0 | 0 | 0 | 0 | 0 | 0 | 0 | 0 | |
| Pro Forma Profit and Loss | |||||||||||||
| Month 1 | Month 2 | Month 3 | Month 4 | Month 5 | Month 6 | Month 7 | Month 8 | Month 9 | Month 10 | Month 11 | Month 12 | ||
| Sales | $1,000 | $1,915 | $6,220 | $12,270 | $18,500 | $26,920 | $34,300 | $39,320 | $45,400 | $51,520 | $55,520 | $61,820 | |
| Direct Cost of Sales | $490 | $1,050 | $3,340 | $6,066 | $9,587 | $14,537 | $18,654 | $21,262 | $24,573 | $29,723 | $32,721 | $37,048 | |
| Production Payroll | $0 | $3,200 | $3,200 | $3,200 | $4,300 | $4,300 | $4,300 | $4,300 | $4,300 | $4,300 | $4,300 | $4,300 | |
| Other Costs of Goods | $0 | $0 | $0 | $0 | $0 | $0 | $0 | $0 | $0 | $0 | $0 | $0 | |
| Total Cost of Sales | $490 | $4,250 | $6,540 | $9,266 | $13,887 | $18,837 | $22,954 | $25,562 | $28,873 | $34,023 | $37,021 | $41,348 | |
| Gross Margin | $510 | ($2,335) | ($320) | $3,004 | $4,613 | $8,083 | $11,346 | $13,758 | $16,527 | $17,497 | $18,499 | $20,472 | |
| Gross Margin % | 51.00% | -121.93% | -5.14% | 24.48% | 24.94% | 30.03% | 33.08% | 34.99% | 36.40% | 33.96% | 33.32% | 33.12% | |
| Operating Expenses | |||||||||||||
| Sales and Marketing Expenses | |||||||||||||
| Sales and Marketing Payroll | $0 | $250 | $250 | $250 | $250 | $250 | $250 | $250 | $250 | $250 | $250 | $250 | |
| Advertising/Promotion | $0 | $450 | $450 | $450 | $450 | $450 | $450 | $450 | $450 | $450 | $450 | $450 | |
| Other Sales and Marketing Expenses | $0 | $0 | $0 | $0 | $0 | $0 | $0 | $0 | $0 | $0 | $0 | $0 | |
| Total Sales and Marketing Expenses | $0 | $700 | $700 | $700 | $700 | $700 | $700 | $700 | $700 | $700 | $700 | $700 | |
| Sales and Marketing % | 0.00% | 36.55% | 11.25% | 5.70% | 3.78% | 2.60% | 2.04% | 1.78% | 1.54% | 1.36% | 1.26% | 1.13% | |
| General and Administrative Expenses | |||||||||||||
| General and Administrative Payroll | $3,600 | $3,600 | $3,600 | $3,600 | $3,600 | $3,600 | $3,600 | $3,600 | $3,600 | $3,600 | $3,600 | $3,600 | |
| Sales and Marketing and Other Expenses | $450 | $450 | $450 | $450 | $450 | $450 | $450 | $450 | $450 | $450 | $450 | $450 | |
| Depreciation | $646 | $646 | $646 | $646 | $646 | $646 | $646 | $646 | $646 | $646 | $646 | $646 | |
| Rent | $700 | $700 | $700 | $700 | $700 | $700 | $700 | $700 | $700 | $700 | $700 | $700 | |
| Equipment Lease | $2,999 | $2,999 | $2,999 | $2,999 | $2,999 | $2,999 | $2,999 | $2,999 | $2,999 | $2,999 | $2,999 | $2,999 | |
| Utilities | $600 | $600 | $600 | $600 | $600 | $600 | $600 | $600 | $600 | $600 | $600 | $600 | |
| Insurance | $350 | $350 | $350 | $350 | $350 | $350 | $450 | $450 | $450 | $450 | $450 | $450 | |
| Payroll Taxes | 15% | $0 | $0 | $0 | $0 | $0 | $0 | $0 | $0 | $0 | $0 | $0 | $0 |
| Other General and Administrative Expenses | $0 | $0 | $0 | $0 | $0 | $0 | $0 | $0 | $0 | $0 | $0 | $0 | |
| Total General and Administrative Expenses | $9,345 | $9,345 | $9,345 | $9,345 | $9,345 | $9,345 | $9,445 | $9,445 | $9,445 | $9,445 | $9,445 | $9,445 | |
| General and Administrative % | 934.48% | 487.98% | 150.24% | 76.16% | 50.51% | 34.71% | 27.54% | 24.02% | 20.80% | 18.33% | 17.01% | 15.28% | |
| Other Expenses: | |||||||||||||
| Other Payroll | $0 | $0 | $0 | $0 | $0 | $0 | $0 | $0 | $0 | $0 | $0 | $0 | |
| Consultants | $0 | $0 | $0 | $0 | $0 | $0 | $0 | $0 | $0 | $0 | $0 | $0 | |
| Other Other Expenses | $0 | $0 | $0 | $0 | $0 | $0 | $0 | $0 | $0 | $0 | $0 | $0 | |
| Total Other Expenses | $0 | $0 | $0 | $0 | $0 | $0 | $0 | $0 | $0 | $0 | $0 | $0 | |
| Other % | 0.00% | 0.00% | 0.00% | 0.00% | 0.00% | 0.00% | 0.00% | 0.00% | 0.00% | 0.00% | 0.00% | 0.00% | |
| Total Operating Expenses | $9,345 | $10,045 | $10,045 | $10,045 | $10,045 | $10,045 | $10,145 | $10,145 | $10,145 | $10,145 | $10,145 | $10,145 | |
| Profit Before Interest and Taxes | ($8,835) | ($12,380) | ($10,365) | ($7,041) | ($5,432) | ($1,962) | $1,201 | $3,613 | $6,382 | $7,352 | $8,354 | $10,327 | |
| EBITDA | ($8,189) | ($11,734) | ($9,719) | ($6,395) | ($4,786) | ($1,316) | $1,847 | $4,259 | $7,028 | $7,998 | $9,000 | $10,973 | |
| Interest Expense | $372 | $370 | $367 | $365 | $362 | $359 | $357 | $354 | $352 | $349 | $346 | $344 | |
| Taxes Incurred | $0 | $0 | $0 | $0 | $0 | $0 | $0 | $0 | $0 | $0 | $0 | $0 | |
| Net Profit | ($9,207) | ($12,750) | ($10,732) | ($7,405) | ($5,794) | ($2,321) | $844 | $3,259 | $6,031 | $7,003 | $8,008 | $9,983 | |
| Net Profit/Sales | -920.72% | -665.78% | -172.54% | -60.35% | -31.32% | -8.62% | 2.46% | 8.29% | 13.28% | 13.59% | 14.42% | 16.15% | |
| Pro Forma Cash Flow | |||||||||||||
| Month 1 | Month 2 | Month 3 | Month 4 | Month 5 | Month 6 | Month 7 | Month 8 | Month 9 | Month 10 | Month 11 | Month 12 | ||
| Cash Received | |||||||||||||
| Cash from Operations | |||||||||||||
| Cash Sales | $250 | $479 | $1,555 | $3,068 | $4,625 | $6,730 | $8,575 | $9,830 | $11,350 | $12,880 | $13,880 | $15,455 | |
| Cash from Receivables | $0 | $525 | $1,230 | $3,696 | $7,841 | $12,473 | $18,296 | $24,065 | $28,361 | $32,682 | $37,263 | $40,740 | |
| Subtotal Cash from Operations | $250 | $1,004 | $2,785 | $6,764 | $12,466 | $19,203 | $26,871 | $33,895 | $39,711 | $45,562 | $51,143 | $56,195 | |
| Additional Cash Received | |||||||||||||
| Sales Tax, VAT, HST/GST Received | 0.00% | $0 | $0 | $0 | $0 | $0 | $0 | $0 | $0 | $0 | $0 | $0 | $0 |
| New Current Borrowing | $0 | $0 | $0 | $0 | $0 | $0 | $0 | $0 | $0 | $0 | $0 | $0 | |
| New Other Liabilities (interest-free) | $0 | $0 | $0 | $0 | $0 | $0 | $0 | $0 | $0 | $0 | $0 | $0 | |
| New Long-term Liabilities | $0 | $0 | $0 | $0 | $0 | $0 | $0 | $0 | $0 | $0 | $0 | $0 | |
| Sales of Other Current Assets | $0 | $0 | $0 | $0 | $0 | $0 | $0 | $0 | $0 | $0 | $0 | $0 | |
| Sales of Long-term Assets | $0 | $0 | $0 | $0 | $0 | $0 | $0 | $0 | $0 | $0 | $0 | $0 | |
| New Investment Received | $0 | $0 | $0 | $0 | $0 | $0 | $0 | $0 | $0 | $0 | $0 | $0 | |
| Subtotal Cash Received | $250 | $1,004 | $2,785 | $6,764 | $12,466 | $19,203 | $26,871 | $33,895 | $39,711 | $45,562 | $51,143 | $56,195 | |
| Expenditures | Month 1 | Month 2 | Month 3 | Month 4 | Month 5 | Month 6 | Month 7 | Month 8 | Month 9 | Month 10 | Month 11 | Month 12 | |
| Expenditures from Operations | |||||||||||||
| Cash Spending | $3,600 | $7,050 | $7,050 | $7,050 | $8,150 | $8,150 | $8,150 | $8,150 | $8,150 | $8,150 | $8,150 | $8,150 | |
| Bill Payments | $182 | $5,539 | $7,643 | $11,652 | $14,849 | $19,232 | $25,508 | $28,813 | $30,007 | $34,117 | $40,899 | $41,902 | |
| Subtotal Spent on Operations | $3,782 | $12,589 | $14,693 | $18,702 | $22,999 | $27,382 | $33,658 | $36,963 | $38,157 | $42,267 | $49,049 | $50,052 | |
| Additional Cash Spent | |||||||||||||
| Sales Tax, VAT, HST/GST Paid Out | $0 | $0 | $0 | $0 | $0 | $0 | $0 | $0 | $0 | $0 | $0 | $0 | |
| Principal Repayment of Current Borrowing | $0 | $0 | $0 | $0 | $0 | $0 | $0 | $0 | $0 | $0 | $0 | $0 | |
| Other Liabilities Principal Repayment | $0 | $0 | $0 | $0 | $0 | $0 | $0 | $0 | $0 | $0 | $0 | $0 | |
| Long-term Liabilities Principal Repayment | $313 | $313 | $313 | $313 | $313 | $313 | $313 | $313 | $313 | $313 | $313 | $313 | |
| Purchase Other Current Assets | $0 | $0 | $0 | $0 | $0 | $0 | $0 | $0 | $0 | $0 | $0 | $0 | |
| Purchase Long-term Assets | $0 | $0 | $0 | $0 | $0 | $0 | $0 | $0 | $0 | $0 | $0 | $0 | |
| Dividends | $0 | $0 | $0 | $0 | $0 | $0 | $0 | $0 | $0 | $0 | $0 | $0 | |
| Subtotal Cash Spent | $4,095 | $12,902 | $15,006 | $19,014 | $23,312 | $27,694 | $33,971 | $37,276 | $38,469 | $42,580 | $49,362 | $50,365 | |
| Net Cash Flow | ($3,845) | ($11,898) | ($12,220) | ($12,250) | ($10,846) | ($8,491) | ($7,100) | ($3,381) | $1,241 | $2,982 | $1,781 | $5,830 | |
| Cash Balance | $166,805 | $154,907 | $142,687 | $130,436 | $119,591 | $111,100 | $104,000 | $100,619 | $101,860 | $104,842 | $106,623 | $112,453 | |
| Pro Forma Balance Sheet | |||||||||||||
| Month 1 | Month 2 | Month 3 | Month 4 | Month 5 | Month 6 | Month 7 | Month 8 | Month 9 | Month 10 | Month 11 | Month 12 | ||
| Assets | Starting Balances | ||||||||||||
| Current Assets | |||||||||||||
| Cash | $170,650 | $166,805 | $154,907 | $142,687 | $130,436 | $119,591 | $111,100 | $104,000 | $100,619 | $101,860 | $104,842 | $106,623 | $112,453 |
| Accounts Receivable | $0 | $750 | $1,661 | $5,096 | $10,602 | $16,636 | $24,353 | $31,782 | $37,208 | $42,897 | $48,855 | $53,232 | $58,857 |
| Inventory | $1,000 | $510 | $1,050 | $3,340 | $6,066 | $9,587 | $14,537 | $18,654 | $21,262 | $24,573 | $29,723 | $32,721 | $37,048 |
| Other Current Assets | $5,000 | $5,000 | $5,000 | $5,000 | $5,000 | $5,000 | $5,000 | $5,000 | $5,000 | $5,000 | $5,000 | $5,000 | $5,000 |
| Total Current Assets | $176,650 | $173,065 | $162,618 | $156,122 | $152,104 | $150,814 | $154,990 | $159,436 | $164,088 | $174,330 | $188,420 | $197,576 | $213,358 |
| Long-term Assets | |||||||||||||
| Long-term Assets | $45,000 | $45,000 | $45,000 | $45,000 | $45,000 | $45,000 | $45,000 | $45,000 | $45,000 | $45,000 | $45,000 | $45,000 | $45,000 |
| Accumulated Depreciation | $0 | $646 | $1,292 | $1,937 | $2,583 | $3,229 | $3,875 | $4,521 | $5,167 | $5,812 | $6,458 | $7,104 | $7,750 |
| Total Long-term Assets | $45,000 | $44,354 | $43,708 | $43,063 | $42,417 | $41,771 | $41,125 | $40,479 | $39,833 | $39,188 | $38,542 | $37,896 | $37,250 |
| Total Assets | $221,650 | $217,419 | $206,327 | $199,185 | $194,521 | $192,584 | $196,115 | $199,915 | $203,922 | $213,517 | $226,962 | $235,472 | $250,608 |
| Liabilities and Capital | Month 1 | Month 2 | Month 3 | Month 4 | Month 5 | Month 6 | Month 7 | Month 8 | Month 9 | Month 10 | Month 11 | Month 12 | |
| Current Liabilities | |||||||||||||
| Accounts Payable | $0 | $5,289 | $7,258 | $11,161 | $14,215 | $18,385 | $24,549 | $27,818 | $28,877 | $32,755 | $39,509 | $40,323 | $45,789 |
| Current Borrowing | $0 | $0 | $0 | $0 | $0 | $0 | $0 | $0 | $0 | $0 | $0 | $0 | $0 |
| Other Current Liabilities | $0 | $0 | $0 | $0 | $0 | $0 | $0 | $0 | $0 | $0 | $0 | $0 | $0 |
| Subtotal Current Liabilities | $0 | $5,289 | $7,258 | $11,161 | $14,215 | $18,385 | $24,549 | $27,818 | $28,877 | $32,755 | $39,509 | $40,323 | $45,789 |
| Long-term Liabilities | $45,000 | $44,688 | $44,375 | $44,063 | $43,750 | $43,438 | $43,125 | $42,813 | $42,500 | $42,188 | $41,875 | $41,563 | $41,250 |
| Total Liabilities | $45,000 | $49,977 | $51,633 | $55,224 | $57,965 | $61,823 | $67,674 | $70,630 | $71,377 | $74,943 | $81,384 | $81,886 | $87,039 |
| Paid-in Capital | $230,000 | $230,000 | $230,000 | $230,000 | $230,000 | $230,000 | $230,000 | $230,000 | $230,000 | $230,000 | $230,000 | $230,000 | $230,000 |
| Retained Earnings | ($53,350) | ($53,350) | ($53,350) | ($53,350) | ($53,350) | ($53,350) | ($53,350) | ($53,350) | ($53,350) | ($53,350) | ($53,350) | ($53,350) | ($53,350) |
| Earnings | $0 | ($9,207) | ($21,957) | ($32,689) | ($40,094) | ($45,888) | ($48,209) | ($47,365) | ($44,106) | ($38,075) | ($31,072) | ($23,064) | ($13,081) |
| Total Capital | $176,650 | $167,443 | $154,693 | $143,961 | $136,556 | $130,762 | $128,441 | $129,285 | $132,544 | $138,575 | $145,578 | $153,586 | $163,569 |
| Total Liabilities and Capital | $221,650 | $217,419 | $206,327 | $199,185 | $194,521 | $192,584 | $196,115 | $199,915 | $203,922 | $213,517 | $226,962 | $235,472 | $250,608 |
| Net Worth | $176,650 | $167,443 | $154,693 | $143,961 | $136,556 | $130,762 | $128,441 | $129,285 | $132,544 | $138,575 | $145,578 | $153,586 | $163,569 |
| Long-term | ||||||||||
| Year 1 | Year 2 | Year 3 | Year 4 | Year 5 | Year 6 | Year 7 | Year 8 | Year 9 | Year 10 | |
| Sales | $354,705 | $461,550 | $601,569 | $729,944 | $902,842 | $905,618 | $959,956 | $998,354 | $1,058,255 | $1,105,876 |
| Cost of Sales | $243,051 | $286,974 | $338,739 | $405,839 | $485,700 | $479,978 | $508,777 | $529,128 | $560,875 | $586,114 |
| Gross Margin | $111,654 | $174,576 | $262,830 | $324,105 | $417,142 | $425,640 | $451,179 | $469,226 | $497,380 | $519,762 |
| Gross Margin % | 31.48% | 37.82% | 43.69% | 44.40% | 46.20% | 47.00% | 47.00% | 47.00% | 47.00% | 47.00% |
| Operating Expenses | $120,438 | $131,438 | $138,538 | $145,338 | $149,638 | $157,120 | $164,976 | $173,225 | $181,886 | $190,980 |
| Operating Income | ($8,784) | $43,138 | $124,292 | $178,767 | $267,504 | $268,521 | $286,203 | $296,002 | $315,494 | $328,781 |
| Net Income | ($13,081) | $27,440 | $84,511 | $122,906 | $185,284 | $179,909 | $191,756 | $198,321 | $211,381 | $220,284 |
| Current Assets | $213,358 | $225,937 | $301,184 | $385,061 | $503,335 | $629,169 | $755,003 | $868,253 | $998,491 | $1,098,340 |
| Long-term Assets | $37,250 | $29,500 | $21,750 | $14,000 | $6,250 | $0 | $0 | $0 | $0 | $0 |
| Current Liabilities | $45,789 | $26,927 | $33,663 | $40,636 | $49,625 | $51,610 | $53,675 | $55,822 | $58,054 | $60,377 |
| Long-term Liabilities | $41,250 | $37,500 | $33,750 | $30,000 | $26,250 | $13,338 | $426 | $0 | $0 | $0 |
| Equity | $163,569 | $191,010 | $255,520 | $328,426 | $433,710 | $590,897 | $701,754 | $812,432 | $940,437 | $1,037,964 |


