
Group Publishing, Inc.
Executive Summary
The Group Publishing, Inc. (Group Publishing) is the publisher of “Artists In Business” magazine. The magazine, which has already printed an initial issue in July/August 1996 is directed at artists at all levels of business throughout the United States. The management of Group Publishing is targeting a total combined circulation of “Artists In Business” of 206,000 in year one, increasing to 310,000 by the end of year three. The magazine will be published bi-monthly with increased press runs throughout the first three years. Sample distribution, organizational sales, and direct mail to targeted lists of artists will be utilized to build subscriptions.
In addition, Group Publishing will market books via direct marketing and through established artist distribution channels. The direct marketing of Group Publishing books will be implemented through its magazine readership base.
Publishing is a high profit and high margin business. The key to success is successful marketing. The Group has a highly focused multi-dimensional sales and marketing plan to build its total circulation base quickly. The same channels and methods were utilized to establish a circulation of 500,000 in the first year for the Visionary Artist’s periodical.
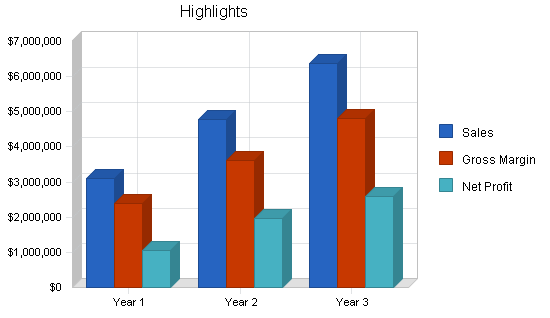
Successful execution of The Group’s plan will produce sales revenues of $3.1 million in year one, $4.8 million in year two, and $6.4 million in year three. Net profit will increase steadily over the next three years.
The highlights of the business plan are illustrated in the following chart. Sales, margins, and net profit increase each year. The lowest margins occur in year one, reflecting the marketing costs of building the circulation base.
1.1 Objectives
The initial objectives of The Group are as follows:
- To raise seed capital of $150,000 to ensure publication by month two and to establish a cash reserve to market subscriptions.
- To have 90,000 subscribers by the end of year one through direct sampling and marketing.
- To have an additional 50,000 subscribers by the end of year one through organizational sales.
- To have 10,000 more two-year subscriptions sold.
- To publish two 36 page issues initially with press runs of 50,000 promotional copies each.
- To go to 48 pages by issue number three and increase press runs to 75,000 promotional copies.
- Increase to 100,000 promotional copies in issues five and six.
- Increase average ad page cost from $1,819 to $2,618 by the end of the first year.
- To sell an average of 17.5 ad pages per issue throughout year one.
1.2 Mission
“Artists In Business” magazine is for the artist who is a worker at any level. The magazine has a commitment to be a platform to profile artists who are representing artistic vision in the marketplace and who can both encourage and provide role models to other men and women. Group Publishing, through its magazine, books, and editorial content, will be a vessel to inform artists about artistic principles in everyday business and will encourage interaction among artists as business people. Our mission is to promote the concept of “community” in the workplace.
1.3 Keys to Success
The keys to success are:
- Attaining targeted circulation levels.
- Controlling costs while spending the maximum on subscription marketing in year one.
- Carefully monitoring response rates of all media executions.
- Follow-on marketing of two to four book titles in the first year.
- Attaining targeted advertising sales revenues.
- Having quality editorial content in each issue.
- Making all production and distribution dates in a timely fashion for each issue.
Company Summary
Group Publishing, Inc. began as a joint concept between two avocational artists, Red Brushwielder, an advertising executive, and Thallos Green, a former insurance executive and the owner of the “Artists In Business” name. Mr. Green will promote “Artists In Business” as a radio program for syndication (a separate business entity).
Mr. Green is licensing the “Artists In Business” name to The Group Publishing, Inc. for the sum of $1 (one dollar). Mr. Green will also receive one page of advertising at no charge in each and every issue of the magazine and one page of editorial in each issue (as the founder of the magazine). It is expected that the radio show produced by Mr. Green will be a powerful promotional vehicle for the magazine.
Group Publishing will have exclusive rights to “Artists In Business” for all print media, electronic media (Internet home page, CD-ROM, Interactive Publications, etc.), catalogue business, and possible seminars and workshops devoted to the artistic business person.
2.1 Start-up Summary
The following tables and chart outline our start-up requirements and needed funding.
Equity investment in the company is now being made available to outside investors for the first time. The purpose of this investment is to raise the needed “seed” capital to launch the magazine. An initial Private Placement offering to raise from $150K to $375K is in progress. The minimum amount of the offering would be sufficient to publish the first new issue in 1997. Money raised in excess of the minimum will enable full-scale sampling and marketing of subscriptions. It is possible that no further investment may be needed. However, it cannot be assured that additional capital will not be required in the future or that sufficient capital will be available to continue publication.
We anticipate buying back the outside investment in year three for $1.5 million.

| Start-up Funding | |
| Start-up Expenses to Fund | $83,000 |
| Start-up Assets to Fund | $67,000 |
| Total Funding Required | $150,000 |
| Assets | |
| Non-cash Assets from Start-up | $0 |
| Cash Requirements from Start-up | $67,000 |
| Additional Cash Raised | $0 |
| Cash Balance on Starting Date | $67,000 |
| Total Assets | $67,000 |
| Liabilities and Capital | |
| Liabilities | |
| Current Borrowing | $0 |
| Long-term Liabilities | $0 |
| Accounts Payable (Outstanding Bills) | $0 |
| Other Current Liabilities (interest-free) | $0 |
| Total Liabilities | $0 |
| Capital | |
| Planned Investment | |
| Private Placement ’96 | $150,000 |
| Investor | $0 |
| Additional Investment Requirement | $0 |
| Total Planned Investment | $150,000 |
| Loss at Start-up (Start-up Expenses) | ($83,000) |
| Total Capital | $67,000 |
| Total Capital and Liabilities | $67,000 |
| Total Funding | $150,000 |
| Start-up | |
| Requirements | |
| Start-up Expenses | |
| Legal | $7,500 |
| Stationery etc. | $2,500 |
| Brochures | $5,000 |
| Consultants | $12,500 |
| Development Advisory Fee | $8,000 |
| Rent | $7,500 |
| 1st Issue Total | $40,000 |
| Total Start-up Expenses | $83,000 |
| Start-up Assets | |
| Cash Required | $67,000 |
| Start-up Inventory | $0 |
| Other Current Assets | $0 |
| Long-term Assets | $0 |
| Total Assets | $67,000 |
| Total Requirements | $150,000 |
2.2 Company Ownership
Red Brushwielder is the founder of The Group Publishing, Inc. a newly formed Southwest “C” corporation. He currently owns all its stock.
2.3 Company Locations and Facilities
The Group Publishing, Inc. has current offices at 1234 Main Street, Anytown, GA. 30000 The phone # is … and the fax # is …. The office is fully equipped and functional. It is not anticipated that expanded facilities will be needed for the first few years of the plan. All business, management and editorial functions will be performed there. All printing, mailing, warehousing, and fulfillment is outsourced.
Products
The Group Publishing will publish “Artists In Business” magazine. The magazine is high gloss, 48 pages, contemporary in look and appeal. Quality art content is the constant goal. The magazine will be entertaining and newsworthy and thought-provoking. It will appeal to a broad artist readership. No magazine like it is available today.
The Group Publishing will also publish softcover and hardcover books. Certain titles will be published in softcover “trade” size. Others (called “booklets” in this plan) will be similar to “paperback” size. Contemporary Arts themes will prevail, particularly those that deal with the demands placed on both business and family life by today’s business climate.
Market Analysis Summary
The target market is broadly based and is defined as the artist business person at all levels in any organization.
Market segments are defined by organizational affiliation.
Media strategy and execution may vary by segment.
Strategy and Implementation Summary
Our strategy is based on serving a clearly defined niche market well. By having an identifiable market with available lists and related memberships, the management of The Group believes we can exceed publishing industry standards for conversion of potential subscribers. Committed artists are a passionate and loyal clientele. A thirst exists for the published periodical product that “Artists In Business” will provide. The initial issue, published in late summer of 1996 met with rave reviews at booksellers and distributors conventions and was profiled on Arts News radio. The task is to reach and inform the target market. The strategy is to combine sampling, direct mail, and group membership solicitation to build circulation through both subscriptions and newsstand distribution. Multi-channel distribution principles will be employed. Each has a differing margin structure but the combination will maximize the potential reach of the magazine.

5.1 Marketing Strategy
New subscriptions are both sample and media based. Sampling will be done to both known arts organization members and to artist mailing lists. Several of these databases are already available to The Group. “Artists In Business” has access to a list of 100,000 Artist business leaders. All will be sampled with the magazine.
Sample runs will be: 50,000 issues on the first and second runs, 75,000 issues on the second and third runs, and 100,000 issues on the fifth and sixth issues of 1997. All cost associated with these sampling programs are included in the advertising and promotion budgets for those months. A total of $362,000 will be spent on direct mailed sampling geared to subscription.
In alternate months, print media will be used. Arts publications will be employed. “New Brush” magazine, “Colours” magazine, and “Artistic License Today” will have the early insertions. As subscription base grows general interest media will be used later in the year. “Inc.” magazine and “Business Week” are likely choices.
Finally, sales to Arts supply and retail bookstores through magazine distributors will also be accomplished. Key distributors have already expressed interest in the publication.
All sales projections through this multi-channel approach will reflect the different pricing and margin considerations pertinent to each.
5.1.1 Distribution Strategy
Distribution of magazines and books through retail channels are projected at retail less 60%.
Subscriptions through organizations are projected at list less 50%.
All direct sales are booked at full revenue. Cost of product is deducted for 6 issues per year. Fulfillment costs are expensed.
Direct sales of books are billed to credit cards and drop shipped. The magazine is an ideal vehicle to promote these sales.
Future sales are planned directly over the internet from the AIB website.
5.1.3 Strategic Alliances
The strategic alliance with Thallos Green and his AIB radio broadcasts holds great potential. Thallos plans to syndicate the broadcasts on Arts News radio stations across the U.S.
5.1.4 Promotion Strategy
In addition to advertising, direct mail, and media executions, public relations exposure will benefit magazine circulation significantly. Red Brushwielder has already appeared and been interviewed on Arts News radio programs four times. Tapes of these interviews are available. In one instance more than 1800 calls were received requesting subscription information from a single program.
Red Brushwielder has also been asked to tape programs for an Anytown radio station on the subject of Artists in the workplace.
Promotion strategy for sales through organizations to their memberships includes a split of the first year’s subscription revenue with the selling organization.
5.1.5 Pricing Strategy
The “Artists In Business” magazine will sell for $3.95 per single issue on the newsstand.
- A one-year subscription is $16.95.
- A two year subscription is $29.95.
- “Trade” soft-cover books will sell for $14.95.
- Paperback size “booklets” will sell for $7.95.
- Future hardcover books will sell for $19.95 to $22.95. No hardcover sales are projected in this three year plan.
5.2 Sales Strategy
Our combined sales strategy of sampling, direct mail, and organizations will result in the following first year sales goals:
- 90,000 one-year subscriptions.
- 50,000 one-year subscriptions through organizations.
- 10,000 two-year subscriptions.
Four book titles are factored in in the second half of the year. Two are “trade” and two are “booklets.” Sales goals are modest.
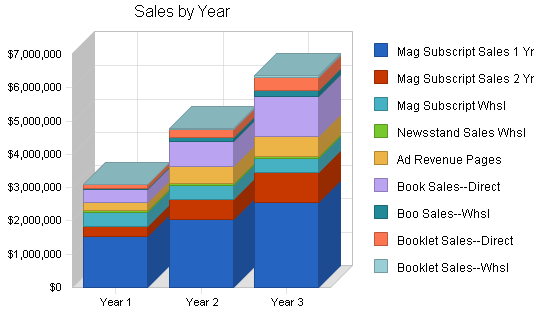
The following sections illustrate annual revenue over the next three years of $3.1, $4.8, and $6.4 million respectively.
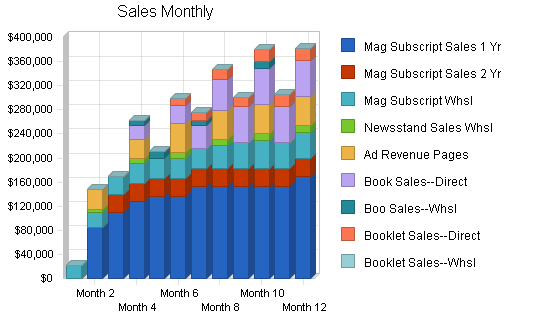
5.2.1 Sales Forecast
The following table and chart presents specific sales forecasts by product, by month, over the first year of sales development. Years two and three are cumulative totals only. All sales project the relevant unit cost and margin differences to reflect discounts, commissions, and revenue splits.
Discount on ad revenue is 15% agency commission and 20% sales commission for a total of 35%.
All product costs for subscriptions are based on $.40 per issue–6 issues for one year, 12 issues for two years.
The only cost not included here is an author’s royalty on book sales–expected to be 15%. These royalty costs are incurred on the P & L statement as an expense item.
| Sales Forecast | |||
| Year 1 | Year 2 | Year 3 | |
| Unit Sales | |||
| Mag Subscript Sales 1 Yr | 90,000 | 120,000 | 150,000 |
| Mag Subscript Sales 2 Yr | 10,000 | 20,000 | 30,000 |
| Mag Subscript Whsl | 50,000 | 50,000 | 50,000 |
| Newsstand Sales Whsl | 56,500 | 72,000 | 80,000 |
| Ad Revenue Pages | 118 | 150 | 150 |
| Book Sales–Direct | 25,500 | 50,000 | 80,000 |
| Boo Sales–Whsl | 7,000 | 20,000 | 30,000 |
| Booklet Sales–Direct | 14,500 | 30,000 | 50,000 |
| Booklet Sales–Whsl | 0 | 15,000 | 20,000 |
| Total Unit Sales | 253,618 | 377,150 | 490,150 |
| Unit Prices | Year 1 | Year 2 | Year 3 |
| Mag Subscript Sales 1 Yr | $16.95 | $16.95 | $16.95 |
| Mag Subscript Sales 2 Yr | $29.95 | $29.95 | $29.95 |
| Mag Subscript Whsl | $8.50 | $8.50 | $8.50 |
| Newsstand Sales Whsl | $0.99 | $0.99 | $0.99 |
| Ad Revenue Pages | $2,182.00 | $3,365.00 | $3,976.00 |
| Book Sales–Direct | $14.95 | $14.95 | $14.95 |
| Boo Sales–Whsl | $5.98 | $5.98 | $5.98 |
| Booklet Sales–Direct | $7.95 | $7.95 | $7.95 |
| Booklet Sales–Whsl | $0.00 | $3.18 | $3.18 |
| Sales | |||
| Mag Subscript Sales 1 Yr | $1,525,500 | $2,034,000 | $2,542,500 |
| Mag Subscript Sales 2 Yr | $299,500 | $599,000 | $898,500 |
| Mag Subscript Whsl | $425,000 | $425,000 | $425,000 |
| Newsstand Sales Whsl | $55,935 | $71,280 | $79,200 |
| Ad Revenue Pages | $257,476 | $504,750 | $596,400 |
| Book Sales–Direct | $381,225 | $747,500 | $1,196,000 |
| Boo Sales–Whsl | $41,860 | $119,600 | $179,400 |
| Booklet Sales–Direct | $115,275 | $238,500 | $397,500 |
| Booklet Sales–Whsl | $0 | $47,700 | $63,600 |
| Total Sales | $3,101,771 | $4,787,330 | $6,378,100 |
| Direct Unit Costs | Year 1 | Year 2 | Year 3 |
| Mag Subscript Sales 1 Yr | $2.40 | $2.40 | $2.40 |
| Mag Subscript Sales 2 Yr | $4.80 | $4.80 | $4.80 |
| Mag Subscript Whsl | $2.40 | $2.40 | $2.40 |
| Newsstand Sales Whsl | $0.40 | $0.40 | $0.40 |
| Ad Revenue Pages | $788.02 | $1,178.00 | $1,392.00 |
| Book Sales–Direct | $2.99 | $2.99 | $2.99 |
| Boo Sales–Whsl | $2.99 | $2.99 | $2.99 |
| Booklet Sales–Direct | $1.59 | $1.59 | $1.59 |
| Booklet Sales–Whsl | $0.00 | $1.59 | $1.59 |
| Direct Cost of Sales | |||
| Mag Subscript Sales 1 Yr | $216,000 | $288,000 | $360,000 |
| Mag Subscript Sales 2 Yr | $48,000 | $96,000 | $144,000 |
| Mag Subscript Whsl | $120,000 | $120,000 | $120,000 |
| Newsstand Sales Whsl | $22,600 | $28,800 | $32,000 |
| Ad Revenue Pages | $92,986 | $176,700 | $208,800 |
| Book Sales–Direct | $76,245 | $149,500 | $239,200 |
| Boo Sales–Whsl | $20,930 | $59,800 | $89,700 |
| Booklet Sales–Direct | $23,055 | $47,700 | $79,500 |
| Booklet Sales–Whsl | $0 | $23,850 | $31,800 |
| Subtotal Direct Cost of Sales | $619,816 | $990,350 | $1,305,000 |
5.3 Milestones
Important milestones are:
- Raising “seed” capital.
- Publishing magazine by February.
- Launching subscription marketing programs.
- Achieving subscription goals.

| Milestones | |||||
| Milestone | Start Date | End Date | Budget | Manager | Department |
| Sample Milestones | 1/4/2008 | 1/4/2008 | $0 | ABC | Department |
| Finish Business Plan | 5/7/2009 | 6/6/2009 | $100 | Dude | LeGrande Fromage |
| Acquire Financing | 5/17/2009 | 7/6/2009 | $200 | Dudette | Legumers |
| Ah HA! Event | 5/27/2009 | 6/1/2009 | $60 | Marianne | Bosses |
| Oooooh Noooooo! Event | 6/26/2009 | 7/1/2009 | $250 | Marionette | Chèvre deBlâme |
| Grande Opening | 7/6/2009 | 7/11/2009 | $500 | Gloworm | Nobs |
| Marketing Program Starts | 6/6/2009 | 7/1/2009 | $1,000 | Glower | Marketeers |
| Plan vs. Actual Review | 11/1/2009 | 11/8/2009 | $0 | Galore | Alles |
| First Break-even Month | 3/5/2010 | 4/4/2010 | $0 | Bouys | Salers |
| Hire Employees | 2/1/2010 | 3/3/2010 | $150 | Gulls | HRM |
| Upgrade Business Plan Pro | 4/22/2010 | 4/24/2010 | $100 | Brass | Bossies |
| Totals | $2,360 | ||||
Management Summary
With production and fulfillment services outsourced, The Group Publishing, Inc. has need for general management, editorial, artistic, sales & marketing, and financial expertise.
6.1 Management Team
Red Brushwielder (44), President & CEO, Publisher & Editor
Mr. Brushwielder founded and successfully grew an advertising agency over a thirteen year period. He is accomplished in both publishing and direct marketing. One of his largest clients over the years has been Payne’s Gray Publishers, Inc. a NASDAQ public company and Art book publisher.
Mr. Brushwielder has a total of 20 years experience in advertising and publishing. His advertising clients have included American Express, Steinway & Sons Piano Company, Peachtree Software, Parisian Department Stores, and ADP Payroll Services. Red Brushwielder attended the University of South Carolina.
Ochre & Sienna Burnt, Asst. Editors
Ochre (50) and Sienna (48) are the founders of Painting Restoration, which has the mission of restoring old family portraits. They are accomplished authors, with the titles “Restoring the Early Portrait” and “Demolishing Portrait Forgeries” to their credit. Ochre served in the U.S. Navy, serving three deployments in Viet Nam as a helicopter pilot.
Ochre holds a BA in Economics from the University of Connecticut, an MBA from California Lutheran College, and a Master’s of Art Education from School of Hard Knocks. Sienna holds a BS in Education from the University of Connecticut.
John Crimson (50), Interim Chief Financial Officer
Mr. Crimson was last VP and Treasurer for Holiday Inn Worldwide. He previously was President of a $30 million dollar credit union. John has a BA in Finance from the College of Wooster in Ohio and an MBA in Finance from Emory University.
Timothy Clark (48), VP of Corporate Development
Mr. Clark has successfully raised capital for both public and private companies and has written and executed strategic growth plans as both an executive and as a consultant. He has previously been in executive positions with three growth stage companies and also was part of a turn-around team that successfully righted a failed venture-backed start-up. In his early career he held sales and marketing management positions with Lever Brothers Company and the LCR Division of Squibb, Inc. both in Chicago and New York. He is skilled in Strategic Planning and Capital Formation. Mr. Clark holds a BA in Marketing from the University of Notre Dame.
6.2 Management Team Gaps
An art director is needed. Also freelance artists.
Ad sales manager and circulation manager are factored in as needed.
6.3 Personnel Plan
The following table includes the personnel plan and projected salaries for all key people.
| Personnel Plan | |||
| Year 1 | Year 2 | Year 3 | |
| Production Personnel | |||
| Name or Title or Group | $0 | $0 | $0 |
| Name or Title or Group | $0 | $0 | $0 |
| Subtotal | $0 | $0 | $0 |
| Sales and Marketing Personnel | |||
| Ad Sales Mgr. | $36,000 | $40,000 | $44,000 |
| Subscription Mgr. | $15,000 | $30,000 | $33,000 |
| Subtotal | $51,000 | $70,000 | $77,000 |
| General and Administrative Personnel | |||
| Red Brushwielder, CEO | $60,000 | $66,000 | $72,000 |
| Ochre & Sienna Burnt, Exec. Editors | $52,800 | $60,000 | $66,000 |
| John Crimson, CFO | $12,000 | $52,000 | $60,000 |
| Exec. Asst. | $18,000 | $22,000 | $24,000 |
| Timothy Clark, VP Corp. Dev. | $18,000 | $36,000 | $48,000 |
| Subtotal | $160,800 | $236,000 | $270,000 |
| Other Personnel | |||
| Art Director | $52,800 | $60,000 | $66,000 |
| Freelance Artist | $6,000 | $6,000 | $6,000 |
| Bookkeeper | $5,400 | $0 | $0 |
| Subtotal | $64,200 | $66,000 | $72,000 |
| Total People | 10 | 11 | 11 |
| Total Payroll | $276,000 | $372,000 | $419,000 |
Financial Plan
After initial capitalization growth can be financed largely through internal cash flow provided subscription targets are met. In the event of a sales shortfall, marketing can be cut back temporarily to preserve cash. Or, more likely, additional investment may be sought to re-accelerate productive campaigns if growth demands more funding.
The company created by this plan will generate cash as soon as subscription base reaches critical mass.
7.1 Important Assumptions
The following table illustrates the financial assumptions used as the basis for this plan. The key element is six inventory turns per year. This reflects the issues of the magazine as well as ad revenue. Ad space is treated as an inventory item.
Subscriptions are paid in advance. Only 10% of receivables are collected in 30 days, primarily from wholesale accounts. These are notoriously slow payors, so care must be taken not to let these collections run past 60 days. This will be more significant if book sales become a higher-than-expected percentage of revenue.
| General Assumptions | |||
| Year 1 | Year 2 | Year 3 | |
| Plan Month | 1 | 2 | 3 |
| Current Interest Rate | 10.00% | 10.00% | 10.00% |
| Long-term Interest Rate | 10.00% | 10.00% | 10.00% |
| Tax Rate | 30.00% | 30.00% | 30.00% |
| Other | 0 | 0 | 0 |
7.2 Key Financial Indicators
The following chart represents changes in critical profit variables. Note that margins and expenses are consistently controlled and net profit increases nicely. Inventory turns slow down somewhat in the third year due to the burden of higher inventories for increasing book sales.

7.3 Break-even Analysis
This break-even analysis is applicable to the early 1997 time frame only. Key fixed costs represent the “burn” rate prior to major acceleration of marketing plans. Thus, if subscriptions didn’t flow in as planned this represents the point at which the company could continue to survive without increasing marketing. In that event, management could “buy” time to raise additional capital.

| Break-even Analysis | |
| Monthly Units Break-even | 7,584 |
| Monthly Revenue Break-even | $92,759 |
| Assumptions: | |
| Average Per-Unit Revenue | $12.23 |
| Average Per-Unit Variable Cost | $2.44 |
| Estimated Monthly Fixed Cost | $74,223 |
7.4 Projected Profit and Loss
We expect net income to near $1 million in year one and $2.4 million in year three. Net profit margins will improve as subscriptions mature and marketing costs decrease.


| Pro Forma Profit and Loss | |||
| Year 1 | Year 2 | Year 3 | |
| Sales | $3,101,771 | $4,787,330 | $6,378,100 |
| Direct Cost of Sales | $619,816 | $990,350 | $1,305,000 |
| Production Payroll | $0 | $0 | $0 |
| Author’s Royalties: 15% | $80,754 | $172,995 | $275,475 |
| Total Cost of Sales | $700,570 | $1,163,345 | $1,580,475 |
| Gross Margin | $2,401,201 | $3,623,985 | $4,797,625 |
| Gross Margin % | 77.41% | 75.70% | 75.22% |
| Operating Expenses | |||
| Sales and Marketing Expenses | |||
| Sales and Marketing Payroll | $51,000 | $70,000 | $77,000 |
| Advertising/Promotion | $386,176 | $72,000 | $90,000 |
| Travel | $7,500 | $9,000 | $11,000 |
| Entertainment & Meals | $2,400 | $3,000 | $3,600 |
| Miscellaneous | $12,000 | $15,000 | $18,000 |
| Total Sales and Marketing Expenses | $459,076 | $169,000 | $199,600 |
| Sales and Marketing % | 14.80% | 3.53% | 3.13% |
| General and Administrative Expenses | |||
| General and Administrative Payroll | $160,800 | $236,000 | $270,000 |
| Marketing/Promotion | $0 | $0 | $0 |
| Depreciation | $0 | $0 | $0 |
| Leased Equipment | $10,200 | $12,500 | $14,000 |
| Telephone | $7,200 | $7,500 | $7,800 |
| Postage | $138,200 | $279,000 | $465,000 |
| Rent | $30,000 | $30,000 | $36,000 |
| Utilities | $9,000 | $10,000 | $10,500 |
| Insurance | $12,000 | $12,000 | $14,000 |
| Payroll Taxes | $0 | $0 | $0 |
| Other General and Administrative Expenses | $0 | $0 | $0 |
| Total General and Administrative Expenses | $367,400 | $587,000 | $817,300 |
| General and Administrative % | 11.84% | 12.26% | 12.81% |
| Other Expenses: | |||
| Other Payroll | $64,200 | $66,000 | $72,000 |
| Consultants | $0 | $0 | $0 |
| Other Expenses | $0 | $0 | $0 |
| Total Other Expenses | $64,200 | $66,000 | $72,000 |
| Other % | 2.07% | 1.38% | 1.13% |
| Total Operating Expenses | $890,676 | $822,000 | $1,088,900 |
| Profit Before Interest and Taxes | $1,510,525 | $2,801,985 | $3,708,725 |
| EBITDA | $1,510,525 | $2,801,985 | $3,708,725 |
| Interest Expense | $0 | $0 | $0 |
| Taxes Incurred | $453,157 | $840,596 | $1,112,618 |
| Net Profit | $1,057,368 | $1,961,390 | $2,596,108 |
| Net Profit/Sales | 34.09% | 40.97% | 40.70% |
7.5 Projected Cash Flow
The table below illustrates cash accumulation from the initial assumption of $150K capital infusion. At no point does the company run out of cash. We expect to buy back the initial outside investment in year three.
The chart illustrates the critical cash flow in year one. Note that early contributions on a monthly basis are minimal and only gain momentum in the second half of the year. If shortfalls occur early on more capital may be required.

| Pro Forma Cash Flow | |||
| Year 1 | Year 2 | Year 3 | |
| Cash Received | |||
| Cash from Operations | |||
| Cash Sales | $2,791,594 | $4,308,597 | $5,740,290 |
| Cash from Receivables | $242,574 | $441,996 | $603,139 |
| Subtotal Cash from Operations | $3,034,168 | $4,750,593 | $6,343,429 |
| Additional Cash Received | |||
| Sales Tax, VAT, HST/GST Received | $0 | $0 | $0 |
| New Current Borrowing | $0 | $0 | $0 |
| New Other Liabilities (interest-free) | $0 | $0 | $0 |
| New Long-term Liabilities | $0 | $0 | $0 |
| Sales of Other Current Assets | $0 | $0 | $0 |
| Sales of Long-term Assets | $0 | $0 | $0 |
| New Investment Received | $0 | $0 | $0 |
| Subtotal Cash Received | $3,034,168 | $4,750,593 | $6,343,429 |
| Expenditures | Year 1 | Year 2 | Year 3 |
| Expenditures from Operations | |||
| Cash Spending | $276,000 | $372,000 | $419,000 |
| Bill Payments | $1,582,258 | $2,577,550 | $3,334,557 |
| Subtotal Spent on Operations | $1,858,258 | $2,949,550 | $3,753,557 |
| Additional Cash Spent | |||
| Sales Tax, VAT, HST/GST Paid Out | $0 | $0 | $0 |
| Principal Repayment of Current Borrowing | $0 | $0 | $0 |
| Other Liabilities Principal Repayment | $0 | $0 | $0 |
| Long-term Liabilities Principal Repayment | $0 | $0 | $0 |
| Purchase Other Current Assets | $0 | $0 | $0 |
| Purchase Long-term Assets | $0 | $0 | $0 |
| Dividends | $0 | $0 | $1,500,000 |
| Subtotal Cash Spent | $1,858,258 | $2,949,550 | $5,253,557 |
| Net Cash Flow | $1,175,910 | $1,801,044 | $1,089,872 |
| Cash Balance | $1,242,910 | $3,043,954 | $4,133,826 |
7.6 Projected Balance Sheet
We project a strong growth in net worth over the next several years.
| Pro Forma Balance Sheet | |||
| Year 1 | Year 2 | Year 3 | |
| Assets | |||
| Current Assets | |||
| Cash | $1,242,910 | $3,043,954 | $4,133,826 |
| Accounts Receivable | $67,603 | $104,339 | $139,010 |
| Inventory | $89,856 | $143,573 | $189,188 |
| Other Current Assets | $0 | $0 | $0 |
| Total Current Assets | $1,400,369 | $3,291,866 | $4,462,024 |
| Long-term Assets | |||
| Long-term Assets | $0 | $0 | $0 |
| Accumulated Depreciation | $0 | $0 | $0 |
| Total Long-term Assets | $0 | $0 | $0 |
| Total Assets | $1,400,369 | $3,291,866 | $4,462,024 |
| Liabilities and Capital | Year 1 | Year 2 | Year 3 |
| Current Liabilities | |||
| Accounts Payable | $276,001 | $206,109 | $280,160 |
| Current Borrowing | $0 | $0 | $0 |
| Other Current Liabilities | $0 | $0 | $0 |
| Subtotal Current Liabilities | $276,001 | $206,109 | $280,160 |
| Long-term Liabilities | $0 | $0 | $0 |
| Total Liabilities | $276,001 | $206,109 | $280,160 |
| Paid-in Capital | $150,000 | $150,000 | $150,000 |
| Retained Earnings | ($83,000) | $974,368 | $1,435,757 |
| Earnings | $1,057,368 | $1,961,390 | $2,596,108 |
| Total Capital | $1,124,368 | $3,085,757 | $4,181,865 |
| Total Liabilities and Capital | $1,400,369 | $3,291,866 | $4,462,024 |
| Net Worth | $1,124,367 | $3,085,757 | $4,181,864 |
7.7 Business Ratios
These business ratios are limited in value since the company projects no debt. This will also be an advantage if debt capital is desired later without dilution to shareholders. Business ratios for the years of this plan are shown below. Industry profile ratios based on the Standard Industrial Classification (SIC) code 2721, Periodicals, are shown for comparison.
| Ratio Analysis | ||||
| Year 1 | Year 2 | Year 3 | Industry Profile | |
| Sales Growth | 0.00% | 54.34% | 33.23% | -1.70% |
| Percent of Total Assets | ||||
| Accounts Receivable | 4.83% | 3.17% | 3.12% | 25.50% |
| Inventory | 6.42% | 4.36% | 4.24% | 5.40% |
| Other Current Assets | 0.00% | 0.00% | 0.00% | 54.10% |
| Total Current Assets | 100.00% | 100.00% | 100.00% | 85.00% |
| Long-term Assets | 0.00% | 0.00% | 0.00% | 15.00% |
| Total Assets | 100.00% | 100.00% | 100.00% | 100.00% |
| Current Liabilities | 19.71% | 6.26% | 6.28% | 42.30% |
| Long-term Liabilities | 0.00% | 0.00% | 0.00% | 12.30% |
| Total Liabilities | 19.71% | 6.26% | 6.28% | 54.60% |
| Net Worth | 80.29% | 93.74% | 93.72% | 45.40% |
| Percent of Sales | ||||
| Sales | 100.00% | 100.00% | 100.00% | 100.00% |
| Gross Margin | 77.41% | 75.70% | 75.22% | 56.10% |
| Selling, General & Administrative Expenses | 43.32% | 34.73% | 34.52% | 39.70% |
| Advertising Expenses | 12.45% | 1.50% | 1.41% | 1.90% |
| Profit Before Interest and Taxes | 48.70% | 58.53% | 58.15% | 4.20% |
| Main Ratios | ||||
| Current | 5.07 | 15.97 | 15.93 | 2.16 |
| Quick | 4.75 | 15.27 | 15.25 | 1.71 |
| Total Debt to Total Assets | 19.71% | 6.26% | 6.28% | 54.60% |
| Pre-tax Return on Net Worth | 134.34% | 90.80% | 88.69% | 7.40% |
| Pre-tax Return on Assets | 107.87% | 85.12% | 83.12% | 16.20% |
| Additional Ratios | Year 1 | Year 2 | Year 3 | |
| Net Profit Margin | 34.09% | 40.97% | 40.70% | n.a |
| Return on Equity | 94.04% | 63.56% | 62.08% | n.a |
| Activity Ratios | ||||
| Accounts Receivable Turnover | 4.59 | 4.59 | 4.59 | n.a |
| Collection Days | 56 | 66 | 70 | n.a |
| Inventory Turnover | 10.91 | 8.49 | 7.84 | n.a |
| Accounts Payable Turnover | 6.73 | 12.17 | 12.17 | n.a |
| Payment Days | 27 | 35 | 26 | n.a |
| Total Asset Turnover | 2.21 | 1.45 | 1.43 | n.a |
| Debt Ratios | ||||
| Debt to Net Worth | 0.25 | 0.07 | 0.07 | n.a |
| Current Liab. to Liab. | 1.00 | 1.00 | 1.00 | n.a |
| Liquidity Ratios | ||||
| Net Working Capital | $1,124,367 | $3,085,757 | $4,181,864 | n.a |
| Interest Coverage | 0.00 | 0.00 | 0.00 | n.a |
| Additional Ratios | ||||
| Assets to Sales | 0.45 | 0.69 | 0.70 | n.a |
| Current Debt/Total Assets | 20% | 6% | 6% | n.a |
| Acid Test | 4.50 | 14.77 | 14.76 | n.a |
| Sales/Net Worth | 2.76 | 1.55 | 1.53 | n.a |
| Dividend Payout | 0.00 | 0.00 | 0.58 | n.a |
Appendix
| Sales Forecast | |||||||||||||
| Month 1 | Month 2 | Month 3 | Month 4 | Month 5 | Month 6 | Month 7 | Month 8 | Month 9 | Month 10 | Month 11 | Month 12 | ||
| Unit Sales | |||||||||||||
| Mag Subscript Sales 1 Yr | 0% | 0 | 5,000 | 6,500 | 7,500 | 8,000 | 8,000 | 9,000 | 9,000 | 9,000 | 9,000 | 9,000 | 10,000 |
| Mag Subscript Sales 2 Yr | 0% | 0 | 0 | 1,000 | 1,000 | 1,000 | 1,000 | 1,000 | 1,000 | 1,000 | 1,000 | 1,000 | 1,000 |
| Mag Subscript Whsl | 0% | 2,500 | 3,000 | 3,500 | 4,000 | 4,000 | 4,000 | 4,000 | 4,500 | 5,000 | 5,500 | 5,000 | 5,000 |
| Newsstand Sales Whsl | 0% | 0 | 5,000 | 0 | 7,500 | 0 | 10,000 | 0 | 10,000 | 0 | 12,000 | 0 | 12,000 |
| Ad Revenue Pages | 0% | 0 | 15 | 0 | 15 | 0 | 22 | 0 | 22 | 0 | 22 | 0 | 22 |
| Book Sales–Direct | 0% | 0 | 0 | 0 | 1,500 | 0 | 2,000 | 2,500 | 3,500 | 4,000 | 4,000 | 4,000 | 4,000 |
| Boo Sales–Whsl | 0% | 0 | 0 | 0 | 1,500 | 2,000 | 0 | 1,500 | 0 | 0 | 2,000 | 0 | 0 |
| Booklet Sales–Direct | 0% | 0 | 0 | 0 | 0 | 0 | 1,500 | 1,500 | 2,000 | 2,000 | 2,500 | 2,500 | 2,500 |
| Booklet Sales–Whsl | 0% | 0 | 0 | 0 | 0 | 0 | 0 | 0 | 0 | 0 | 0 | 0 | 0 |
| Total Unit Sales | 2,500 | 13,015 | 11,000 | 23,015 | 15,000 | 26,522 | 19,500 | 30,022 | 21,000 | 36,022 | 21,500 | 34,522 | |
| Unit Prices | Month 1 | Month 2 | Month 3 | Month 4 | Month 5 | Month 6 | Month 7 | Month 8 | Month 9 | Month 10 | Month 11 | Month 12 | |
| Mag Subscript Sales 1 Yr | $16.95 | $16.95 | $16.95 | $16.95 | $16.95 | $16.95 | $16.95 | $16.95 | $16.95 | $16.95 | $16.95 | $16.95 | |
| Mag Subscript Sales 2 Yr | $29.95 | $29.95 | $29.95 | $29.95 | $29.95 | $29.95 | $29.95 | $29.95 | $29.95 | $29.95 | $29.95 | $29.95 | |
| Mag Subscript Whsl | $8.50 | $8.50 | $8.50 | $8.50 | $8.50 | $8.50 | $8.50 | $8.50 | $8.50 | $8.50 | $8.50 | $8.50 | |
| Newsstand Sales Whsl | $0.99 | $0.99 | $0.99 | $0.99 | $0.99 | $0.99 | $0.99 | $0.99 | $0.99 | $0.99 | $0.99 | $0.99 | |
| Ad Revenue Pages | $2,182.00 | $2,182.00 | $2,182.00 | $2,182.00 | $2,182.00 | $2,182.00 | $2,182.00 | $2,182.00 | $2,182.00 | $2,182.00 | $2,182.00 | $2,182.00 | |
| Book Sales–Direct | $14.95 | $14.95 | $14.95 | $14.95 | $14.95 | $14.95 | $14.95 | $14.95 | $14.95 | $14.95 | $14.95 | $14.95 | |
| Boo Sales–Whsl | $5.98 | $5.98 | $5.98 | $5.98 | $5.98 | $5.98 | $5.98 | $5.98 | $5.98 | $5.98 | $5.98 | $5.98 | |
| Booklet Sales–Direct | $7.95 | $7.95 | $7.95 | $7.95 | $7.95 | $7.95 | $7.95 | $7.95 | $7.95 | $7.95 | $7.95 | $7.95 | |
| Booklet Sales–Whsl | $3.18 | $3.18 | $3.18 | $3.18 | $3.18 | $3.18 | $3.18 | $3.18 | $3.18 | $3.18 | $3.18 | $3.18 | |
| Sales | |||||||||||||
| Mag Subscript Sales 1 Yr | $0 | $84,750 | $110,175 | $127,125 | $135,600 | $135,600 | $152,550 | $152,550 | $152,550 | $152,550 | $152,550 | $169,500 | |
| Mag Subscript Sales 2 Yr | $0 | $0 | $29,950 | $29,950 | $29,950 | $29,950 | $29,950 | $29,950 | $29,950 | $29,950 | $29,950 | $29,950 | |
| Mag Subscript Whsl | $21,250 | $25,500 | $29,750 | $34,000 | $34,000 | $34,000 | $34,000 | $38,250 | $42,500 | $46,750 | $42,500 | $42,500 | |
| Newsstand Sales Whsl | $0 | $4,950 | $0 | $7,425 | $0 | $9,900 | $0 | $9,900 | $0 | $11,880 | $0 | $11,880 | |
| Ad Revenue Pages | $0 | $32,730 | $0 | $32,730 | $0 | $48,004 | $0 | $48,004 | $0 | $48,004 | $0 | $48,004 | |
| Book Sales–Direct | $0 | $0 | $0 | $22,425 | $0 | $29,900 | $37,375 | $52,325 | $59,800 | $59,800 | $59,800 | $59,800 | |
| Boo Sales–Whsl | $0 | $0 | $0 | $8,970 | $11,960 | $0 | $8,970 | $0 | $0 | $11,960 | $0 | $0 | |
| Booklet Sales–Direct | $0 | $0 | $0 | $0 | $0 | $11,925 | $11,925 | $15,900 | $15,900 | $19,875 | $19,875 | $19,875 | |
| Booklet Sales–Whsl | $0 | $0 | $0 | $0 | $0 | $0 | $0 | $0 | $0 | $0 | $0 | $0 | |
| Total Sales | $21,250 | $147,930 | $169,875 | $262,625 | $211,510 | $299,279 | $274,770 | $346,879 | $300,700 | $380,769 | $304,675 | $381,509 | |
| Direct Unit Costs | Month 1 | Month 2 | Month 3 | Month 4 | Month 5 | Month 6 | Month 7 | Month 8 | Month 9 | Month 10 | Month 11 | Month 12 | |
| Mag Subscript Sales 1 Yr | 0.00% | $2.40 | $2.40 | $2.40 | $2.40 | $2.40 | $2.40 | $2.40 | $2.40 | $2.40 | $2.40 | $2.40 | $2.40 |
| Mag Subscript Sales 2 Yr | 0.00% | $4.80 | $4.80 | $4.80 | $4.80 | $4.80 | $4.80 | $4.80 | $4.80 | $4.80 | $4.80 | $4.80 | $4.80 |
| Mag Subscript Whsl | 0.00% | $2.40 | $2.40 | $2.40 | $2.40 | $2.40 | $2.40 | $2.40 | $2.40 | $2.40 | $2.40 | $2.40 | $2.40 |
| Newsstand Sales Whsl | 0.00% | $0.40 | $0.40 | $0.40 | $0.40 | $0.40 | $0.40 | $0.40 | $0.40 | $0.40 | $0.40 | $0.40 | $0.40 |
| Ad Revenue Pages | 0.00% | $637.00 | $637.00 | $637.00 | $637.00 | $763.00 | $763.00 | $763.00 | $763.00 | $916.00 | $916.00 | $916.00 | $916.00 |
| Book Sales–Direct | 0.00% | $2.99 | $2.99 | $2.99 | $2.99 | $2.99 | $2.99 | $2.99 | $2.99 | $2.99 | $2.99 | $2.99 | $2.99 |
| Boo Sales–Whsl | 0.00% | $2.99 | $2.99 | $2.99 | $2.99 | $2.99 | $2.99 | $2.99 | $2.99 | $2.99 | $2.99 | $2.99 | $2.99 |
| Booklet Sales–Direct | 0.00% | $1.59 | $1.59 | $1.59 | $1.59 | $1.59 | $1.59 | $1.59 | $1.59 | $1.59 | $1.59 | $1.59 | $1.59 |
| Booklet Sales–Whsl | 0.00% | $1.59 | $1.59 | $1.59 | $1.59 | $1.59 | $1.59 | $1.59 | $1.59 | $1.59 | $1.59 | $1.59 | $1.59 |
| Direct Cost of Sales | |||||||||||||
| Mag Subscript Sales 1 Yr | $0 | $12,000 | $15,600 | $18,000 | $19,200 | $19,200 | $21,600 | $21,600 | $21,600 | $21,600 | $21,600 | $24,000 | |
| Mag Subscript Sales 2 Yr | $0 | $0 | $4,800 | $4,800 | $4,800 | $4,800 | $4,800 | $4,800 | $4,800 | $4,800 | $4,800 | $4,800 | |
| Mag Subscript Whsl | $6,000 | $7,200 | $8,400 | $9,600 | $9,600 | $9,600 | $9,600 | $10,800 | $12,000 | $13,200 | $12,000 | $12,000 | |
| Newsstand Sales Whsl | $0 | $2,000 | $0 | $3,000 | $0 | $4,000 | $0 | $4,000 | $0 | $4,800 | $0 | $4,800 | |
| Ad Revenue Pages | $0 | $9,555 | $0 | $9,555 | $0 | $16,786 | $0 | $16,786 | $0 | $20,152 | $0 | $20,152 | |
| Book Sales–Direct | $0 | $0 | $0 | $4,485 | $0 | $5,980 | $7,475 | $10,465 | $11,960 | $11,960 | $11,960 | $11,960 | |
| Boo Sales–Whsl | $0 | $0 | $0 | $4,485 | $5,980 | $0 | $4,485 | $0 | $0 | $5,980 | $0 | $0 | |
| Booklet Sales–Direct | $0 | $0 | $0 | $0 | $0 | $2,385 | $2,385 | $3,180 | $3,180 | $3,975 | $3,975 | $3,975 | |
| Booklet Sales–Whsl | $0 | $0 | $0 | $0 | $0 | $0 | $0 | $0 | $0 | $0 | $0 | $0 | |
| Subtotal Direct Cost of Sales | $6,000 | $30,755 | $28,800 | $53,925 | $39,580 | $62,751 | $50,345 | $71,631 | $53,540 | $86,467 | $54,335 | $81,687 | |
| Personnel Plan | |||||||||||||
| Month 1 | Month 2 | Month 3 | Month 4 | Month 5 | Month 6 | Month 7 | Month 8 | Month 9 | Month 10 | Month 11 | Month 12 | ||
| Production Personnel | |||||||||||||
| Name or Title or Group | $0 | $0 | $0 | $0 | $0 | $0 | $0 | $0 | $0 | $0 | $0 | $0 | |
| Name or Title or Group | $0 | $0 | $0 | $0 | $0 | $0 | $0 | $0 | $0 | $0 | $0 | $0 | |
| Subtotal | $0 | $0 | $0 | $0 | $0 | $0 | $0 | $0 | $0 | $0 | $0 | $0 | |
| Sales and Marketing Personnel | |||||||||||||
| Ad Sales Mgr. | $3,000 | $3,000 | $3,000 | $3,000 | $3,000 | $3,000 | $3,000 | $3,000 | $3,000 | $3,000 | $3,000 | $3,000 | |
| Subscription Mgr. | $0 | $0 | $0 | $0 | $0 | $0 | $2,500 | $2,500 | $2,500 | $2,500 | $2,500 | $2,500 | |
| Subtotal | $3,000 | $3,000 | $3,000 | $3,000 | $3,000 | $3,000 | $5,500 | $5,500 | $5,500 | $5,500 | $5,500 | $5,500 | |
| General and Administrative Personnel | |||||||||||||
| Red Brushwielder, CEO | $5,000 | $5,000 | $5,000 | $5,000 | $5,000 | $5,000 | $5,000 | $5,000 | $5,000 | $5,000 | $5,000 | $5,000 | |
| Ochre & Sienna Burnt, Exec. Editors | $4,400 | $4,400 | $4,400 | $4,400 | $4,400 | $4,400 | $4,400 | $4,400 | $4,400 | $4,400 | $4,400 | $4,400 | |
| John Crimson, CFO | $1,000 | $1,000 | $1,000 | $1,000 | $1,000 | $1,000 | $1,000 | $1,000 | $1,000 | $1,000 | $1,000 | $1,000 | |
| Exec. Asst. | $0 | $0 | $0 | $2,000 | $2,000 | $2,000 | $2,000 | $2,000 | $2,000 | $2,000 | $2,000 | $2,000 | |
| Timothy Clark, VP Corp. Dev. | $1,500 | $1,500 | $1,500 | $1,500 | $1,500 | $1,500 | $1,500 | $1,500 | $1,500 | $1,500 | $1,500 | $1,500 | |
| Subtotal | $11,900 | $11,900 | $11,900 | $13,900 | $13,900 | $13,900 | $13,900 | $13,900 | $13,900 | $13,900 | $13,900 | $13,900 | |
| Other Personnel | |||||||||||||
| Art Director | $4,400 | $4,400 | $4,400 | $4,400 | $4,400 | $4,400 | $4,400 | $4,400 | $4,400 | $4,400 | $4,400 | $4,400 | |
| Freelance Artist | $500 | $500 | $500 | $500 | $500 | $500 | $500 | $500 | $500 | $500 | $500 | $500 | |
| Bookkeeper | $450 | $450 | $450 | $450 | $450 | $450 | $450 | $450 | $450 | $450 | $450 | $450 | |
| Subtotal | $5,350 | $5,350 | $5,350 | $5,350 | $5,350 | $5,350 | $5,350 | $5,350 | $5,350 | $5,350 | $5,350 | $5,350 | |
| Total People | 8 | 8 | 8 | 8 | 9 | 9 | 10 | 10 | 10 | 10 | 10 | 10 | |
| Total Payroll | $20,250 | $20,250 | $20,250 | $22,250 | $22,250 | $22,250 | $24,750 | $24,750 | $24,750 | $24,750 | $24,750 | $24,750 | |
| Pro Forma Profit and Loss | |||||||||||||
| Month 1 | Month 2 | Month 3 | Month 4 | Month 5 | Month 6 | Month 7 | Month 8 | Month 9 | Month 10 | Month 11 | Month 12 | ||
| Sales | $21,250 | $147,930 | $169,875 | $262,625 | $211,510 | $299,279 | $274,770 | $346,879 | $300,700 | $380,769 | $304,675 | $381,509 | |
| Direct Cost of Sales | $6,000 | $30,755 | $28,800 | $53,925 | $39,580 | $62,751 | $50,345 | $71,631 | $53,540 | $86,467 | $54,335 | $81,687 | |
| Production Payroll | $0 | $0 | $0 | $0 | $0 | $0 | $0 | $0 | $0 | $0 | $0 | $0 | |
| Author’s Royalties: 15% | $0 | $0 | $0 | $4,709 | $1,794 | $6,274 | $8,741 | $10,234 | $11,355 | $13,745 | $11,951 | $11,951 | |
| Total Cost of Sales | $6,000 | $30,755 | $28,800 | $58,634 | $41,374 | $69,025 | $59,086 | $81,865 | $64,895 | $100,212 | $66,286 | $93,638 | |
| Gross Margin | $15,250 | $117,175 | $141,075 | $203,991 | $170,136 | $230,254 | $215,685 | $265,014 | $235,805 | $280,557 | $238,389 | $287,871 | |
| Gross Margin % | 71.76% | 79.21% | 83.05% | 77.67% | 80.44% | 76.94% | 78.50% | 76.40% | 78.42% | 73.68% | 78.24% | 75.46% | |
| Operating Expenses | |||||||||||||
| Sales and Marketing Expenses | |||||||||||||
| Sales and Marketing Payroll | $3,000 | $3,000 | $3,000 | $3,000 | $3,000 | $3,000 | $5,500 | $5,500 | $5,500 | $5,500 | $5,500 | $5,500 | |
| Advertising/Promotion | $3,000 | $38,724 | $3,000 | $38,724 | $3,000 | $62,947 | $4,800 | $62,947 | $4,800 | $79,717 | $4,800 | $79,717 | |
| Travel | $500 | $500 | $500 | $500 | $500 | $500 | $750 | $750 | $750 | $750 | $750 | $750 | |
| Entertainment & Meals | $200 | $200 | $200 | $200 | $200 | $200 | $200 | $200 | $200 | $200 | $200 | $200 | |
| Miscellaneous | $1,000 | $1,000 | $1,000 | $1,000 | $1,000 | $1,000 | $1,000 | $1,000 | $1,000 | $1,000 | $1,000 | $1,000 | |
| Total Sales and Marketing Expenses | $7,700 | $43,424 | $7,700 | $43,424 | $7,700 | $67,647 | $12,250 | $70,397 | $12,250 | $87,167 | $12,250 | $87,167 | |
| Sales and Marketing % | 36.24% | 29.35% | 4.53% | 16.53% | 3.64% | 22.60% | 4.46% | 20.29% | 4.07% | 22.89% | 4.02% | 22.85% | |
| General and Administrative Expenses | |||||||||||||
| General and Administrative Payroll | $11,900 | $11,900 | $11,900 | $13,900 | $13,900 | $13,900 | $13,900 | $13,900 | $13,900 | $13,900 | $13,900 | $13,900 | |
| Marketing/Promotion | $0 | $0 | $0 | $0 | $0 | $0 | $0 | $0 | $0 | $0 | $0 | $0 | |
| Depreciation | $0 | $0 | $0 | $0 | $0 | $0 | $0 | $0 | $0 | $0 | $0 | $0 | |
| Leased Equipment | $850 | $850 | $850 | $850 | $850 | $850 | $850 | $850 | $850 | $850 | $850 | $850 | |
| Telephone | $600 | $600 | $600 | $600 | $600 | $600 | $600 | $600 | $600 | $600 | $600 | $600 | |
| Postage | $300 | $13,950 | $300 | $13,950 | $300 | $23,250 | $300 | $23,250 | $300 | $31,000 | $300 | $31,000 | |
| Rent | $2,500 | $2,500 | $2,500 | $2,500 | $2,500 | $2,500 | $2,500 | $2,500 | $2,500 | $2,500 | $2,500 | $2,500 | |
| Utilities | $750 | $750 | $750 | $750 | $750 | $750 | $750 | $750 | $750 | $750 | $750 | $750 | |
| Insurance | $1,000 | $1,000 | $1,000 | $1,000 | $1,000 | $1,000 | $1,000 | $1,000 | $1,000 | $1,000 | $1,000 | $1,000 | |
| Payroll Taxes | 20% | $0 | $0 | $0 | $0 | $0 | $0 | $0 | $0 | $0 | $0 | $0 | $0 |
| Other General and Administrative Expenses | $0 | $0 | $0 | $0 | $0 | $0 | $0 | $0 | $0 | $0 | $0 | $0 | |
| Total General and Administrative Expenses | $17,900 | $31,550 | $17,900 | $33,550 | $19,900 | $42,850 | $19,900 | $42,850 | $19,900 | $50,600 | $19,900 | $50,600 | |
| General and Administrative % | 84.24% | 21.33% | 10.54% | 12.77% | 9.41% | 14.32% | 7.24% | 12.35% | 6.62% | 13.29% | 6.53% | 13.26% | |
| Other Expenses: | |||||||||||||
| Other Payroll | $5,350 | $5,350 | $5,350 | $5,350 | $5,350 | $5,350 | $5,350 | $5,350 | $5,350 | $5,350 | $5,350 | $5,350 | |
| Consultants | $0 | $0 | $0 | $0 | $0 | $0 | $0 | $0 | $0 | $0 | $0 | $0 | |
| Other Expenses | $0 | $0 | $0 | $0 | $0 | $0 | $0 | $0 | $0 | $0 | $0 | $0 | |
| Total Other Expenses | $5,350 | $5,350 | $5,350 | $5,350 | $5,350 | $5,350 | $5,350 | $5,350 | $5,350 | $5,350 | $5,350 | $5,350 | |
| Other % | 25.18% | 3.62% | 3.15% | 2.04% | 2.53% | 1.79% | 1.95% | 1.54% | 1.78% | 1.41% | 1.76% | 1.40% | |
| Total Operating Expenses | $30,950 | $80,324 | $30,950 | $82,324 | $32,950 | $115,847 | $37,500 | $118,597 | $37,500 | $143,117 | $37,500 | $143,117 | |
| Profit Before Interest and Taxes | ($15,700) | $36,851 | $110,125 | $121,667 | $137,186 | $114,407 | $178,185 | $146,417 | $198,305 | $137,440 | $200,889 | $144,754 | |
| EBITDA | ($15,700) | $36,851 | $110,125 | $121,667 | $137,186 | $114,407 | $178,185 | $146,417 | $198,305 | $137,440 | $200,889 | $144,754 | |
| Interest Expense | $0 | $0 | $0 | $0 | $0 | $0 | $0 | $0 | $0 | $0 | $0 | $0 | |
| Taxes Incurred | ($4,710) | $11,055 | $33,038 | $36,500 | $41,156 | $34,322 | $53,455 | $43,925 | $59,492 | $41,232 | $60,267 | $43,426 | |
| Net Profit | ($10,990) | $25,796 | $77,088 | $85,167 | $96,030 | $80,085 | $124,729 | $102,492 | $138,814 | $96,208 | $140,622 | $101,328 | |
| Net Profit/Sales | -51.72% | 17.44% | 45.38% | 32.43% | 45.40% | 26.76% | 45.39% | 29.55% | 46.16% | 25.27% | 46.15% | 26.56% | |
| Pro Forma Cash Flow | |||||||||||||
| Month 1 | Month 2 | Month 3 | Month 4 | Month 5 | Month 6 | Month 7 | Month 8 | Month 9 | Month 10 | Month 11 | Month 12 | ||
| Cash Received | |||||||||||||
| Cash from Operations | |||||||||||||
| Cash Sales | $19,125 | $133,137 | $152,888 | $236,363 | $190,359 | $269,351 | $247,293 | $312,191 | $270,630 | $342,692 | $274,208 | $343,358 | |
| Cash from Receivables | $0 | $71 | $2,547 | $14,866 | $17,297 | $26,092 | $21,444 | $29,846 | $27,717 | $34,534 | $30,337 | $37,823 | |
| Subtotal Cash from Operations | $19,125 | $133,208 | $155,435 | $251,229 | $207,656 | $295,443 | $268,737 | $342,037 | $298,347 | $377,226 | $304,544 | $381,181 | |
| Additional Cash Received | |||||||||||||
| Sales Tax, VAT, HST/GST Received | 0.00% | $0 | $0 | $0 | $0 | $0 | $0 | $0 | $0 | $0 | $0 | $0 | $0 |
| New Current Borrowing | $0 | $0 | $0 | $0 | $0 | $0 | $0 | $0 | $0 | $0 | $0 | $0 | |
| New Other Liabilities (interest-free) | $0 | $0 | $0 | $0 | $0 | $0 | $0 | $0 | $0 | $0 | $0 | $0 | |
| New Long-term Liabilities | $0 | $0 | $0 | $0 | $0 | $0 | $0 | $0 | $0 | $0 | $0 | $0 | |
| Sales of Other Current Assets | $0 | $0 | $0 | $0 | $0 | $0 | $0 | $0 | $0 | $0 | $0 | $0 | |
| Sales of Long-term Assets | $0 | $0 | $0 | $0 | $0 | $0 | $0 | $0 | $0 | $0 | $0 | $0 | |
| New Investment Received | $0 | $0 | $0 | $0 | $0 | $0 | $0 | $0 | $0 | $0 | $0 | $0 | |
| Subtotal Cash Received | $19,125 | $133,208 | $155,435 | $251,229 | $207,656 | $295,443 | $268,737 | $342,037 | $298,347 | $377,226 | $304,544 | $381,181 | |
| Expenditures | Month 1 | Month 2 | Month 3 | Month 4 | Month 5 | Month 6 | Month 7 | Month 8 | Month 9 | Month 10 | Month 11 | Month 12 | |
| Expenditures from Operations | |||||||||||||
| Cash Spending | $20,250 | $20,250 | $20,250 | $22,250 | $22,250 | $22,250 | $24,750 | $24,750 | $24,750 | $24,750 | $24,750 | $24,750 | |
| Bill Payments | $620 | $22,274 | $127,157 | $74,136 | $179,333 | $82,283 | $218,739 | $116,024 | $238,858 | $123,196 | $289,628 | $110,010 | |
| Subtotal Spent on Operations | $20,870 | $42,524 | $147,407 | $96,386 | $201,583 | $104,533 | $243,489 | $140,774 | $263,608 | $147,946 | $314,378 | $134,760 | |
| Additional Cash Spent | |||||||||||||
| Sales Tax, VAT, HST/GST Paid Out | $0 | $0 | $0 | $0 | $0 | $0 | $0 | $0 | $0 | $0 | $0 | $0 | |
| Principal Repayment of Current Borrowing | $0 | $0 | $0 | $0 | $0 | $0 | $0 | $0 | $0 | $0 | $0 | $0 | |
| Other Liabilities Principal Repayment | $0 | $0 | $0 | $0 | $0 | $0 | $0 | $0 | $0 | $0 | $0 | $0 | |
| Long-term Liabilities Principal Repayment | $0 | $0 | $0 | $0 | $0 | $0 | $0 | $0 | $0 | $0 | $0 | $0 | |
| Purchase Other Current Assets | $0 | $0 | $0 | $0 | $0 | $0 | $0 | $0 | $0 | $0 | $0 | $0 | |
| Purchase Long-term Assets | $0 | $0 | $0 | $0 | $0 | $0 | $0 | $0 | $0 | $0 | $0 | $0 | |
| Dividends | $0 | $0 | $0 | $0 | $0 | $0 | $0 | $0 | $0 | $0 | $0 | $0 | |
| Subtotal Cash Spent | $20,870 | $42,524 | $147,407 | $96,386 | $201,583 | $104,533 | $243,489 | $140,774 | $263,608 | $147,946 | $314,378 | $134,760 | |
| Net Cash Flow | ($1,745) | $90,684 | $8,028 | $154,843 | $6,073 | $190,910 | $25,247 | $201,263 | $34,740 | $229,280 | ($9,834) | $246,422 | |
| Cash Balance | $65,255 | $155,939 | $163,967 | $318,810 | $324,883 | $515,793 | $541,040 | $742,303 | $777,043 | $1,006,323 | $996,489 | $1,242,910 | |
| Pro Forma Balance Sheet | |||||||||||||
| Month 1 | Month 2 | Month 3 | Month 4 | Month 5 | Month 6 | Month 7 | Month 8 | Month 9 | Month 10 | Month 11 | Month 12 | ||
| Assets | Starting Balances | ||||||||||||
| Current Assets | |||||||||||||
| Cash | $67,000 | $65,255 | $155,939 | $163,967 | $318,810 | $324,883 | $515,793 | $541,040 | $742,303 | $777,043 | $1,006,323 | $996,489 | $1,242,910 |
| Accounts Receivable | $0 | $2,125 | $16,847 | $31,287 | $42,684 | $46,538 | $50,374 | $56,407 | $61,249 | $63,602 | $67,145 | $67,275 | $67,603 |
| Inventory | $0 | $6,600 | $33,831 | $31,680 | $59,318 | $43,538 | $69,026 | $55,380 | $78,794 | $58,894 | $95,114 | $59,769 | $89,856 |
| Other Current Assets | $0 | $0 | $0 | $0 | $0 | $0 | $0 | $0 | $0 | $0 | $0 | $0 | $0 |
| Total Current Assets | $67,000 | $73,980 | $206,617 | $226,934 | $420,811 | $414,959 | $635,193 | $652,827 | $882,346 | $899,538 | $1,168,581 | $1,123,532 | $1,400,369 |
| Long-term Assets | |||||||||||||
| Long-term Assets | $0 | $0 | $0 | $0 | $0 | $0 | $0 | $0 | $0 | $0 | $0 | $0 | $0 |
| Accumulated Depreciation | $0 | $0 | $0 | $0 | $0 | $0 | $0 | $0 | $0 | $0 | $0 | $0 | $0 |
| Total Long-term Assets | $0 | $0 | $0 | $0 | $0 | $0 | $0 | $0 | $0 | $0 | $0 | $0 | $0 |
| Total Assets | $67,000 | $73,980 | $206,617 | $226,934 | $420,811 | $414,959 | $635,193 | $652,827 | $882,346 | $899,538 | $1,168,581 | $1,123,532 | $1,400,369 |
| Liabilities and Capital | Month 1 | Month 2 | Month 3 | Month 4 | Month 5 | Month 6 | Month 7 | Month 8 | Month 9 | Month 10 | Month 11 | Month 12 | |
| Current Liabilities | |||||||||||||
| Accounts Payable | $0 | $17,970 | $124,811 | $68,041 | $176,751 | $74,869 | $215,018 | $107,923 | $234,950 | $113,329 | $286,163 | $100,492 | $276,001 |
| Current Borrowing | $0 | $0 | $0 | $0 | $0 | $0 | $0 | $0 | $0 | $0 | $0 | $0 | $0 |
| Other Current Liabilities | $0 | $0 | $0 | $0 | $0 | $0 | $0 | $0 | $0 | $0 | $0 | $0 | $0 |
| Subtotal Current Liabilities | $0 | $17,970 | $124,811 | $68,041 | $176,751 | $74,869 | $215,018 | $107,923 | $234,950 | $113,329 | $286,163 | $100,492 | $276,001 |
| Long-term Liabilities | $0 | $0 | $0 | $0 | $0 | $0 | $0 | $0 | $0 | $0 | $0 | $0 | $0 |
| Total Liabilities | $0 | $17,970 | $124,811 | $68,041 | $176,751 | $74,869 | $215,018 | $107,923 | $234,950 | $113,329 | $286,163 | $100,492 | $276,001 |
| Paid-in Capital | $150,000 | $150,000 | $150,000 | $150,000 | $150,000 | $150,000 | $150,000 | $150,000 | $150,000 | $150,000 | $150,000 | $150,000 | $150,000 |
| Retained Earnings | ($83,000) | ($83,000) | ($83,000) | ($83,000) | ($83,000) | ($83,000) | ($83,000) | ($83,000) | ($83,000) | ($83,000) | ($83,000) | ($83,000) | ($83,000) |
| Earnings | $0 | ($10,990) | $14,806 | $91,893 | $177,060 | $273,090 | $353,175 | $477,904 | $580,396 | $719,210 | $815,418 | $956,040 | $1,057,368 |
| Total Capital | $67,000 | $56,010 | $81,806 | $158,893 | $244,060 | $340,090 | $420,175 | $544,904 | $647,396 | $786,210 | $882,418 | $1,023,040 | $1,124,368 |
| Total Liabilities and Capital | $67,000 | $73,980 | $206,617 | $226,934 | $420,811 | $414,959 | $635,193 | $652,827 | $882,346 | $899,538 | $1,168,581 | $1,123,532 | $1,400,369 |
| Net Worth | $67,000 | $56,010 | $81,806 | $158,893 | $244,060 | $340,090 | $420,175 | $544,904 | $647,396 | $786,210 | $882,418 | $1,023,040 | $1,124,367 |

