
Machine Tooling
Executive Summary
Machine Tooling is a Kansas City, Kansas based company, whose mission is to be successful by effectively utilizing the philosophies of high quality, advanced techniques, and customer service.
Over the past two years, Machine Tooling has worked very hard to build its infrastructure and the systems to handle a significant amount of business. We have worked aggressively to construct walls, make electrical advancements, and other leasehold improvements to establish the business. Additionally, the company has configured a staff who is equipped to handle many tasks. These individuals are highly qualified and experienced.
The company has designed and built machines and automated systems that are ready for market. To compliment this, we have developed strong working relationships with our customers and plan to further this area by continuing to offer customers value-added improvements and vertically-integrate the business to support these improvements.
Machine Tooling has a management team with direct knowledge of the industry, extensive research experience, and unique administrative skills. The company’s management team consists of people with broad backgrounds in manufacturing, automation, and finance. The management staff consists of Mr. Peter Newton, CEO, Mr. John Abbot, president, and Mr. Chris Manuel, vice president of Marketing.
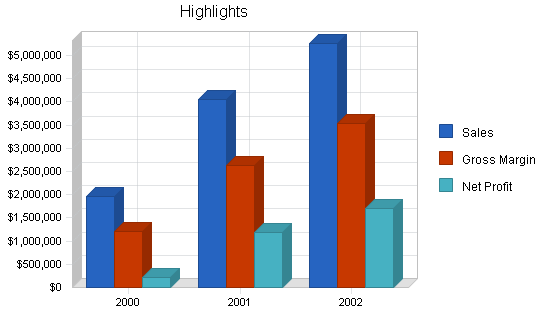
Projected revenues for Year 1 to Year 3 are $1.9 million, $4.1 million, and $5.3 million, respectively. To continue in a steady pattern of growth, Machine Tooling plans to attract a larger customer base and be in a more attractive negotiating position. To provide the financial strength needed for the company to achieve its goals, Machine Tooling has decided to go public.
The company is seeking $500,000 for expansion purposes. These include:
- Marketing of new product lines.
- Growth into new markets.
- Purchasing additional equipment.
Going public will have a positive effect on Machine Tooling’s sales ability. Replacing the company’s debt will afford the opportunity to reduce the overall burden rate. This will give Machine Tooling a competitive advantage when compared to similar-sized companies because they are carrying debt. With this expansion and improved burden rate, Machine Tooling will be a stronger force in the manufacturing industry marketplace. The financial strength that will be achieved with this type of expansion will give Machine Tooling the capacity to establish a larger, more diversified customer base which will generate increased sales revenue. This is an exponential growth opportunity for the company.
1.1 Mission
The company’s mission is to be successful by effectively utilizing the philosophies of high quality, advanced techniques, and customer service.
1.2 Keys to Success
It is important that the company continues to provide superb customer service and fast delivery. At the same time, the company’s further success will depend on securing new customers in the served market niches.
Company Summary
Business Description
Machine Tooling has been operating in Kansas City since May, 1989. We are a Kansas Limited Liability Company (LLC). The company occupies 10,000 square feet of manufacturing area, including offices for administration, engineering, and a quality assurance area.
Overview of Technology and Products
Machine Tooling was formed to provide full-service, close-tolerance contract machining of machine and tooling components, production machining, and automation of production lines. The diverse manufacturing equipment at our facility accommodates versatility and allows the plant to operate self sufficiently.
Managerial expertise and industry experience have helped the company to show profits every year since its inception. During the last three years, the company further entrenched its position in its market niche, which resulted in healthy financials that can be seen in Table 2.1.
2.1 Company History
Machine Tooling was founded in Kansas City in 1989 on the basis of providing quality machine tools for selected industries. The owners had worked in this field for several years and had established multiple business contacts who helped the company pick up major business accounts. By 1999, the company’s revenues reached $1.5 million, and the management realized that further company growth would be difficult without securing additional working capital. To be less debt-dependent, the management has decided to go public. However, before the company issues the initial public offering (IPO), Machine Tooling currently seeks $500,000 for expansion purposes. Such expansion will improve the company’s sales ability and positively affect its IPO prospects.
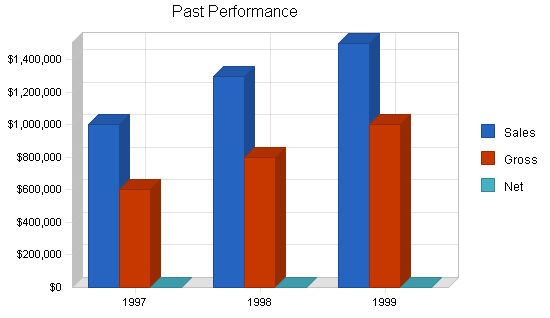
| Past Performance | |||
| 1997 | 1998 | 1999 | |
| Sales | $1,000,000 | $1,300,000 | $1,500,000 |
| Gross Margin | $600,000 | $800,000 | $1,000,000 |
| Gross Margin % | 60.00% | 61.54% | 66.67% |
| Operating Expenses | $400,000 | $550,000 | $700,000 |
| Collection Period (days) | 19 | 22 | 34 |
| Inventory Turnover | 3.00 | 3.00 | 3.00 |
| Balance Sheet | |||
| 1997 | 1998 | 1999 | |
| Current Assets | |||
| Cash | $20,000 | $40,000 | $60,000 |
| Accounts Receivable | $40,000 | $80,000 | $130,000 |
| Inventory | $30,000 | $60,000 | $90,000 |
| Other Current Assets | $5,000 | $10,000 | $15,000 |
| Total Current Assets | $95,000 | $190,000 | $295,000 |
| Long-term Assets | |||
| Long-term Assets | $100,000 | $100,000 | $100,000 |
| Accumulated Depreciation | $10,000 | $20,000 | $30,000 |
| Total Long-term Assets | $90,000 | $80,000 | $70,000 |
| Total Assets | $185,000 | $270,000 | $365,000 |
| Current Liabilities | |||
| Accounts Payable | $25,000 | $50,000 | $75,000 |
| Current Borrowing | $15,000 | $35,000 | $50,000 |
| Other Current Liabilities (interest free) | $5,000 | $5,000 | $10,000 |
| Total Current Liabilities | $45,000 | $90,000 | $135,000 |
| Long-term Liabilities | $50,000 | $50,000 | $50,000 |
| Total Liabilities | $95,000 | $140,000 | $185,000 |
| Paid-in Capital | $50,000 | $50,000 | $50,000 |
| Retained Earnings | $40,000 | $80,000 | $130,000 |
| Earnings | $0 | $0 | $0 |
| Total Capital | $90,000 | $130,000 | $180,000 |
| Total Capital and Liabilities | $185,000 | $270,000 | $365,000 |
| Other Inputs | |||
| Payment Days | 30 | 30 | 30 |
| Sales on Credit | $750,000 | $1,000,000 | $1,125,000 |
| Receivables Turnover | 18.75 | 12.50 | 8.65 |
Products
Background on Products and Technology
Machine Tooling is planning to assemble the first level of the armature assembly. Laminates will be assembled to rotors and shipped daily to supplement customer production. This will take place in the second quarter of 2000. An elite team of professionals experienced in this industry and this type of product has been put together to drive this project.
The Machine Tooling Engineering group will continue to support internal and external automation contributing to production type sales and value engineering. They will co-engineer the next generation of food processing equipment, and will also pursue the building and assembly of the food processing machinery product line that the company now manufactures the components of:
- Rotor shafts.
- Specialized manufacturing service.
- Food processing equipment.
- Engineering service.
- Assembly machinery.
Market Analysis Summary
Overview U.S. machine tool industry (Provided by Standard & Poor’s)
The U.S. machine tool industry is in a period of relative stability, although industry size, employment, and revenues typically fluctuate in response to swings in the business cycle. The number of industry establishments stands at approximately 600, according to U.S. Census Bureau data. These producers are concentrated in several midwestern and northeastern states: Ohio, Michigan, and Illinois have the greatest concentration of industry establishments.
The composition of the industry has changed since the beginning of the 1990s as a result of consolidation and foreign investment. A spate of buyouts and acquisitions occurred in the early to middle 1990s, and a number of privately-held companies became publicly owned. A wave of investment by the European automotive industry spurred similar investments by continental machine-tool producers, which established U.S. production facilities to supply their primary customer group. Japanese investment also picked up in the first half of the decade, driven by the strong yen. The newcomers joined a contingent of Japanese machine-tool manufacturers that had established U.S. production facilities in the 1980s in response to U.S. import restrictions that have since been lifted.
A strong commitment to exporting and the sustained expansion of the U.S. economy are key elements in the machine tool industry’s newfound stability. Changes in the automotive sector are also important. The automotive industry is far less cyclical than it was in the past. Auto makers are undertaking more frequent and less extensive design changes and are becoming globalized, tailoring their products to individual markets. This has led to ongoing investment programs rather than concentrated purchasing cycles. The increasing globalization of the automotive sector is encouraging a similar trend among machine tool suppliers. U.S. machine tool companies are increasing their worldwide presence, often through joint ventures, cooperative agreements, and strategic alliances. The countries that have attracted the largest industry investment to date are Mexico, Brazil, India, and China.

4.1 Market Segmentation
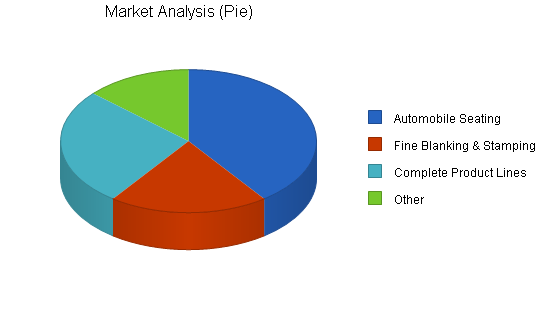
The company’s target customers:
- Automobile seating manufacturers. These customers require customized machine tools to better serve their clients.
- Fine blanking and stamping manufacturers. These customers have a strong need for specialized manufacturing services.
- Manufacturers of complete product lines. Value adding assembly is most required by this customer segment.
The table and chart below outline the total market potential and estimated growth rates for the type of products manufactured by Machine Tooling.
| Market Analysis | |||||||
| 2000 | 2001 | 2002 | 2003 | 2004 | |||
| Potential Customers | Growth | CAGR | |||||
| Automobile Seating | 2% | 300 | 306 | 312 | 318 | 324 | 1.94% |
| Fine Blanking & Stamping | 1% | 150 | 152 | 154 | 156 | 158 | 1.31% |
| Complete Product Lines | 1% | 200 | 202 | 204 | 206 | 208 | 0.99% |
| Other | 0% | 100 | 100 | 100 | 100 | 100 | 0.00% |
| Total | 1.31% | 750 | 760 | 770 | 780 | 790 | 1.31% |
4.2 Target Market Segment Strategy
Machine Tooling will focus our market offerings on three major customer groups:
- Automobile seating manufacturers.
- Fine blanking and stamping manufacturers.
- Manufactures of complete product lines.
Our market research shows that these customer segments are the most demanding in terms of the engineering, technical service support, and automated design. Machine Tooling is particularly strong in these areas and will utilize our capacities to serve these clients. The company will seek customers who require production of components used in upper-end product lines. This will provide a further possibility for Machine Tooling to offer our value-added engineering services.
4.2.1 Market Needs
Each of the served segment’s market needs are shaped by the desire to procure quality products at reasonable prices. Machine Tooling is in the position to offer just that to our clientele, and we understand that our products must help our clients to better add value to their own end customers.
4.2.2 Market Growth
Annual U.S. machine tool product shipments have grown for the last four years, topping $46.5 billion in 1997. This trend was expected to hold with 1998 shipments on track to exceed $7.1 billion, an increase of nine percent in current dollars (seven percent in constant dollars). Industry exports reflect a similar pattern of growth. U.S. machine tool exports reflect a similar pattern of growth. U.S. machine tool exports climbed to over $2.8 billion in 1997 and were expected to rise four percent in 1998 to more than $3 billion. With continued growth projected for the U.S. economy, U.S. machine tool producers have reason to be optimistic. Machine tools purchases historically are driven by economic prosperity. The industry’s upward trend is expected to continue for several more years, in parallel with the domestic economy’s projected sustained growth. Product shipments of machine tools, expressed in constant dollars, are forecast to increase two percent in 1999.
U.S. machine tool manufacturers can expect moderate growth in shipments during the period of 1999-2003. Projections call for annual increases of approximately four percent. The rising demand for capital equipment will be driven by manufacturers’ need to improve productivity, increase capacity, and cut labor costs. Price increases will be virtually nonexistent as manufacturers continue to place strong price pressure on machine tool suppliers. The metal cutting sector is expected to be somewhat stronger than the metal forming sector.
The most active customer markets for U.S. machine tool builders in the near future will be the aerospace, appliance, automotive, farm machinery, and job shop industries. Demand will be particularly robust among job shops. The nation’s tool and die businesses are in a retooling mode, investing in a range of new, high-technology equipment to improve quality and precision. Job shops are increasing and widening their machining capabilities, particularly in areas such as high-speed cutting and laser, waterjet, and rapid prototyping technologies. The trend toward outsourcing by a range of producers, most notably the automotive industry, will further increase this sector’s demand.
Prospects for export markets are less secure. Key markets that are expected to be soft in the near future include the weakened Pacific Rim region and the European Union, where the introduction of a common European currency in select countries is creating uncertainty. As a result, slower growth in exports is likely, as well as an increase in the U.S. machine tool trade deficit. Machine tool exports are expected to grow by three percent annually in the period 1999-2003. The strongest markets for U.S. machine tool exporters will be Canada, Mexico, Chile, Argentina, and Brazil.
4.3 Industry Analysis
Market 1 – Metal cutting tools
In 1997, shipments from production machinery industries totaled nearly $82 billion. The largest subsectors, in constant-dollar terms, were air conditioning, refrigeration and heating (31.8%), construction machinery (27.2%), and farm machinery (17.1%).
Industry: Metalworking machinery, nec.
Establishments that are primarily engaged in manufacturing metalworking machinery, not elsewhere classified.
Market Size Statistics
| Estimated number of U.S. establishments | 674 |
| Number of people employed in this industry | 15,596 |
| Total annual sales in this industry | $2,044.4 million |
| Average employees per establishment | 25 |
| Average sales per establishment | $3.6 million |
Market 2 – Construction machinery
Construction machinery (SIC 3531) consists of earthmoving equipment (bulldozers, shovel loaders, and excavators), off-highway trucks, power cranes, crawlers, draglines, and trenchers. However, if the industry can capitalize on new technologies and expand into developing markets, growth is expected to average nearly three percent from 1999 to 2002. An important factor in the future growth of this subsector could be the National Ambient Air Quality Standards, issued by the EPA in July, 1997. Firms are in the process of assessing the impact of the change in ozone standards on their production processes.
Establishments that are primarily engaged in manufacturing heavy machinery and equipment, such as bulldozers, concrete mixers, and cranes.
Market Size Statistics
| Estimated number of U.S. establishments | 2,266 |
| Number of people employed in this industry | 125,081 |
| Total annual sales in this industry | $58,196.9 million |
| Average employees per establishment | 57 |
| Average sales per establishment | $34.3 million |
Market 3 – Food products machinery
U.S. manufacturers of food products machinery benefit from the huge domestic market. According to the U.S. Department of Agriculture, the processed food industry is the largest manufacturing and distribution sector in the U.S. economy, accounting for more than one-sixth of the nation’s industrial activity. In addition, the United States is a major player in the global food industry, manufacturing approximately one-fourth of the world’s processed foods. In 1997 U.S. shipments of processed foods and beverages were estimated at approximately $471 billion. Six of the 10 largest, and 21 of the top 50 food processing companies in the world are headquartered in the United States. In addition to providing a large and viable home market for domestic machinery manufacturers and process technologists, the United States is a magnet market for advanced foreign high-technology machinery suppliers and for direct investment in the food industry.
Market 4 – Electrical equipment
Between 1992 and 1996, electrical equipment industry shipments boomed, increasing five percent in real terms. This growth ended a negative period in 1990 and 1991, during which shipments declined more than nine percent. The most important factor underlying those boom years was significant investment by firms in terms of both expansion and upgrading of their capital base. Low interest rates, technological improvements, and a healthy export climate stimulated this capital spending. The relays and industrial controls subsector, and the motors and generators subsector, historically have had the largest shipment values; during the period 1992-1996, both subsectors experienced the most vigorous growth, with average annual increases in shipments approximating seven percent each.
Market 5 – Turbines
The bulk of electricity production in the United States comes from steam turbines because of their efficiency and large capacity. However, gas turbines, which are also call combustion turbines, are accounting for the bulk of new manufacturing capacity in the turbine-producing subsector, particularly for peak load times and emergency and reserve power. Of the increase in generating capacity at U.S. electric utilities between 1992 and 1996, the Energy Information Administration estimates that over 60 percent can be attributed to newly-installed gas turbines. More than three-quarters of the planned capacity additions at these utilities, from 1997 to 2006, are expected to use gas as the primary energy source.
Market 6 – Motors and Generators
This subsector includes the production of electric motors (other than engine starting motors) and power generators, motor generator sets, railway motors and control equipment, and motors, generators, and control equipment for gasoline, electric, and oil-electric buses and trucks.
Other Markets
Industry: Power transmission equipment, nec.
Establishments that are primarily engaged in manufacturing mechanical power transmission equipment and parts, for industrial machinery.
Market Size Statistics
|
Estimated number of U.S. establishments |
18,984 |
| Number of people employed in this industry | 427 |
| Total annual sales in this industry | $3,338 million |
| Average employees per establishment | 47 |
| Average sales per establishment | $10.9 million |
4.3.1 Industry Participants
Competitive threats come from machine shops who perform similar types of machining, as well as design firms that have established relationships with a large customer base. Their machinery, tooling, fixturing, and inspection equipment is tailored to accommodate specific customer products. Their weaknesses, however, are lack of engineering ability, process control, expertise to develop and combine processes, to synchronously combine operations, and an inability to design and build automatic load and unload systems for internal use.
4.3.2 Competition and Buying Patterns
Machine Tooling believes that our customers choose our products based on the following criteria:
- Price.
- Performance.
- Customer service and support.
Strategy and Implementation Summary
The market strategy is to capitalize on our expertise by positioning the company to acquire strategic companies within the industry. We plan to leverage our expertise to acquire companies with product lines that compliment our manufacturing operations. The company’s goal in the next year is to secure more contract manufacturing positions. The company’s goal in the next five years is to continue with our “value added” scheme and embark on an acquisition program that will see the company take over key industry players.
5.1 Value Proposition
Machine Tooling’s products and services offer the following advantages to customers.
- Delivery. We provide on-time delivery, thereby reducing customer inventory and providing them with overall cost reduction.
- Quality. The products we supply are of high quality and have attributes that enable customers to carry out their business functions.
- Price. Our products competitively priced, thus helping customers control their own bottom line.
5.2 Competitive Edge
Machine Tooling has several highly significant competitive advantages:
- Engineering and technical support service.
- Automated system design and build.
- Customer service and support.
- Engineering and technical skills.
- Cross-functional teams encourage creativity.
- Quality systems are in place.
5.3 Marketing Strategy
The company’s marketing strategy will be to continue to promote sales of our product lines, systems, presses, automation projects, and machining capacity. In machining, focus will continue to be on components used in semi-sophisticated equipment where a possibility exists to pursue the next level of integration by assembling components or prepare part kits for assisted assembly. Focusing on this product-component relationship will facilitate the company’s ability to pursue the vertical integration of the business and pass on the value-added savings to our customers.
5.3.1 Marketing Programs
The overall marketing plan for Machine Tooling’s service is based on the following fundamentals:
- The segment of the markets planned to reach.
- Distribution channels planned to be used to reach market segments: television, radio, sales associates, and mail order.
- Share of the market expected to capture over a fixed period of time.
Market Responsibilities. In order to capitalize on sales opportunities, Machine Tooling will require an effective promotional campaign. This will be accomplished through television, radio, and magazine advertisements, as well as posters on billboards throughout the state. To help our customers with name recognition, we will offer a variety of promotional items with the company logo on them; the initial giveaways will be t-shirts, stickers, mugs, and pens.
Investment in Advertising and Promotion. A fixed amount of sales revenues will go toward the statewide advertisement campaign. On an ongoing basis, we feel that we can budget advertising expenses at less than five percent of revenues to the company.
5.3.2 Pricing Strategy
Pricing for machined components is developed usually by conducting a thorough time study analysis. This involves tool and cutter selection based on the operations to be performed and the material being processed. Machining, traverse, and material handling times are calculated based on known feeds, speeds, and rapid traverse rates. This total is then factored by the company’s burden rate and profit margin, and then factored again based on market value.
5.4 Sales Strategy
Machine Tooling’s sales plan is to seek businesses that will advance the company’s quest to vertically integrate and become a stronger force in the manufacturing industry. The company will continue to strive towards procuring sales of our product lines and machining capacity. The focus in machining is securing contracts to produce components used in upper-end product lines, yielding opportunities for “value added” engineering.
To accomplish Machine Tooling’s endeavors, the company will utilize internal and external sales tactics. By aggressively seeking new accounts and taking full advantage of the existing relationships the company has with current customers and broadening its customer base, the company will expand and be able to compete with the leading companies in the industry. Machine Tooling plans to use a direct sales force, relationship selling, and subcontractors to reach our markets. These channels are most appropriate because time to market, reduced capital requirements, and fast access to established distribution channels.
5.4.1 Sales Forecast
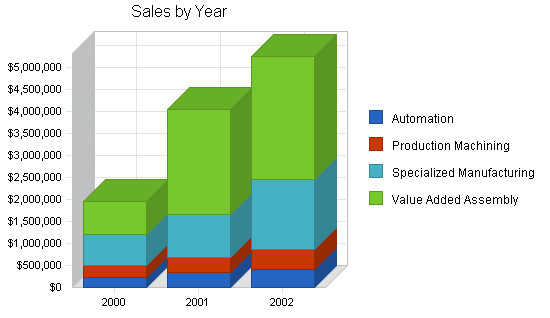
The chart and table below outline Machine Tooling’s sales forecasts. The company will gradually increase the share of the high-value assembly services in its sales mix over the next two years, which will add to the company’s bottom line.
| Sales Forecast | |||
| 2000 | 2001 | 2002 | |
| Sales | |||
| Automation | $220,000 | $330,000 | $420,000 |
| Production Machining | $270,000 | $360,000 | $440,000 |
| Specialized Manufacturing | $710,000 | $970,000 | $1,600,000 |
| Value Added Assembly | $760,000 | $2,400,000 | $2,800,000 |
| Total Sales | $1,960,000 | $4,060,000 | $5,260,000 |
| Direct Cost of Sales | 2000 | 2001 | 2002 |
| Automation | $45,200 | $67,000 | $85,000 |
| Production Machining | $54,700 | $73,000 | $89,000 |
| Specialized Manufacturing | $144,400 | $197,000 | $325,000 |
| Value Added Assembly | $155,700 | $490,000 | $570,000 |
| Subtotal Direct Cost of Sales | $400,000 | $827,000 | $1,069,000 |
Management Summary
The company’s management philosophy is based on responsibility and mutual respect. Machine Tooling will maintain an environment and structure that will encourage productivity and respect for customers and fellow employees.
Machine Tooling’s management is highly experienced and qualified. The key management team includes: Mr. Peter Newton CEO, Mr. John Abbot, president, and Mr. Chris Manuel, vice president of Marketing. As the table below outlines, the company will strive to maintain lean overhead. Besides the senior management team and an administrative assistant, Machine Tooling currently employs a production manager who oversees all the production facilities and the staff of ten.
10 Production workers are tracked as Cost of Goods in the Profit and Loss table. To accommodate the growing sales projections, an additional five productions workers will be hired in 2001.
| Personnel Plan | |||
| 2000 | 2001 | 2002 | |
| Peter Newton, CEO | $75,000 | $80,000 | $90,000 |
| John Abbot, President | $75,000 | $80,000 | $90,000 |
| Chris Manuel, VP Marketing | $60,000 | $65,000 | $75,000 |
| Production Manager | $45,000 | $50,000 | $55,000 |
| Administrative Assistant | $30,000 | $35,000 | $40,000 |
| Total People | 15 | 20 | 20 |
| Total Payroll | $285,000 | $310,000 | $350,000 |
Financial Plan
The company is seeking $500,000 for expansion purposes. The use of funds will be broken down as follows:
| Marketing of new product lines | $30,000 |
| Growth into new markets | $50,000 |
| Purchasing additional equipment | $270,000 |
| Working Capital | $100,000 |
| Other (Debt Management) | $50,000 |
7.1 Important Assumptions
Important assumptions for this plan are found in the following table.
| General Assumptions | |||
| 2000 | 2001 | 2002 | |
| Plan Month | 1 | 2 | 3 |
| Current Interest Rate | 10.00% | 10.00% | 10.00% |
| Long-term Interest Rate | 10.00% | 10.00% | 10.00% |
| Tax Rate | 25.42% | 25.00% | 25.42% |
| Other | 0 | 0 | 0 |
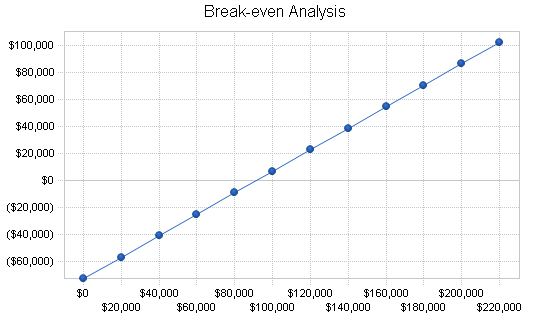
7.2 Break-even Analysis
Machine Tooling is operating well above the break-even point.
| Break-even Analysis | |
| Monthly Revenue Break-even | $90,953 |
| Assumptions: | |
| Average Percent Variable Cost | 20% |
| Estimated Monthly Fixed Cost | $72,391 |
7.3 Projected Profit and Loss
The table below provides Machine Tooling’s projected income statements for 2000-2002.
| Pro Forma Profit and Loss | |||
| 2000 | 2001 | 2002 | |
| Sales | $1,960,000 | $4,060,000 | $5,260,000 |
| Direct Cost of Sales | $400,000 | $827,000 | $1,069,000 |
| Production Personnel | $350,040 | $600,000 | $650,000 |
| Total Cost of Sales | $750,040 | $1,427,000 | $1,719,000 |
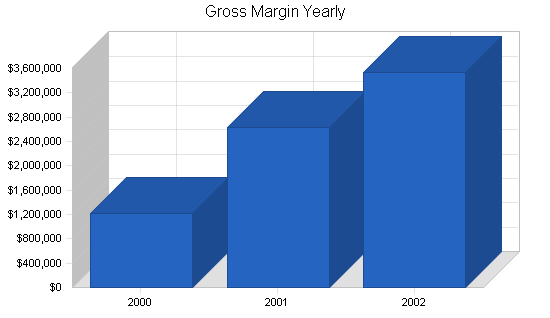
| Gross Margin | $1,209,960 | $2,633,000 | $3,541,000 |
| Gross Margin % | 61.73% | 64.85% | 67.32% |
| Expenses | |||
| Payroll | $285,000 | $310,000 | $350,000 |
| Marketing/Promotion | $167,900 | $220,000 | $265,000 |
| Depreciation | $9,996 | $30,000 | $40,000 |
| Quality Assurance | $93,800 | $104,000 | $125,000 |
| General & Administrative | $96,000 | $124,000 | $174,000 |
| Manufacturing & Engineering | $129,600 | $130,000 | $175,000 |
| Machining & Systems Building | $86,400 | $100,000 | $110,000 |
| Payroll Taxes | $0 | $0 | $0 |
| Other | $0 | $0 | $0 |
| Total Operating Expenses | $868,696 | $1,018,000 | $1,239,000 |
| Profit Before Interest and Taxes | $341,264 | $1,615,000 | $2,302,000 |
| EBITDA | $351,260 | $1,645,000 | $2,342,000 |
| Interest Expense | $47,705 | $29,150 | $12,470 |
| Taxes Incurred | $74,621 | $396,463 | $581,922 |
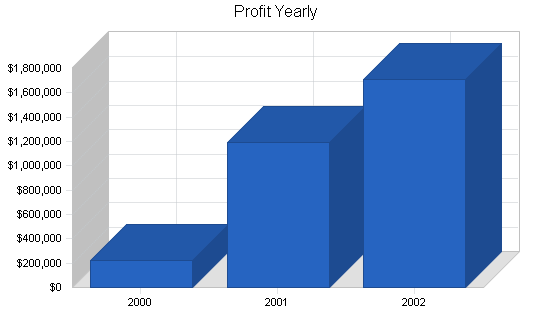
| Net Profit | $218,938 | $1,189,388 | $1,707,608 |
| Net Profit/Sales | 11.17% | 29.30% | 32.46% |
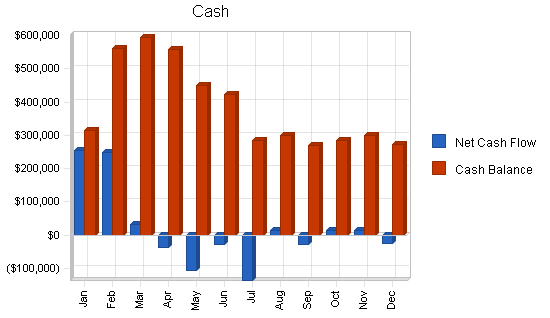
7.4 Projected Cash Flow
The company’s projected cash flow statements are presented below.
- The existing short-term liabilities ($50,000 in total) are paid out in ten monthly payments of $5,000 each starting in March, 2000.
- The $500,000 long-term loan is expected to be secured in January, 2000 (two payments of $250,000 each are expected in January and February). This loan will be repaid quarterly over three years.
- In April, $50,000 from the expected loan will be used to completely repay the existing long-term obligations.
- After that, in May and July, 2000, the company will purchase additional equipment and buildings in the total amount of $270,000.
- In years 2001 and 2002, further capital expenditures in the amount of $200,000 and $300,000, respectively, are planned to accommodate for increased sales. In both cases, “ten year, straight-line” depreciation is assumed.
| Pro Forma Cash Flow | |||
| 2000 | 2001 | 2002 | |
| Cash Received | |||
| Cash from Operations | |||
| Cash Sales | $490,000 | $1,015,000 | $1,315,000 |
| Cash from Receivables | $1,352,925 | $2,780,277 | $3,793,730 |
| Subtotal Cash from Operations | $1,842,925 | $3,795,277 | $5,108,730 |
| Additional Cash Received | |||
| Sales Tax, VAT, HST/GST Received | $0 | $0 | $0 |
| New Current Borrowing | $0 | $0 | $0 |
| New Other Liabilities (interest-free) | $0 | $0 | $0 |
| New Long-term Liabilities | $500,000 | $0 | $0 |
| Sales of Other Current Assets | $0 | $0 | $0 |
| Sales of Long-term Assets | $0 | $0 | $0 |
| New Investment Received | $0 | $0 | $0 |
| Subtotal Cash Received | $2,342,925 | $3,795,277 | $5,108,730 |
| Expenditures | 2000 | 2001 | 2002 |
| Expenditures from Operations | |||
| Cash Spending | $285,000 | $310,000 | $350,000 |
| Bill Payments | $1,350,401 | $2,477,107 | $3,134,443 |
| Subtotal Spent on Operations | $1,635,401 | $2,787,107 | $3,484,443 |
| Additional Cash Spent | |||
| Sales Tax, VAT, HST/GST Paid Out | $0 | $0 | $0 |
| Principal Repayment of Current Borrowing | $50,000 | $0 | $0 |
| Other Liabilities Principal Repayment | $0 | $0 | $0 |
| Long-term Liabilities Principal Repayment | $175,100 | $166,800 | $166,800 |
| Purchase Other Current Assets | $0 | $0 | $0 |
| Purchase Long-term Assets | $270,000 | $200,000 | $300,000 |
| Dividends | $0 | $0 | $0 |
| Subtotal Cash Spent | $2,130,501 | $3,153,907 | $3,951,243 |
| Net Cash Flow | $212,424 | $641,370 | $1,157,487 |
| Cash Balance | $272,424 | $913,793 | $2,071,280 |
7.5 Balance Sheet
The company’s projected balance sheets for 2000-2002 are presented below.
| Pro Forma Balance Sheet | |||
| 2000 | 2001 | 2002 | |
| Assets | |||
| Current Assets | |||
| Cash | $272,424 | $913,793 | $2,071,280 |
| Accounts Receivable | $247,075 | $511,798 | $663,069 |
| Inventory | $37,290 | $77,097 | $99,658 |
| Other Current Assets | $15,000 | $15,000 | $15,000 |
| Total Current Assets | $571,789 | $1,517,689 | $2,849,006 |
| Long-term Assets | |||
| Long-term Assets | $370,000 | $570,000 | $870,000 |
| Accumulated Depreciation | $39,996 | $69,996 | $109,996 |
| Total Long-term Assets | $330,004 | $500,004 | $760,004 |
| Total Assets | $901,793 | $2,017,693 | $3,609,010 |
| Liabilities and Capital | 2000 | 2001 | 2002 |
| Current Liabilities | |||
| Accounts Payable | $117,955 | $211,267 | $261,777 |
| Current Borrowing | $0 | $0 | $0 |
| Other Current Liabilities | $10,000 | $10,000 | $10,000 |
| Subtotal Current Liabilities | $127,955 | $221,267 | $271,777 |
| Long-term Liabilities | $374,900 | $208,100 | $41,300 |
| Total Liabilities | $502,855 | $429,367 | $313,077 |
| Paid-in Capital | $50,000 | $50,000 | $50,000 |
| Retained Earnings | $130,000 | $348,938 | $1,538,325 |
| Earnings | $218,938 | $1,189,388 | $1,707,608 |
| Total Capital | $398,938 | $1,588,325 | $3,295,933 |
| Total Liabilities and Capital | $901,793 | $2,017,693 | $3,609,010 |
| Net Worth | $398,938 | $1,588,325 | $3,295,933 |
7.6 Business Ratios
The following table gives a detailed ratio analysis for Machine Tooling. The last column, Industry Profiles, is derived from the general machine industry, as described by the Standard Industry Classification (SIC) Index code 3569, General Industrial Machinery, NEC.
| Ratio Analysis | ||||
| 2000 | 2001 | 2002 | Industry Profile | |
| Sales Growth | 30.67% | 107.14% | 29.56% | -0.50% |
| Percent of Total Assets | ||||
| Accounts Receivable | 27.40% | 25.37% | 18.37% | 24.80% |
| Inventory | 4.14% | 3.82% | 2.76% | 26.10% |
| Other Current Assets | 1.66% | 0.74% | 0.42% | 24.20% |
| Total Current Assets | 63.41% | 75.22% | 78.94% | 75.10% |
| Long-term Assets | 36.59% | 24.78% | 21.06% | 24.90% |
| Total Assets | 100.00% | 100.00% | 100.00% | 100.00% |
| Current Liabilities | 14.19% | 10.97% | 7.53% | 35.70% |
| Long-term Liabilities | 41.57% | 10.31% | 1.14% | 18.50% |
| Total Liabilities | 55.76% | 21.28% | 8.67% | 54.20% |
| Net Worth | 44.24% | 78.72% | 91.33% | 45.80% |
| Percent of Sales | ||||
| Sales | 100.00% | 100.00% | 100.00% | 100.00% |
| Gross Margin | 61.73% | 64.85% | 67.32% | 35.80% |
| Selling, General & Administrative Expenses | 72.00% | 52.86% | 49.17% | 20.80% |
| Advertising Expenses | 2.27% | 1.60% | 1.33% | 0.70% |
| Profit Before Interest and Taxes | 17.41% | 39.78% | 43.76% | 4.00% |
| Main Ratios | ||||
| Current | 4.47 | 6.86 | 10.48 | 2.20 |
| Quick | 4.18 | 6.51 | 10.12 | 1.15 |
| Total Debt to Total Assets | 55.76% | 21.28% | 8.67% | 54.20% |
| Pre-tax Return on Net Worth | 73.59% | 99.84% | 69.47% | 7.30% |
| Pre-tax Return on Assets | 32.55% | 78.60% | 63.44% | 16.00% |
| Additional Ratios | 2000 | 2001 | 2002 | |
| Net Profit Margin | 11.17% | 29.30% | 32.46% | n.a |
| Return on Equity | 54.88% | 74.88% | 51.81% | n.a |
| Activity Ratios | ||||
| Accounts Receivable Turnover | 5.95 | 5.95 | 5.95 | n.a |
| Collection Days | 59 | 45 | 54 | n.a |
| Inventory Turnover | 10.42 | 14.46 | 12.10 | n.a |
| Accounts Payable Turnover | 11.81 | 12.17 | 12.17 | n.a |
| Payment Days | 29 | 23 | 27 | n.a |
| Total Asset Turnover | 2.17 | 2.01 | 1.46 | n.a |
| Debt Ratios | ||||
| Debt to Net Worth | 1.26 | 0.27 | 0.09 | n.a |
| Current Liab. to Liab. | 0.25 | 0.52 | 0.87 | n.a |
| Liquidity Ratios | ||||
| Net Working Capital | $443,834 | $1,296,421 | $2,577,229 | n.a |
| Interest Coverage | 7.15 | 55.40 | 184.60 | n.a |
| Additional Ratios | ||||
| Assets to Sales | 0.46 | 0.50 | 0.69 | n.a |
| Current Debt/Total Assets | 14% | 11% | 8% | n.a |
| Acid Test | 2.25 | 4.20 | 7.68 | n.a |
| Sales/Net Worth | 4.91 | 2.56 | 1.60 | n.a |
| Dividend Payout | 0.00 | 0.00 | 0.00 | n.a |
Appendix
| Sales Forecast | |||||||||||||
| Jan | Feb | Mar | Apr | May | Jun | Jul | Aug | Sep | Oct | Nov | Dec | ||
| Sales | |||||||||||||
| Automation | 0% | $18,000 | $18,000 | $18,000 | $18,000 | $18,000 | $18,000 | $18,000 | $18,000 | $19,000 | $19,000 | $19,000 | $19,000 |
| Production Machining | 0% | $22,000 | $22,000 | $22,000 | $22,000 | $22,000 | $22,000 | $22,000 | $22,000 | $22,000 | $23,000 | $24,000 | $25,000 |
| Specialized Manufacturing | 0% | $59,000 | $59,000 | $59,000 | $59,000 | $59,000 | $59,000 | $59,000 | $59,000 | $59,000 | $59,000 | $60,000 | $60,000 |
| Value Added Assembly | 0% | $63,000 | $63,000 | $63,000 | $63,000 | $63,000 | $63,000 | $63,000 | $63,000 | $64,000 | $64,000 | $64,000 | $64,000 |
| Total Sales | $162,000 | $162,000 | $162,000 | $162,000 | $162,000 | $162,000 | $162,000 | $162,000 | $164,000 | $165,000 | $167,000 | $168,000 | |
| Direct Cost of Sales | Jan | Feb | Mar | Apr | May | Jun | Jul | Aug | Sep | Oct | Nov | Dec | |
| Automation | $3,700 | $3,700 | $3,700 | $3,700 | $3,700 | $3,700 | $3,700 | $3,700 | $3,900 | $3,900 | $3,900 | $3,900 | |
| Production Machining | $4,500 | $4,500 | $4,500 | $4,500 | $4,500 | $4,500 | $4,500 | $4,500 | $4,500 | $4,700 | $4,700 | $4,800 | |
| Specialized Manufacturing | $12,000 | $12,000 | $12,000 | $12,000 | $12,000 | $12,000 | $12,000 | $12,000 | $12,000 | $12,000 | $12,200 | $12,200 | |
| Value Added Assembly | $12,900 | $12,900 | $12,900 | $13,000 | $13,000 | $13,000 | $13,000 | $13,000 | $13,000 | $13,000 | $13,000 | $13,000 | |
| Subtotal Direct Cost of Sales | $33,100 | $33,100 | $33,100 | $33,200 | $33,200 | $33,200 | $33,200 | $33,200 | $33,400 | $33,600 | $33,800 | $33,900 | |
| Personnel Plan | |||||||||||||
| Jan | Feb | Mar | Apr | May | Jun | Jul | Aug | Sep | Oct | Nov | Dec | ||
| Peter Newton, CEO | 0% | $6,250 | $6,250 | $6,250 | $6,250 | $6,250 | $6,250 | $6,250 | $6,250 | $6,250 | $6,250 | $6,250 | $6,250 |
| John Abbot, President | 0% | $6,250 | $6,250 | $6,250 | $6,250 | $6,250 | $6,250 | $6,250 | $6,250 | $6,250 | $6,250 | $6,250 | $6,250 |
| Chris Manuel, VP Marketing | 0% | $5,000 | $5,000 | $5,000 | $5,000 | $5,000 | $5,000 | $5,000 | $5,000 | $5,000 | $5,000 | $5,000 | $5,000 |
| Production Manager | 0% | $3,750 | $3,750 | $3,750 | $3,750 | $3,750 | $3,750 | $3,750 | $3,750 | $3,750 | $3,750 | $3,750 | $3,750 |
| Administrative Assistant | 0% | $2,500 | $2,500 | $2,500 | $2,500 | $2,500 | $2,500 | $2,500 | $2,500 | $2,500 | $2,500 | $2,500 | $2,500 |
| Total People | 15 | 15 | 15 | 15 | 15 | 15 | 15 | 15 | 15 | 15 | 15 | 15 | |
| Total Payroll | $23,750 | $23,750 | $23,750 | $23,750 | $23,750 | $23,750 | $23,750 | $23,750 | $23,750 | $23,750 | $23,750 | $23,750 | |
| General Assumptions | |||||||||||||
| Jan | Feb | Mar | Apr | May | Jun | Jul | Aug | Sep | Oct | Nov | Dec | ||
| Plan Month | 1 | 2 | 3 | 4 | 5 | 6 | 7 | 8 | 9 | 10 | 11 | 12 | |
| Current Interest Rate | 10.00% | 10.00% | 10.00% | 10.00% | 10.00% | 10.00% | 10.00% | 10.00% | 10.00% | 10.00% | 10.00% | 10.00% | |
| Long-term Interest Rate | 10.00% | 10.00% | 10.00% | 10.00% | 10.00% | 10.00% | 10.00% | 10.00% | 10.00% | 10.00% | 10.00% | 10.00% | |
| Tax Rate | 30.00% | 25.00% | 25.00% | 25.00% | 25.00% | 25.00% | 25.00% | 25.00% | 25.00% | 25.00% | 25.00% | 25.00% | |
| Other | 0 | 0 | 0 | 0 | 0 | 0 | 0 | 0 | 0 | 0 | 0 | 0 | |
| Pro Forma Profit and Loss | |||||||||||||
| Jan | Feb | Mar | Apr | May | Jun | Jul | Aug | Sep | Oct | Nov | Dec | ||
| Sales | $162,000 | $162,000 | $162,000 | $162,000 | $162,000 | $162,000 | $162,000 | $162,000 | $164,000 | $165,000 | $167,000 | $168,000 | |
| Direct Cost of Sales | $33,100 | $33,100 | $33,100 | $33,200 | $33,200 | $33,200 | $33,200 | $33,200 | $33,400 | $33,600 | $33,800 | $33,900 | |
| Production Personnel | $29,170 | $29,170 | $29,170 | $29,170 | $29,170 | $29,170 | $29,170 | $29,170 | $29,170 | $29,170 | $29,170 | $29,170 | |
| Total Cost of Sales | $62,270 | $62,270 | $62,270 | $62,370 | $62,370 | $62,370 | $62,370 | $62,370 | $62,570 | $62,770 | $62,970 | $63,070 | |
| Gross Margin | $99,730 | $99,730 | $99,730 | $99,630 | $99,630 | $99,630 | $99,630 | $99,630 | $101,430 | $102,230 | $104,030 | $104,930 | |
| Gross Margin % | 61.56% | 61.56% | 61.56% | 61.50% | 61.50% | 61.50% | 61.50% | 61.50% | 61.85% | 61.96% | 62.29% | 62.46% | |
| Expenses | |||||||||||||
| Payroll | $23,750 | $23,750 | $23,750 | $23,750 | $23,750 | $23,750 | $23,750 | $23,750 | $23,750 | $23,750 | $23,750 | $23,750 | |
| Marketing/Promotion | $13,900 | $13,900 | $14,000 | $13,900 | $13,900 | $14,000 | $13,900 | $13,900 | $14,050 | $14,000 | $14,100 | $14,350 | |
| Depreciation | $833 | $833 | $833 | $833 | $833 | $833 | $833 | $833 | $833 | $833 | $833 | $833 | |
| Quality Assurance | $7,700 | $7,700 | $7,700 | $7,700 | $7,700 | $7,700 | $7,700 | $7,700 | $7,900 | $8,000 | $8,100 | $8,200 | |
| General & Administrative | $8,000 | $8,000 | $8,000 | $8,000 | $8,000 | $8,000 | $8,000 | $8,000 | $8,000 | $8,000 | $8,000 | $8,000 | |
| Manufacturing & Engineering | $10,800 | $10,800 | $10,800 | $10,800 | $10,800 | $10,800 | $10,800 | $10,800 | $10,800 | $10,800 | $10,800 | $10,800 | |
| Machining & Systems Building | $7,200 | $7,200 | $7,200 | $7,200 | $7,200 | $7,200 | $7,200 | $7,200 | $7,200 | $7,200 | $7,200 | $7,200 | |
| Payroll Taxes | 15% | $0 | $0 | $0 | $0 | $0 | $0 | $0 | $0 | $0 | $0 | $0 | $0 |
| Other | $0 | $0 | $0 | $0 | $0 | $0 | $0 | $0 | $0 | $0 | $0 | $0 | |
| Total Operating Expenses | $72,183 | $72,183 | $72,283 | $72,183 | $72,183 | $72,283 | $72,183 | $72,183 | $72,533 | $72,583 | $72,783 | $73,133 | |
| Profit Before Interest and Taxes | $27,547 | $27,547 | $27,447 | $27,447 | $27,447 | $27,347 | $27,447 | $27,447 | $28,897 | $29,647 | $31,247 | $31,797 | |
| EBITDA | $28,380 | $28,380 | $28,280 | $28,280 | $28,280 | $28,180 | $28,280 | $28,280 | $29,730 | $30,480 | $32,080 | $32,630 | |
| Interest Expense | $2,917 | $5,000 | $4,958 | $4,500 | $4,458 | $4,069 | $4,028 | $3,986 | $3,597 | $3,555 | $3,513 | $3,124 | |
| Taxes Incurred | $7,389 | $5,637 | $5,622 | $5,737 | $5,747 | $5,819 | $5,855 | $5,865 | $6,325 | $6,523 | $6,933 | $7,168 | |
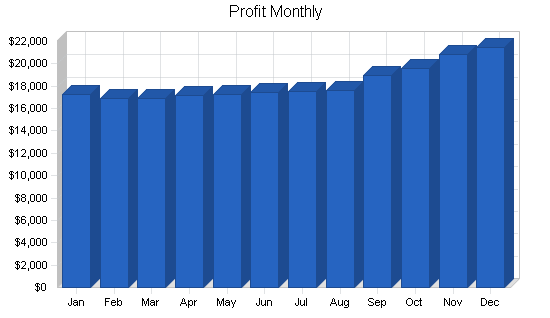
| Net Profit | $17,241 | $16,910 | $16,867 | $17,210 | $17,242 | $17,458 | $17,565 | $17,596 | $18,975 | $19,569 | $20,800 | $21,505 | |
| Net Profit/Sales | 10.64% | 10.44% | 10.41% | 10.62% | 10.64% | 10.78% | 10.84% | 10.86% | 11.57% | 11.86% | 12.46% | 12.80% | |
| Pro Forma Cash Flow | |||||||||||||
| Jan | Feb | Mar | Apr | May | Jun | Jul | Aug | Sep | Oct | Nov | Dec | ||
| Cash Received | |||||||||||||
| Cash from Operations | |||||||||||||
| Cash Sales | $40,500 | $40,500 | $40,500 | $40,500 | $40,500 | $40,500 | $40,500 | $40,500 | $41,000 | $41,250 | $41,750 | $42,000 | |
| Cash from Receivables | $65,000 | $69,050 | $121,500 | $121,500 | $121,500 | $121,500 | $121,500 | $121,500 | $121,500 | $121,550 | $123,025 | $123,800 | |
| Subtotal Cash from Operations | $105,500 | $109,550 | $162,000 | $162,000 | $162,000 | $162,000 | $162,000 | $162,000 | $162,500 | $162,800 | $164,775 | $165,800 | |
| Additional Cash Received | |||||||||||||
| Sales Tax, VAT, HST/GST Received | 0.00% | $0 | $0 | $0 | $0 | $0 | $0 | $0 | $0 | $0 | $0 | $0 | $0 |
| New Current Borrowing | $0 | $0 | $0 | $0 | $0 | $0 | $0 | $0 | $0 | $0 | $0 | $0 | |
| New Other Liabilities (interest-free) | $0 | $0 | $0 | $0 | $0 | $0 | $0 | $0 | $0 | $0 | $0 | $0 | |
| New Long-term Liabilities | $250,000 | $250,000 | $0 | $0 | $0 | $0 | $0 | $0 | $0 | $0 | $0 | $0 | |
| Sales of Other Current Assets | $0 | $0 | $0 | $0 | $0 | $0 | $0 | $0 | $0 | $0 | $0 | $0 | |
| Sales of Long-term Assets | $0 | $0 | $0 | $0 | $0 | $0 | $0 | $0 | $0 | $0 | $0 | $0 | |
| New Investment Received | $0 | $0 | $0 | $0 | $0 | $0 | $0 | $0 | $0 | $0 | $0 | $0 | |
| Subtotal Cash Received | $355,500 | $359,550 | $162,000 | $162,000 | $162,000 | $162,000 | $162,000 | $162,000 | $162,500 | $162,800 | $164,775 | $165,800 | |
| Expenditures | Jan | Feb | Mar | Apr | May | Jun | Jul | Aug | Sep | Oct | Nov | Dec | |
| Expenditures from Operations | |||||||||||||
| Cash Spending | $23,750 | $23,750 | $23,750 | $23,750 | $23,750 | $23,750 | $23,750 | $23,750 | $23,750 | $23,750 | $23,750 | $23,750 | |
| Bill Payments | $77,903 | $87,507 | $100,701 | $120,543 | $120,312 | $120,168 | $119,955 | $119,851 | $119,849 | $120,675 | $121,094 | $121,843 | |
| Subtotal Spent on Operations | $101,653 | $111,257 | $124,451 | $144,293 | $144,062 | $143,918 | $143,705 | $143,601 | $143,599 | $144,425 | $144,844 | $145,593 | |
| Additional Cash Spent | |||||||||||||
| Sales Tax, VAT, HST/GST Paid Out | $0 | $0 | $0 | $0 | $0 | $0 | $0 | $0 | $0 | $0 | $0 | $0 | |
| Principal Repayment of Current Borrowing | $0 | $0 | $5,000 | $5,000 | $5,000 | $5,000 | $5,000 | $5,000 | $5,000 | $5,000 | $5,000 | $5,000 | |
| Other Liabilities Principal Repayment | $0 | $0 | $0 | $0 | $0 | $0 | $0 | $0 | $0 | $0 | $0 | $0 | |
| Long-term Liabilities Principal Repayment | $0 | $0 | $0 | $50,000 | $0 | $41,700 | $0 | $0 | $41,700 | $0 | $0 | $41,700 | |
| Purchase Other Current Assets | $0 | $0 | $0 | $0 | $0 | $0 | $0 | $0 | $0 | $0 | $0 | $0 | |
| Purchase Long-term Assets | $0 | $0 | $0 | $0 | $120,000 | $0 | $150,000 | $0 | $0 | $0 | $0 | $0 | |
| Dividends | $0 | $0 | $0 | $0 | $0 | $0 | $0 | $0 | $0 | $0 | $0 | $0 | |
| Subtotal Cash Spent | $101,653 | $111,257 | $129,451 | $199,293 | $269,062 | $190,618 | $298,705 | $148,601 | $190,299 | $149,425 | $149,844 | $192,293 | |
| Net Cash Flow | $253,847 | $248,293 | $32,549 | ($37,293) | ($107,062) | ($28,618) | ($136,705) | $13,399 | ($27,799) | $13,375 | $14,931 | ($26,493) | |
| Cash Balance | $313,847 | $562,140 | $594,689 | $557,396 | $450,334 | $421,716 | $285,011 | $298,410 | $270,611 | $283,985 | $298,917 | $272,424 | |
| Pro Forma Balance Sheet | |||||||||||||
| Jan | Feb | Mar | Apr | May | Jun | Jul | Aug | Sep | Oct | Nov | Dec | ||
| Assets | Starting Balances | ||||||||||||
| Current Assets | |||||||||||||
| Cash | $60,000 | $313,847 | $562,140 | $594,689 | $557,396 | $450,334 | $421,716 | $285,011 | $298,410 | $270,611 | $283,985 | $298,917 | $272,424 |
| Accounts Receivable | $130,000 | $186,500 | $238,950 | $238,950 | $238,950 | $238,950 | $238,950 | $238,950 | $238,950 | $240,450 | $242,650 | $244,875 | $247,075 |
| Inventory | $90,000 | $56,900 | $36,410 | $36,410 | $36,520 | $36,520 | $36,520 | $36,520 | $36,520 | $36,740 | $36,960 | $37,180 | $37,290 |
| Other Current Assets | $15,000 | $15,000 | $15,000 | $15,000 | $15,000 | $15,000 | $15,000 | $15,000 | $15,000 | $15,000 | $15,000 | $15,000 | $15,000 |
| Total Current Assets | $295,000 | $572,247 | $852,500 | $885,049 | $847,866 | $740,804 | $712,186 | $575,481 | $588,880 | $562,801 | $578,595 | $595,972 | $571,789 |
| Long-term Assets | |||||||||||||
| Long-term Assets | $100,000 | $100,000 | $100,000 | $100,000 | $100,000 | $220,000 | $220,000 | $370,000 | $370,000 | $370,000 | $370,000 | $370,000 | $370,000 |
| Accumulated Depreciation | $30,000 | $30,833 | $31,666 | $32,499 | $33,332 | $34,165 | $34,998 | $35,831 | $36,664 | $37,497 | $38,330 | $39,163 | $39,996 |
| Total Long-term Assets | $70,000 | $69,167 | $68,334 | $67,501 | $66,668 | $185,835 | $185,002 | $334,169 | $333,336 | $332,503 | $331,670 | $330,837 | $330,004 |
| Total Assets | $365,000 | $641,414 | $920,834 | $952,550 | $914,534 | $926,639 | $897,188 | $909,650 | $922,216 | $895,304 | $910,265 | $926,809 | $901,793 |
| Liabilities and Capital | Jan | Feb | Mar | Apr | May | Jun | Jul | Aug | Sep | Oct | Nov | Dec | |
| Current Liabilities | |||||||||||||
| Accounts Payable | $75,000 | $84,173 | $96,683 | $116,532 | $116,306 | $116,170 | $115,960 | $115,857 | $115,827 | $116,640 | $117,032 | $117,776 | $117,955 |
| Current Borrowing | $50,000 | $50,000 | $50,000 | $45,000 | $40,000 | $35,000 | $30,000 | $25,000 | $20,000 | $15,000 | $10,000 | $5,000 | $0 |
| Other Current Liabilities | $10,000 | $10,000 | $10,000 | $10,000 | $10,000 | $10,000 | $10,000 | $10,000 | $10,000 | $10,000 | $10,000 | $10,000 | $10,000 |
| Subtotal Current Liabilities | $135,000 | $144,173 | $156,683 | $171,532 | $166,306 | $161,170 | $155,960 | $150,857 | $145,827 | $141,640 | $137,032 | $132,776 | $127,955 |
| Long-term Liabilities | $50,000 | $300,000 | $550,000 | $550,000 | $500,000 | $500,000 | $458,300 | $458,300 | $458,300 | $416,600 | $416,600 | $416,600 | $374,900 |
| Total Liabilities | $185,000 | $444,173 | $706,683 | $721,532 | $666,306 | $661,170 | $614,260 | $609,157 | $604,127 | $558,240 | $553,632 | $549,376 | $502,855 |
| Paid-in Capital | $50,000 | $50,000 | $50,000 | $50,000 | $50,000 | $50,000 | $50,000 | $50,000 | $50,000 | $50,000 | $50,000 | $50,000 | $50,000 |
| Retained Earnings | $130,000 | $130,000 | $130,000 | $130,000 | $130,000 | $130,000 | $130,000 | $130,000 | $130,000 | $130,000 | $130,000 | $130,000 | $130,000 |
| Earnings | $0 | $17,241 | $34,151 | $51,018 | $68,228 | $85,470 | $102,928 | $120,493 | $138,089 | $157,064 | $176,633 | $197,433 | $218,938 |
| Total Capital | $180,000 | $197,241 | $214,151 | $231,018 | $248,228 | $265,470 | $282,928 | $300,493 | $318,089 | $337,064 | $356,633 | $377,433 | $398,938 |
| Total Liabilities and Capital | $365,000 | $641,414 | $920,834 | $952,550 | $914,534 | $926,639 | $897,188 | $909,650 | $922,216 | $895,304 | $910,265 | $926,809 | $901,793 |
| Net Worth | $180,000 | $197,241 | $214,151 | $231,018 | $248,228 | $265,470 | $282,928 | $300,493 | $318,089 | $337,064 | $356,633 | $377,433 | $398,938 |


