
South Kelleton Keys and Locksmith
Executive Summary
South Kelleton Keys and Locksmith (SKelleton Keys) will be a locksmith shop focusing entirely on locks and security products, founded and managed by Padraic Lawkse, an experienced, certified locksmith. The business will set up a store in South Kelleton and sell lock hardware and services to building management companies, businesses, homeowners, and renters in the community through a combination of direct selling techniques and advertising.
Net profit will rise significantly from its first year of operation to the end of its third year on a projected almost doubling of sales. The business will grow by selling products and services, as well as offering qualified referrals to security product vendors when the company cannot handle a client’s needs directly. An additional locksmith will join the business in the third year to apprentice under Pad Lawkse and expand the company’s business.
South Kelleton Keys and Locksmith seeks a three year business loan, which will fund initial operations along with Pad Lawkse’s own capital investment into the business.
1.1 Objectives
The objectives for South Kelleton Keys and Locksmith are:
- Launch a store in a highly visible location in South Kelleton
- Establish relationships with ten apartment buildings as a preferred vendor for locks in the first year of operation
- Achieve a doubling of sales by its third year of operation, with gross margins better than 40% on products
1.2 Mission
South Kelleton Keys and Locksmith will increase the security of buildings, owners, and renters in its neighborhood of South Kelleton by providing the best quality locks and security products, as well as highly skilled installation and repair.
1.3 Keys to Success
To succeed as a locksmith business, SKelleton Keys must:
- Develop relationships with building owners
- Create awareness in the community of their proximity, quality, and reasonable prices
- Respond quickly to requests
- Sell “security and peace” of mind rather than “locks”
Company Summary
South Kelleton Keys and Locksmith will establish a new locksmith shop within the neighborhood of South Kelleton. This predominantly residential community, including landlords, homeowners, renters, and other businesses, require locks and security products ranging from the simplest locks to padlocks and advanced products. SKelleton Keys will provide products and installations of deadbolts, padlocks, cylinder locks, camlocks and safes. The business will refer clients to security system partners for more advanced security technologies. They will provide on-site security consultations, installations and repairs. They will copy keys and sell key rings and key chain products.
2.1 Company Ownership
South Kelleton Keys and Locksmith is an LLC owned by Padraic Lawkse, an experienced locksmith who worked as a lock installer and salesperson for ten years.
2.2 Start-up Summary
Start-up expenses include initial liability insurance premiums, covering both the store and general liability for work done on-site at customer homes and offices, rent for one month’s security deposit and two months for the build-out and set-up of the store prior to opening, legal and licensing fees, and stationery and print collateral. A $25,000 surety bond must also be secured as well for an estimated $750 per year. Pre-launch marketing expenses are detailed in the marketing plan and include the creation of a website ($1,000), brochure ($2,500), flyers and ads ($3,500), and other activities.
$40,000 in inventory of locks and key products for sale off the shelf must be purchased prior to opening. Current assets pay for shelves and display cases, a computer and necessary software systems. Long-term assets include a cash register system ($2,000), key cutting machines (3 for approximately $1,000 each), outdoor signage ($500), and fixtures and improvements to the store space ($20,000). Additional tools ($4,500) include hand tools (screwdrivers, hammers, saws, chisels), power tools (drills, hole-saws, saws, sanders), letter and number hand stamps to label and number keys, and a short ladder to reach the top of door frames. $10,000 is reserved for the purchase of a used van and its outfitting with racks and drawers to store parts, tools, and a key cutter.

| Start-up | |
| Requirements | |
| Start-up Expenses | |
| Legal & Licenses | $3,000 |
| Surety Bond | $750 |
| Stationery | $2,000 |
| Insurance | $10,000 |
| Rent | $6,000 |
| Pre-Launch Marketing | $10,000 |
| Other | $1,000 |
| Other | $0 |
| Total Start-up Expenses | $32,750 |
| Start-up Assets | |
| Cash Required | $44,250 |
| Start-up Inventory | $40,000 |
| Other Current Assets | $20,000 |
| Long-term Assets | $40,000 |
| Total Assets | $144,250 |
| Total Requirements | $177,000 |
Products and Services
Products will be from brand names in lock and security products, such as Schlage and Master Lock, with inexpensive options as well.
Products will include:
- deadbolts
- padlocks
- cylinderlocks
- camlocks
- safes
- key rings
- key chains
- locking display cases
- locking file cabinets
- tool chests
Large and customizable items like display cases will not be held in inventory, but will be ordered to client specifications from vendors. Catalogs will be available in store for customers to choose from.
Services will include:
- cutting copies of keys
- installing all lock products sold
- on-site security consultations
- product repair (when possible)
- referrals to security system sellers who provide sales, installation and repair for more advanced security technologies (electronic and video locks, keypads, camera security systems)
Services will be executed by Padraic Lawkse, a locksmith with technical college and professional experience.
Market Analysis Summary
The locksmith industry sells to consumers and to businesses, with goals of securing residential and commercial real estate and other property. This market ranges from individuals securing a gym locker, to renters adding additional security to their rented space, to landlords, homeowners, and business owners securing entire buildings.
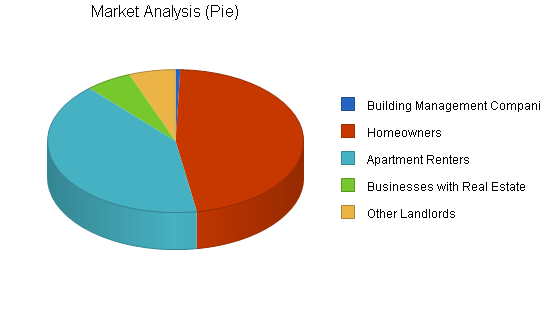
4.1 Market Segmentation
The market for locksmith products and services in South Kelleton has been broken down into the segments shown in the Market Analysis. They are growing at a slow rate, as South Kelleton is built up and not undergoing much new development.
Building management companies work for landlords, providing management services for buildings ranging from single-family homes to large apartment building complexes. The managers are tasked with reducing the risks of their landlords, providing good service for their tenants in order to attract and retain the best tenants, and keeping costs of service down. They look for ongoing relationships with local vendors with whom they can receive relationship rates for the high volume of business they provide. Locks must be changed frequently for new apartments, for front doors, for mailboxes, and for other rooms in buildings, both when tenants leave and when locks malfunction or are damaged. Robberies or robbery attempts may increase security concerns in given buildings or areas and lead to a spree of lock upgrades.
Homeowners seek basic security for their home, but think of locksmiths as involved in a single transaction. They will look for the reputation and experience of a company, but will not spend a great deal of time comparing locksmiths. They will pick the first of the two or three they contact, and they will find those based on their visibility either in the community or on the internet/Yellow Pages.
Apartment renters generally add a deadbolt to their apartments for greater security, but look for the lowest prices to do so. They think of this work with a locksmith as a single transaction and will not spend too much time comparing prices.
Businesses with real estate may have great amounts of property to protect (all of their inventory and assets) and look for security systems and gates as well as locks. Business owners will seek good prices, but not with a loss of quality and security. They will generally need consultation services as well. Some have large holdings and may work to create ongoing relationships, much like building managers.

Other landlords include absent owners of homes and buildings who do not use a management company. They may not work as professionally as building management companies, and may look for and choose locksmiths through simple searches.
| Market Analysis | |||||||
| Year 1 | Year 2 | Year 3 | Year 4 | Year 5 | |||
| Potential Customers | Growth | CAGR | |||||
| Building Management Companies | 1% | 100 | 101 | 102 | 103 | 104 | 0.99% |
| Homeowners | 1% | 8,000 | 8,080 | 8,161 | 8,243 | 8,325 | 1.00% |
| Apartment Renters | 1% | 7,000 | 7,070 | 7,141 | 7,212 | 7,284 | 1.00% |
| Businesses with Real Estate | 1% | 1,000 | 1,010 | 1,020 | 1,030 | 1,040 | 0.99% |
| Other Landlords | 1% | 1,000 | 1,010 | 1,020 | 1,030 | 1,040 | 0.99% |
| Total | 1.00% | 17,100 | 17,271 | 17,444 | 17,618 | 17,793 | 1.00% |
4.2 Target Market Segment Strategy
To seek the most profitable market segments in South Kelleton overall, SKelleton Keys will focus on building management companies, homeowners, and businesses with real estate. Each spend a greater dollar per transaction on locks and generally will have multiple locks or installations sold with every deal.
Furthermore, apartment renters may be referred to SKelleton Keys by their building management companies, creating future revenues from this segment if building managers are sought out first.
4.3 Service Business Analysis
The ALOA (Associated Locksmiths of America), an organization which provides accreditation for locksmiths, provides the following information:
A professionally trained locksmith/security professional may do some or all of the following: install locks, deadbolts and other mechanical or electronic locking devices to safeguard homes, businesses, vehicles and other property. Locksmiths also may modify or repair such devices, rekey locks, make duplicate keys or cards, generate or program new keys/cards for locks whose keys/cards have been lost and respond to emergency calls to unlock vehicles, homes and businesses that have been locked accidentally, or whose locks have malfunctioned.
Some locksmiths install and service electronic alarm and surveillance systems. Many locksmiths specify, design, provide, install and service a wide range of electronic access control systems and closed circuit television (CCTV) systems. Because of the integration of electronic security systems with computers and networks, some locksmiths maintain security hardware and software for computer systems.
When new or replacement locks are required, a locksmith assists the customer in determining the correct types of locks needed based on the security risk/exposure, life safety application and frequency of use. The locksmith installs locks and security devices using manufacturer’s templates and/or industry specifications, by cutting or drilling the proper opening in the selected location with small hand and power tools.
A locksmith may sell, service and install safes for home and business use. Banks have many locking devices and related hardware that require regular service by locksmiths such as; vault doors, time locks, safe deposit boxes and teller equipment.
A locksmith repairs a lock by disassembling and examining it to locate worn or malfunctioning parts, then cleans and adjusts the internal mechanisms and replaces these parts with new ones supplied by the lock’s manufacturer. On occasion, it may be necessary to custom make some repair parts using lathes, drills, grinders, and other power and hand tools. When the repairs have been completed, the locksmith will reassemble the lock and check its operation.
A locksmith makes duplicate keys using a key-duplicating machine. With the customer’s (pattern) key and key blank clamped in their respective vises, the locksmith moves the pattern key across the guide. A rotary cutter cuts the same pattern into the key blank. The locksmith carefully examines the new key to ensure its accuracy.
A locksmith may respond to emergency calls for customers who have accidentally become locked out of a home, business or vehicle. The locksmith begins by examining the lock(s) to determine the best method to circumvent the lock. These methods may include use of lock picks, bypass tools or other special instruments. Fitting a key by code or other skilled means is also a method of opening a lock. Experience, skill and knowledge dictate the method a professional selects to open a lock. There are times when the quality of the lock, concern for safety of occupants and other factors such as a malfunction of the lock may force the locksmith to use destructive techniques to gain entry. Before performing an emergency opening or certain other sensitive tasks, the locksmith may require positive ID procedures.
For security reasons or because keys are stolen or misplaced, many businesses, hotels/motels and apartment complex owners contract with locksmiths to provide new master key systems, reset combinations and rekey their door locks on a regular basis. Some cities and states require locksmiths to be licensed and bonded. The licensing process may include submitting fingerprints, undergoing a state or national background check, passing an examination, and paying a fee to the licensing agency. A self-employed locksmith must also keep business records and maintain a proper inventory of locks, parts, keys and tools.
In our state alone over 290 locksmith businesses are registered with the ALOA and South Kelleton includes 20.
4.3.1 Competition and Buying Patterns
Neighborhood locksmiths with shops depend on a steady stream of street traffic. As some are provided within hardware stores, many of these shops are not aggressive in their competition for business and are susceptible to aggressive marketing by other locksmith businesses. Because the locksmith industry sells to both consumers and businesses, a combination of “pull” marketing through advertising and “push” selling through directed sales efforts are used.
Customers will choose locksmith shops based on their location, the range of security options available, the helpfulness of sales staff, and, finally, price. Some prefer hardware stores with locksmiths which can handle more of their needs in one stop, while others look for specialists because of the greater level of service and expertise they generally provide.
Web Plan Summary
The South Kelleton Keys and Locksmith website will offer basic information about the business, with details on the product line carried, but stopping short of offering e-commerce. Customers will be referred to go to the store to purchase items and to call to schedule consultations. The website will act as an extended brochure for the business for both residential and commercial customers.
5.1 Website Marketing Strategy
The South Kelleton Keys and Locksmith website will be marketed through the following means:
- Search engine marketing – the purchasing of keywords on Google AdWords which attract local businesses and residents to the store
- Mention of the website URL on business cards and brochures distributed by the business
- Mention of the website URL on all ads and flyers
5.2 Development Requirements
The South Kelleton Keys and Locksmith website should offer the following functions:
- About Us – Description of the business, Padraic Lawkse, and its mission in the South Kelleton community
- Store Products – Images (from manufacturers) and basic pricing on some products
- Services – Description of the services offered by SKelleton Keys
- Partners – Listings of other security businesses which SKelleton Keys partners with to offer electronic and advanced security systems
- Hours and Location/Directions
- Contact Information
Strategy and Implementation Summary
To launch South Kelleton Keys and Locksmith, Pad Lawkse must establish its credibility through a product line of quality lock hardware and expert knowledge about locks and security, as well as its visibility through direct selling to businesses and street/community visibility to homeowners in South Kelleton. Product sales will be achieved through its storefront location and services will be rendered on client sites primarily.
6.1 Competitive Edge
South Kelleton Keys and Locksmith will compete by specializing in lock and security concerns, establishing relationships with other security businesses to create a network of additional vendors to serve clients, and by maintaining its expertise through ALOA training.
By specializing in locks and security rather than carrying other types of home and building hardware, the business will focus on its core strength and expertise and develop a reputation in the neighborhood as a specialist.
To offer high-tech security systems, SKelleton Keys will develop a list of preferred security vendors to whom they are comfortable sending on business requiring more specialized security. These vendors will pay a commission to SKelleton Keys on every sale they make through these referrals.
Padraic Lawkse will develop his locksmithing expertise through additional training with the Associated Locksmiths of America. He is currently a Certified Professional Locksmith and will work towards certification as a Certified Master Locksmith, the highest category available. This will ensure that Pad Lawkse’s expertise in locks and security will make customers confident in the service of the business and allow Pad Lawkse to recommend upgrades as they become available or less expensive, when appropriate.
6.2 Marketing Strategy
South Kelleton Keys and Locksmith will focus on business sales to building management companies and businesses with real estate as well as consumer sales to homeowners. This requires a dual approach to marketing.
The following tactics are part of the business sales focus:
- Design and produce brochures advertising the services offered by South Kelleton Keys and Locksmith
- Develop a list of businesses in the neighborhood and import this list into salesforce.com
- Send brochures by direct mail to this list
- Advertise in trade publications for building management companies
- Search engine marketing: Bid for keywords around business and building security using Google AdWords
- Sales efforts to follow up with businesses (see sales strategy)
- Creating a website for the business and offering additional information beyond the brochure
The following tactics are part of the consumer sales focus:
- Create attractive signage and post outside and in windows of store to build street visibility
- Put ad in local newsletters advertising opening of the store
- Post flyers about the store opening on local bulletin boards in stores and public places
- Decorate the store for its grand opening and offering free gifts of store branded key chains to early visitors while supplies last
- Creating a website for the business with information on store products, hours, location, contact information, etc.
6.3 Sales Strategy
Padraic Lawkse will direct the sales efforts of the business which will focus on business sales. He will generate lists of building management companies and area businesses, and use both phone calls and site visits to make management aware of South Kelleton Keys and Locksmith and to qualify the potential customers for future conversations.
These lists will be kept in a salesforce.com account in order to track sales activities and to collect customer information for those who convert to customers.
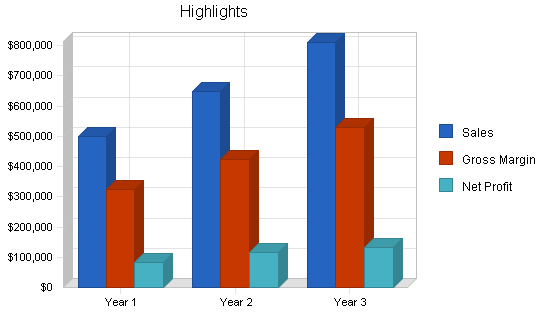
6.3.1 Sales Forecast
The sales forecast shows that hardware sales and installations will drive the revenue of the business. While hardware sales are a key driver, services provide a much greater gross margin (80% versus 40%). Commissions on referrals to other security businesses will be extremely profitable as the gross margin on these referral fees nears 100%.
Significant growth is expected over the first year and then 30% annual growth in year 2 and 25% in year 3. This is based on continued saturation of the South Kelleton market as building managers begin to refer tenants to SKelleton Keys. A key assumption is that the current locksmith offerings in South Kelleton are lacking and that businesses, homeowners, and building managers will be eager to work with an experienced locksmith with a local shop.


| Sales Forecast | |||
| Year 1 | Year 2 | Year 3 | |
| Sales | |||
| Hardware Products | $222,964 | $289,853 | $362,317 |
| Key Services | $22,296 | $28,985 | $36,231 |
| Repair Services | $37,147 | $48,291 | $60,364 |
| Installation Services | $111,499 | $144,949 | $181,186 |
| Emergency Services | $29,756 | $38,683 | $48,354 |
| Referral Commissions | $74,329 | $96,628 | $120,785 |
| Total Sales | $497,991 | $647,388 | $809,235 |
| Direct Cost of Sales | Year 1 | Year 2 | Year 3 |
| Hardware Cost | $133,778 | $171,013 | $213,767 |
| Services Cost | $40,140 | $52,181 | $65,227 |
| Subtotal Direct Cost of Sales | $173,918 | $223,195 | $278,994 |
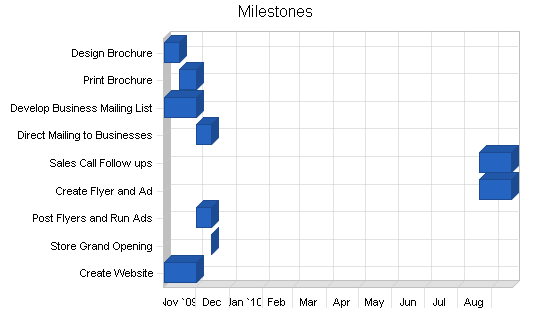
6.4 Milestones
The milestone chart shows the execution of the pre-launch marketing activities and the use of $10,000 in marketing funding. The expense for the grand opening is to order store-branded key chains as gifts for customers who visit the store while supplies last.
| Milestones | |||||
| Milestone | Start Date | End Date | Budget | Manager | Department |
| Design Brochure | 11/1/2009 | 11/15/2009 | $500 | Owner | SKLK |
| Print Brochure | 11/15/2009 | 12/1/2009 | $2,000 | Owner | SKLK |
| Develop Business Mailing List | 11/1/2009 | 12/1/2009 | $0 | Owner | SKLK |
| Direct Mailing to Businesses | 12/1/2009 | 12/15/2009 | $2,000 | Owner | SKLK |
| Sales Call Follow ups | 8/20/2010 | 9/19/2010 | $0 | Owner | SKLK |
| Create Flyer and Ad | 8/20/2010 | 9/19/2010 | $500 | Owner | SKLK |
| Post Flyers and Run Ads | 12/1/2009 | 12/15/2009 | $3,000 | Owner | SKLK |
| Store Grand Opening | 12/15/2009 | 12/15/2009 | $1,000 | Owner | SKLK |
| Create Website | 11/1/2009 | 12/1/2009 | $1,000 | Owner | SKLK |
| Totals | $10,000 | ||||
Management Summary
Padraic Lawkse, CEO, will manage all store operations, direct sales and marketing, hire, train, and supervise employees, and provide services. He will hire an assistant store manager to staff the store in the first year of operation. The assistant manager will be responsible for bookkeeping, purchasing, basic cleaning, and opening or closing the store. He will run the store during normal business hours five days a week, while Pad Lawkse will run the store on weekends and be present in the store at times during the week when he is not on service calls.
Store staff will be increased in subsequent years. He will also add an additional apprentice locksmith in the third year who will take over basic services and installations, leaving Pad Lawkse to focus on on-site consultations and services requiring greater skill or experience.
7.1 Personnel Plan
As the business is an LLC and Pad Lawkse is the sole member, he will receive all profits from the business, but is not required to take a salary. However, a salary is shown to assist with his tax planning and budgeting. The assistant store manager will be paid a competitive salary with a bonus for performance. An additional store staff person will be hired halfway through the second year and will be paid hourly. This employee will assist with store sales and running the store, leaving store management to the assistant manager.
The assistant locksmith will be hired part way through the third year. He or she will be paid a salary plus bonus and be required to continue seeking additional certifications with the ALOA. This individual will be enticed to stay with the company through growing responsibilities, experience, and pay in future years.
The business will provide health insurance for full-time employees as well as paid sick leave and paid vacation.
| Personnel Plan | |||
| Year 1 | Year 2 | Year 3 | |
| Owner | $51,000 | $72,000 | $84,000 |
| Assistant Store Manager | $48,000 | $52,000 | $56,000 |
| Store Staff | $0 | $15,000 | $35,000 |
| Assistant Locksmith | $0 | $0 | $20,000 |
| Total People | 2 | 3 | 4 |
| Total Payroll | $99,000 | $139,000 | $195,000 |
Financial Plan
South Kelleton Keys and Locksmith will be able to launch based on the savings of its owner and a significant long-term loan, as described in the start-up funding description. After this point, the business will show healthy profits and cash balance to be able to grow with its own cash flow. Steady growth is expected, requiring additional staff, but still using the same basic assets (store, inventory, equipment, etc.) for the most part. As assistant locksmiths work primarily in the field at customer sites, a larger facility is not required to take them on. The owner will keep a healthy cash balance in the business for emergencies and will withdraw additional cash as dividends.
8.1 Start-up Funding
Padraic Lawkse will invest significant startup funding out of his savings and from a credit card line-of-credit to launch the business (current borrowing on the Start-up Funding table). A business loan is sought against the assets of the business to be repaid over the first three years of operation.
| Start-up Funding | |
| Start-up Expenses to Fund | $32,750 |
| Start-up Assets to Fund | $144,250 |
| Total Funding Required | $177,000 |
| Assets | |
| Non-cash Assets from Start-up | $100,000 |
| Cash Requirements from Start-up | $44,250 |
| Additional Cash Raised | $0 |
| Cash Balance on Starting Date | $44,250 |
| Total Assets | $144,250 |
| Liabilities and Capital | |
| Liabilities | |
| Current Borrowing | $10,000 |
| Long-term Liabilities | $70,000 |
| Accounts Payable (Outstanding Bills) | $20,000 |
| Other Current Liabilities (interest-free) | $0 |
| Total Liabilities | $100,000 |
| Capital | |
| Planned Investment | |
| Owner | $77,000 |
| Other | $0 |
| Additional Investment Requirement | $0 |
| Total Planned Investment | $77,000 |
| Loss at Start-up (Start-up Expenses) | ($32,750) |
| Total Capital | $44,250 |
| Total Capital and Liabilities | $144,250 |
| Total Funding | $177,000 |
8.2 Important Assumptions
This business plan assumes the availability of potential staff due to a favorable job market and the availability of storefronts to launch the business.
8.3 Break-even Analysis
With a monthly break-even shown in the table below the business is expected to reach break-even from a profit perspective in the seventh month of the first year.

| Break-even Analysis | |
| Monthly Revenue Break-even | $25,681 |
| Assumptions: | |
| Average Percent Variable Cost | 35% |
| Estimated Monthly Fixed Cost | $16,713 |
8.4 Projected Profit and Loss
The primary operating expenses for the business will be marketing and promotion which will include advertising, producing direct mail pieces and brochures, ongoing website hosting and maintenance and attending events.
Depreciation of long-term assets includes equipment in the store and tools for services, including both the equipment and tools purchased at start-up and allowances for additional purchases (which are shown on the cash flow statement).
Rent is expected to rise and the business will seek a 5+ year lease on an appropriate storefront space of at least 1,000 square feet.
Insurance and bonding includes ongoing insurance payment for general liability for the store and work at client sites and the van, as well as renewals of the surety bond each year.
Payroll taxes includes payments for health insurance for full-time employees.
Store supplies includes all supplies (not inventory) which are expensed immediately for store cleaning, maintenance, and operation.
Van fuel, maintenance, and parking covers the cost of fuel, ongoing maintenance and upkeep of the van, and parking at customer sites when only pay parking is available.
Training and education includes subscriptions and course work for Padraic Lawkse and for the assistant locksmith to seek expertise in locksmith work.


| Pro Forma Profit and Loss | |||
| Year 1 | Year 2 | Year 3 | |
| Sales | $497,991 | $647,388 | $809,235 |
| Direct Cost of Sales | $173,918 | $223,195 | $278,994 |
| Other Costs of Sales | $0 | $0 | $0 |
| Total Cost of Sales | $173,918 | $223,195 | $278,994 |
| Gross Margin | $324,073 | $424,193 | $530,242 |
| Gross Margin % | 65.08% | 65.52% | 65.52% |
| Expenses | |||
| Payroll | $99,000 | $139,000 | $195,000 |
| Marketing/Promotion | $36,000 | $40,000 | $50,000 |
| Depreciation | $18,000 | $18,000 | $18,000 |
| Rent | $24,000 | $26,000 | $28,000 |
| Utilities | $2,400 | $2,500 | $2,600 |
| Insurance & Bonding | $3,600 | $3,800 | $4,000 |
| Payroll Taxes | $0 | $0 | $0 |
| Store Supplies | $6,000 | $10,000 | $15,000 |
| Van Fuel, Maintenance & Parking | $5,550 | $7,200 | $7,800 |
| Training and Education | $6,000 | $8,000 | $15,000 |
| Total Operating Expenses | $200,550 | $254,500 | $335,400 |
| Profit Before Interest and Taxes | $123,523 | $169,693 | $194,842 |
| EBITDA | $141,523 | $187,693 | $212,842 |
| Interest Expense | $7,354 | $5,010 | $3,670 |
| Taxes Incurred | $34,851 | $49,405 | $57,352 |
| Net Profit | $81,318 | $115,278 | $133,820 |
| Net Profit/Sales | 16.33% | 17.81% | 16.54% |
8.5 Projected Cash Flow
Cash flow will become consistently positive by month 6, removing the need for additional funding to get the store and business off the ground. The business will attempt to keep a healthy cash balance in reserve for the potential that equipment or other assets must be repaired or replaced. Steady investments in the assets of the business have been worked in to these projections to account for the gradual replacement of equipment.
The cash flow table shows a budget for the purchase of additional tools and equipment as they become worn out, broken, or lost, and for purchasing tools to install and maintain new types of security devices as they are released to the market so South Kelleton Keys and Locksmith can remain up to date.
The owner will take out dividends from the business when cash flow can support it, while keeping a cash reserve of around $50,000 at any given time in the second and third year in the business.
The borrowing on credit cards will be paid off over the first year.

| Pro Forma Cash Flow | |||
| Year 1 | Year 2 | Year 3 | |
| Cash Received | |||
| Cash from Operations | |||
| Cash Sales | $373,493 | $485,541 | $606,927 |
| Cash from Receivables | $83,703 | $149,609 | $189,051 |
| Subtotal Cash from Operations | $457,196 | $635,150 | $795,977 |
| Additional Cash Received | |||
| Sales Tax, VAT, HST/GST Received | $0 | $0 | $0 |
| New Current Borrowing | $0 | $0 | $0 |
| New Other Liabilities (interest-free) | $0 | $0 | $0 |
| New Long-term Liabilities | $0 | $0 | $0 |
| Sales of Other Current Assets | $0 | $0 | $0 |
| Sales of Long-term Assets | $0 | $0 | $0 |
| New Investment Received | $0 | $0 | $0 |
| Subtotal Cash Received | $457,196 | $635,150 | $795,977 |
| Expenditures | Year 1 | Year 2 | Year 3 |
| Expenditures from Operations | |||
| Cash Spending | $99,000 | $139,000 | $195,000 |
| Bill Payments | $279,896 | $407,988 | $465,862 |
| Subtotal Spent on Operations | $378,896 | $546,988 | $660,862 |
| Additional Cash Spent | |||
| Sales Tax, VAT, HST/GST Paid Out | $0 | $0 | $0 |
| Principal Repayment of Current Borrowing | $10,000 | $0 | $0 |
| Other Liabilities Principal Repayment | $0 | $0 | $0 |
| Long-term Liabilities Principal Repayment | $13,200 | $13,400 | $13,400 |
| Purchase Other Current Assets | $6,000 | $8,000 | $10,000 |
| Purchase Long-term Assets | $3,000 | $15,000 | $20,000 |
| Dividends | $0 | $45,000 | $65,000 |
| Subtotal Cash Spent | $411,096 | $628,388 | $769,262 |
| Net Cash Flow | $46,100 | $6,762 | $26,715 |
| Cash Balance | $90,350 | $97,112 | $123,828 |
8.6 Projected Balance Sheet
The business will pay off its current borrowing in its first year of operation and its long-term liabilities over the first three years. Aside from a contingency fund, the business will not retain a great deal of cash in the business, but will pay profits out as dividends for the most part. Net worth will grow steadily, but not radically, over the first three years of operation for this reason.
| Pro Forma Balance Sheet | |||
| Year 1 | Year 2 | Year 3 | |
| Assets | |||
| Current Assets | |||
| Cash | $90,350 | $97,112 | $123,828 |
| Accounts Receivable | $40,795 | $53,033 | $66,291 |
| Inventory | $83,869 | $62,147 | $75,666 |
| Other Current Assets | $26,000 | $34,000 | $44,000 |
| Total Current Assets | $241,014 | $246,292 | $309,785 |
| Long-term Assets | |||
| Long-term Assets | $43,000 | $58,000 | $78,000 |
| Accumulated Depreciation | $18,000 | $36,000 | $54,000 |
| Total Long-term Assets | $25,000 | $22,000 | $24,000 |
| Total Assets | $266,014 | $268,292 | $333,785 |
| Liabilities and Capital | Year 1 | Year 2 | Year 3 |
| Current Liabilities | |||
| Accounts Payable | $83,646 | $29,046 | $39,118 |
| Current Borrowing | $0 | $0 | $0 |
| Other Current Liabilities | $0 | $0 | $0 |
| Subtotal Current Liabilities | $83,646 | $29,046 | $39,118 |
| Long-term Liabilities | $56,800 | $43,400 | $30,000 |
| Total Liabilities | $140,446 | $72,446 | $69,118 |
| Paid-in Capital | $77,000 | $77,000 | $77,000 |
| Retained Earnings | ($32,750) | $3,568 | $53,847 |
| Earnings | $81,318 | $115,278 | $133,820 |
| Total Capital | $125,568 | $195,847 | $264,667 |
| Total Liabilities and Capital | $266,014 | $268,292 | $333,785 |
| Net Worth | $125,568 | $195,847 | $264,667 |
8.7 Business Ratios
South Kelleton Keys and Locksmith’s business ratios are compared here to SIC code 7699 for locksmith businesses with annual sales of $500,000 to $1 million. Due to its ownership of a store, SKelleton Keys’ ratios will differ from the average locksmith of a similar volume of sales, as many locksmiths work only from a van. It will carry more inventory and will hold more accounts receivables due to its higher level of business sales. The gross margin is driven higher due to the revenue stream of referral commissions which is almost entirely gross profit.
| Ratio Analysis | ||||
| Year 1 | Year 2 | Year 3 | Industry Profile | |
| Sales Growth | n.a. | 30.00% | 25.00% | -1.05% |
| Percent of Total Assets | ||||
| Accounts Receivable | 15.34% | 19.77% | 19.86% | 12.28% |
| Inventory | 31.53% | 23.16% | 22.67% | 13.40% |
| Other Current Assets | 9.77% | 12.67% | 13.18% | 36.14% |
| Total Current Assets | 90.60% | 91.80% | 92.81% | 61.83% |
| Long-term Assets | 9.40% | 8.20% | 7.19% | 38.17% |
| Total Assets | 100.00% | 100.00% | 100.00% | 100.00% |
| Current Liabilities | 31.44% | 10.83% | 11.72% | 30.66% |
| Long-term Liabilities | 21.35% | 16.18% | 8.99% | 58.05% |
| Total Liabilities | 52.80% | 27.00% | 20.71% | 88.70% |
| Net Worth | 47.20% | 73.00% | 79.29% | 11.30% |
| Percent of Sales | ||||
| Sales | 100.00% | 100.00% | 100.00% | 100.00% |
| Gross Margin | 65.08% | 65.52% | 65.52% | 53.42% |
| Selling, General & Administrative Expenses | 48.75% | 47.72% | 48.99% | 22.29% |
| Advertising Expenses | 7.23% | 6.18% | 6.18% | 1.36% |
| Profit Before Interest and Taxes | 24.80% | 26.21% | 24.08% | 6.01% |
| Main Ratios | ||||
| Current | 2.88 | 8.48 | 7.92 | 1.53 |
| Quick | 1.88 | 6.34 | 5.98 | 1.09 |
| Total Debt to Total Assets | 52.80% | 27.00% | 20.71% | 88.70% |
| Pre-tax Return on Net Worth | 92.51% | 84.09% | 72.23% | 245.85% |
| Pre-tax Return on Assets | 43.67% | 61.38% | 57.27% | 27.77% |
| Additional Ratios | Year 1 | Year 2 | Year 3 | |
| Net Profit Margin | 16.33% | 17.81% | 16.54% | n.a |
| Return on Equity | 64.76% | 58.86% | 50.56% | n.a |
| Activity Ratios | ||||
| Accounts Receivable Turnover | 3.05 | 3.05 | 3.05 | n.a |
| Collection Days | 41 | 106 | 108 | n.a |
| Inventory Turnover | 4.61 | 3.06 | 4.05 | n.a |
| Accounts Payable Turnover | 4.11 | 12.17 | 12.17 | n.a |
| Payment Days | 29 | 58 | 26 | n.a |
| Total Asset Turnover | 1.87 | 2.41 | 2.42 | n.a |
| Debt Ratios | ||||
| Debt to Net Worth | 1.12 | 0.37 | 0.26 | n.a |
| Current Liab. to Liab. | 0.60 | 0.40 | 0.57 | n.a |
| Liquidity Ratios | ||||
| Net Working Capital | $157,368 | $217,247 | $270,667 | n.a |
| Interest Coverage | 16.80 | 33.87 | 53.09 | n.a |
| Additional Ratios | ||||
| Assets to Sales | 0.53 | 0.41 | 0.41 | n.a |
| Current Debt/Total Assets | 31% | 11% | 12% | n.a |
| Acid Test | 1.39 | 4.51 | 4.29 | n.a |
| Sales/Net Worth | 3.97 | 3.31 | 3.06 | n.a |
| Dividend Payout | 0.00 | 0.39 | 0.49 | n.a |
Appendix
| Sales Forecast | |||||||||||||
| Month 1 | Month 2 | Month 3 | Month 4 | Month 5 | Month 6 | Month 7 | Month 8 | Month 9 | Month 10 | Month 11 | Month 12 | ||
| Sales | |||||||||||||
| Hardware Products | $3,000 | $3,900 | $5,070 | $6,591 | $8,568 | $11,138 | $14,479 | $18,823 | $24,470 | $31,811 | $41,354 | $53,760 | |
| Key Services | $300 | $390 | $507 | $659 | $857 | $1,114 | $1,448 | $1,882 | $2,447 | $3,181 | $4,135 | $5,376 | |
| Repair Services | $500 | $650 | $845 | $1,098 | $1,427 | $1,855 | $2,412 | $3,136 | $4,077 | $5,300 | $6,890 | $8,957 | |
| Installation Services | $1,500 | $1,950 | $2,535 | $3,296 | $4,285 | $5,570 | $7,241 | $9,413 | $12,237 | $15,908 | $20,680 | $26,884 | |
| Emergency Services | $400 | $520 | $676 | $879 | $1,143 | $1,486 | $1,932 | $2,512 | $3,266 | $4,246 | $5,520 | $7,176 | |
| Referral Commissions | $1,000 | $1,300 | $1,690 | $2,197 | $2,856 | $3,713 | $4,827 | $6,275 | $8,158 | $10,605 | $13,786 | $17,922 | |
| Total Sales | $6,700 | $8,710 | $11,323 | $14,720 | $19,136 | $24,876 | $32,339 | $42,041 | $54,655 | $71,051 | $92,365 | $120,075 | |
| Direct Cost of Sales | Month 1 | Month 2 | Month 3 | Month 4 | Month 5 | Month 6 | Month 7 | Month 8 | Month 9 | Month 10 | Month 11 | Month 12 | |
| Hardware Cost | $1,800 | $2,340 | $3,042 | $3,955 | $5,141 | $6,683 | $8,687 | $11,294 | $14,682 | $19,087 | $24,812 | $32,256 | |
| Services Cost | $540 | $702 | $913 | $1,186 | $1,542 | $2,005 | $2,607 | $3,389 | $4,405 | $5,727 | $7,445 | $9,679 | |
| Subtotal Direct Cost of Sales | $2,340 | $3,042 | $3,955 | $5,141 | $6,683 | $8,688 | $11,294 | $14,682 | $19,087 | $24,814 | $32,257 | $41,935 | |
| Personnel Plan | |||||||||||||
| Month 1 | Month 2 | Month 3 | Month 4 | Month 5 | Month 6 | Month 7 | Month 8 | Month 9 | Month 10 | Month 11 | Month 12 | ||
| Owner | $4,000 | $4,000 | $4,000 | $4,000 | $4,000 | $4,000 | $4,000 | $4,000 | $4,000 | $4,000 | $5,000 | $6,000 | |
| Assistant Store Manager | $4,000 | $4,000 | $4,000 | $4,000 | $4,000 | $4,000 | $4,000 | $4,000 | $4,000 | $4,000 | $4,000 | $4,000 | |
| Store Staff | $0 | $0 | $0 | $0 | $0 | $0 | $0 | $0 | $0 | $0 | $0 | $0 | |
| Assistant Locksmith | $0 | $0 | $0 | $0 | $0 | $0 | $0 | $0 | $0 | $0 | $0 | $0 | |
| Total People | 2 | 2 | 2 | 2 | 2 | 2 | 2 | 2 | 2 | 2 | 2 | 2 | |
| Total Payroll | $8,000 | $8,000 | $8,000 | $8,000 | $8,000 | $8,000 | $8,000 | $8,000 | $8,000 | $8,000 | $9,000 | $10,000 | |
| Pro Forma Profit and Loss | |||||||||||||
| Month 1 | Month 2 | Month 3 | Month 4 | Month 5 | Month 6 | Month 7 | Month 8 | Month 9 | Month 10 | Month 11 | Month 12 | ||
| Sales | $6,700 | $8,710 | $11,323 | $14,720 | $19,136 | $24,876 | $32,339 | $42,041 | $54,655 | $71,051 | $92,365 | $120,075 | |
| Direct Cost of Sales | $2,340 | $3,042 | $3,955 | $5,141 | $6,683 | $8,688 | $11,294 | $14,682 | $19,087 | $24,814 | $32,257 | $41,935 | |
| Other Costs of Sales | $0 | $0 | $0 | $0 | $0 | $0 | $0 | $0 | $0 | $0 | $0 | $0 | |
| Total Cost of Sales | $2,340 | $3,042 | $3,955 | $5,141 | $6,683 | $8,688 | $11,294 | $14,682 | $19,087 | $24,814 | $32,257 | $41,935 | |
| Gross Margin | $4,360 | $5,668 | $7,368 | $9,579 | $12,453 | $16,188 | $21,045 | $27,359 | $35,568 | $46,237 | $60,108 | $78,140 | |
| Gross Margin % | 65.07% | 65.07% | 65.07% | 65.07% | 65.08% | 65.08% | 65.08% | 65.08% | 65.08% | 65.08% | 65.08% | 65.08% | |
| Expenses | |||||||||||||
| Payroll | $8,000 | $8,000 | $8,000 | $8,000 | $8,000 | $8,000 | $8,000 | $8,000 | $8,000 | $8,000 | $9,000 | $10,000 | |
| Marketing/Promotion | $3,000 | $3,000 | $3,000 | $3,000 | $3,000 | $3,000 | $3,000 | $3,000 | $3,000 | $3,000 | $3,000 | $3,000 | |
| Depreciation | $1,500 | $1,500 | $1,500 | $1,500 | $1,500 | $1,500 | $1,500 | $1,500 | $1,500 | $1,500 | $1,500 | $1,500 | |
| Rent | $2,000 | $2,000 | $2,000 | $2,000 | $2,000 | $2,000 | $2,000 | $2,000 | $2,000 | $2,000 | $2,000 | $2,000 | |
| Utilities | $200 | $200 | $200 | $200 | $200 | $200 | $200 | $200 | $200 | $200 | $200 | $200 | |
| Insurance & Bonding | $300 | $300 | $300 | $300 | $300 | $300 | $300 | $300 | $300 | $300 | $300 | $300 | |
| Payroll Taxes | $0 | $0 | $0 | $0 | $0 | $0 | $0 | $0 | $0 | $0 | $0 | $0 | |
| Store Supplies | $500 | $500 | $500 | $500 | $500 | $500 | $500 | $500 | $500 | $500 | $500 | $500 | |
| Van Fuel, Maintenance & Parking | 15.00% | $300 | $350 | $400 | $450 | $475 | $500 | $500 | $500 | $500 | $525 | $525 | $525 |
| Training and Education | $500 | $500 | $500 | $500 | $500 | $500 | $500 | $500 | $500 | $500 | $500 | $500 | |
| Total Operating Expenses | $16,300 | $16,350 | $16,400 | $16,450 | $16,475 | $16,500 | $16,500 | $16,500 | $16,500 | $16,525 | $17,525 | $18,525 | |
| Profit Before Interest and Taxes | ($11,940) | ($10,682) | ($9,032) | ($6,871) | ($4,022) | ($312) | $4,545 | $10,859 | $19,068 | $29,712 | $42,583 | $59,615 | |
| EBITDA | ($10,440) | ($9,182) | ($7,532) | ($5,371) | ($2,522) | $1,188 | $6,045 | $12,359 | $20,568 | $31,212 | $44,083 | $61,115 | |
| Interest Expense | $699 | $690 | $681 | $672 | $656 | $641 | $619 | $598 | $576 | $542 | $508 | $473 | |
| Taxes Incurred | ($3,792) | ($3,412) | ($2,914) | ($2,263) | ($1,404) | ($286) | $1,178 | $3,078 | $5,548 | $8,751 | $12,623 | $17,743 | |
| Net Profit | ($8,847) | ($7,960) | ($6,799) | ($5,280) | ($3,275) | ($667) | $2,748 | $7,183 | $12,944 | $20,420 | $29,453 | $41,399 | |
| Net Profit/Sales | -132.05% | -91.39% | -60.04% | -35.87% | -17.11% | -2.68% | 8.50% | 17.09% | 23.68% | 28.74% | 31.89% | 34.48% | |
| Pro Forma Cash Flow | |||||||||||||
| Month 1 | Month 2 | Month 3 | Month 4 | Month 5 | Month 6 | Month 7 | Month 8 | Month 9 | Month 10 | Month 11 | Month 12 | ||
| Cash Received | |||||||||||||
| Cash from Operations | |||||||||||||
| Cash Sales | $5,025 | $6,533 | $8,492 | $11,040 | $14,352 | $18,657 | $24,254 | $31,531 | $40,991 | $53,288 | $69,274 | $90,056 | |
| Cash from Receivables | $0 | $893 | $1,943 | $2,526 | $3,284 | $4,269 | $5,549 | $7,214 | $9,378 | $12,192 | $15,850 | $20,605 | |
| Subtotal Cash from Operations | $5,025 | $7,426 | $10,435 | $13,566 | $17,636 | $22,926 | $29,804 | $38,745 | $50,370 | $65,480 | $85,124 | $110,661 | |
| Additional Cash Received | |||||||||||||
| Sales Tax, VAT, HST/GST Received | 0.00% | $0 | $0 | $0 | $0 | $0 | $0 | $0 | $0 | $0 | $0 | $0 | $0 |
| New Current Borrowing | $0 | $0 | $0 | $0 | $0 | $0 | $0 | $0 | $0 | $0 | $0 | $0 | |
| New Other Liabilities (interest-free) | $0 | $0 | $0 | $0 | $0 | $0 | $0 | $0 | $0 | $0 | $0 | $0 | |
| New Long-term Liabilities | $0 | $0 | $0 | $0 | $0 | $0 | $0 | $0 | $0 | $0 | $0 | $0 | |
| Sales of Other Current Assets | $0 | $0 | $0 | $0 | $0 | $0 | $0 | $0 | $0 | $0 | $0 | $0 | |
| Sales of Long-term Assets | $0 | $0 | $0 | $0 | $0 | $0 | $0 | $0 | $0 | $0 | $0 | $0 | |
| New Investment Received | $0 | $0 | $0 | $0 | $0 | $0 | $0 | $0 | $0 | $0 | $0 | $0 | |
| Subtotal Cash Received | $5,025 | $7,426 | $10,435 | $13,566 | $17,636 | $22,926 | $29,804 | $38,745 | $50,370 | $65,480 | $85,124 | $110,661 | |
| Expenditures | Month 1 | Month 2 | Month 3 | Month 4 | Month 5 | Month 6 | Month 7 | Month 8 | Month 9 | Month 10 | Month 11 | Month 12 | |
| Expenditures from Operations | |||||||||||||
| Cash Spending | $8,000 | $8,000 | $8,000 | $8,000 | $8,000 | $8,000 | $8,000 | $8,000 | $8,000 | $8,000 | $9,000 | $10,000 | |
| Bill Payments | $20,124 | $3,721 | $4,146 | $4,690 | $5,388 | $6,506 | $14,937 | $25,531 | $32,431 | $41,406 | $53,074 | $67,941 | |
| Subtotal Spent on Operations | $28,124 | $11,721 | $12,146 | $12,690 | $13,388 | $14,506 | $22,937 | $33,531 | $40,431 | $49,406 | $62,074 | $77,941 | |
| Additional Cash Spent | |||||||||||||
| Sales Tax, VAT, HST/GST Paid Out | $0 | $0 | $0 | $0 | $0 | $0 | $0 | $0 | $0 | $0 | $0 | $0 | |
| Principal Repayment of Current Borrowing | $0 | $0 | $0 | $0 | $500 | $500 | $1,000 | $1,000 | $1,000 | $2,000 | $2,000 | $2,000 | |
| Other Liabilities Principal Repayment | $0 | $0 | $0 | $0 | $0 | $0 | $0 | $0 | $0 | $0 | $0 | $0 | |
| Long-term Liabilities Principal Repayment | $1,100 | $1,100 | $1,100 | $1,100 | $1,100 | $1,100 | $1,100 | $1,100 | $1,100 | $1,100 | $1,100 | $1,100 | |
| Purchase Other Current Assets | $500 | $500 | $500 | $500 | $500 | $500 | $500 | $500 | $500 | $500 | $500 | $500 | |
| Purchase Long-term Assets | $0 | $0 | $0 | $0 | $0 | $0 | $500 | $500 | $500 | $500 | $500 | $500 | |
| Dividends | $0 | $0 | $0 | $0 | $0 | $0 | $0 | $0 | $0 | $0 | $0 | $0 | |
| Subtotal Cash Spent | $29,724 | $13,321 | $13,746 | $14,290 | $15,488 | $16,606 | $26,037 | $36,631 | $43,531 | $53,506 | $66,174 | $82,041 | |
| Net Cash Flow | ($24,699) | ($5,896) | ($3,311) | ($724) | $2,148 | $6,320 | $3,767 | $2,114 | $6,838 | $11,974 | $18,949 | $28,620 | |
| Cash Balance | $19,551 | $13,656 | $10,345 | $9,620 | $11,768 | $18,088 | $21,855 | $23,969 | $30,807 | $42,781 | $61,730 | $90,350 | |
| Pro Forma Balance Sheet | |||||||||||||
| Month 1 | Month 2 | Month 3 | Month 4 | Month 5 | Month 6 | Month 7 | Month 8 | Month 9 | Month 10 | Month 11 | Month 12 | ||
| Assets | Starting Balances | ||||||||||||
| Current Assets | |||||||||||||
| Cash | $44,250 | $19,551 | $13,656 | $10,345 | $9,620 | $11,768 | $18,088 | $21,855 | $23,969 | $30,807 | $42,781 | $61,730 | $90,350 |
| Accounts Receivable | $0 | $1,675 | $2,959 | $3,847 | $5,001 | $6,501 | $8,452 | $10,987 | $14,283 | $18,569 | $24,139 | $31,381 | $40,795 |
| Inventory | $40,000 | $37,660 | $34,618 | $30,663 | $25,522 | $18,839 | $17,376 | $22,588 | $29,365 | $38,175 | $49,627 | $64,515 | $83,869 |
| Other Current Assets | $20,000 | $20,500 | $21,000 | $21,500 | $22,000 | $22,500 | $23,000 | $23,500 | $24,000 | $24,500 | $25,000 | $25,500 | $26,000 |
| Total Current Assets | $104,250 | $79,386 | $72,233 | $66,355 | $62,144 | $59,609 | $66,915 | $78,930 | $91,617 | $112,050 | $141,548 | $183,126 | $241,014 |
| Long-term Assets | |||||||||||||
| Long-term Assets | $40,000 | $40,000 | $40,000 | $40,000 | $40,000 | $40,000 | $40,000 | $40,500 | $41,000 | $41,500 | $42,000 | $42,500 | $43,000 |
| Accumulated Depreciation | $0 | $1,500 | $3,000 | $4,500 | $6,000 | $7,500 | $9,000 | $10,500 | $12,000 | $13,500 | $15,000 | $16,500 | $18,000 |
| Total Long-term Assets | $40,000 | $38,500 | $37,000 | $35,500 | $34,000 | $32,500 | $31,000 | $30,000 | $29,000 | $28,000 | $27,000 | $26,000 | $25,000 |
| Total Assets | $144,250 | $117,886 | $109,233 | $101,855 | $96,144 | $92,109 | $97,915 | $108,930 | $120,617 | $140,050 | $168,548 | $209,126 | $266,014 |
| Liabilities and Capital | Month 1 | Month 2 | Month 3 | Month 4 | Month 5 | Month 6 | Month 7 | Month 8 | Month 9 | Month 10 | Month 11 | Month 12 | |
| Current Liabilities | |||||||||||||
| Accounts Payable | $20,000 | $3,584 | $3,991 | $4,512 | $5,180 | $6,020 | $14,093 | $24,460 | $31,064 | $39,653 | $50,831 | $65,057 | $83,646 |
| Current Borrowing | $10,000 | $10,000 | $10,000 | $10,000 | $10,000 | $9,500 | $9,000 | $8,000 | $7,000 | $6,000 | $4,000 | $2,000 | $0 |
| Other Current Liabilities | $0 | $0 | $0 | $0 | $0 | $0 | $0 | $0 | $0 | $0 | $0 | $0 | $0 |
| Subtotal Current Liabilities | $30,000 | $13,584 | $13,991 | $14,512 | $15,180 | $15,520 | $23,093 | $32,460 | $38,064 | $45,653 | $54,831 | $67,057 | $83,646 |
| Long-term Liabilities | $70,000 | $68,900 | $67,800 | $66,700 | $65,600 | $64,500 | $63,400 | $62,300 | $61,200 | $60,100 | $59,000 | $57,900 | $56,800 |
| Total Liabilities | $100,000 | $82,484 | $81,791 | $81,212 | $80,780 | $80,020 | $86,493 | $94,760 | $99,264 | $105,753 | $113,831 | $124,957 | $140,446 |
| Paid-in Capital | $77,000 | $77,000 | $77,000 | $77,000 | $77,000 | $77,000 | $77,000 | $77,000 | $77,000 | $77,000 | $77,000 | $77,000 | $77,000 |
| Retained Earnings | ($32,750) | ($32,750) | ($32,750) | ($32,750) | ($32,750) | ($32,750) | ($32,750) | ($32,750) | ($32,750) | ($32,750) | ($32,750) | ($32,750) | ($32,750) |
| Earnings | $0 | ($8,847) | ($16,808) | ($23,607) | ($28,886) | ($32,161) | ($32,828) | ($30,080) | ($22,897) | ($9,953) | $10,466 | $39,919 | $81,318 |
| Total Capital | $44,250 | $35,403 | $27,442 | $20,643 | $15,364 | $12,089 | $11,422 | $14,170 | $21,353 | $34,297 | $54,716 | $84,169 | $125,568 |
| Total Liabilities and Capital | $144,250 | $117,886 | $109,233 | $101,855 | $96,144 | $92,109 | $97,915 | $108,930 | $120,617 | $140,050 | $168,548 | $209,126 | $266,014 |
| Net Worth | $44,250 | $35,403 | $27,442 | $20,643 | $15,364 | $12,089 | $11,422 | $14,170 | $21,353 | $34,297 | $54,716 | $84,169 | $125,568 |

