
Bra~vo Intimates
Executive Summary
Introduction
This plan outlines the financial and promotional plans of Bra~vo Intimates, to be located in downtown Royal Oak, Michigan. This exciting endeavor will bring a needed women’s intimate apparel store to the metro area, expanding the second year to include mastectomy products. There is no major mastectomy store in the metro area to service this special customer. We envision Bra~vo Intimates will be able to achieve the greatest portion of market share in the region through active support of women’s and community organizations, connecting events to in-store promotions. Our ultimate goal is to be the premier intimate apparel and swimwear store in Michigan, fitting every customer in a fashionable bra or swimsuit, giving her incredible support and shape, therefore enhancing her entire silhouette!
A portion of all profits will be placed in an account to fund purchase our own building, tentatively scheduled for year four.
The Company
Bra~vo has a very strong, experienced and professional management team, with over 35 years of combined experience. With each member working in their area of specialization we have every aspect of the business covered.
Rebecca Autumn will be: Owner/Operator with 55% ownership and will be responsible for buying, customer sales and fittings.
Lucille Winters will be: Co-owner with 26% ownership and will act as merchandising consultant, employee training and part-time sales.
Deborah Summers will be: Co-owner with 19% ownership and will act as Operation Manager responsible for payable and receivables, inventory control, in store promotions, billing and sales.
The store will be located in the downtown shopping district of Royal Oak, Michigan. Situated on South Washington street, the main upscale avenue in town. The space is 2,000 (10 x 200) square feet.
The Products
Our shop will sell only those brands that we have found that meet our fit and quality requirements. We will be introducing new brands to our customers.
Bra~vo will carry quality European and American products, such as Rigby & Peller, Prima Donna, Wacoal, OnGossomer, Lise Charmel, and Feline and Ratratti, purchased through reputable U.S. distributors in a variety of sizes, colors and styles. Our expertise and concentration is in bra fitting full-busted and full-figured women. The initial percentage of our merchandise will be in bras/intimate apparel followed by swimwear, nightwear/At Home-wear and hosiery.
As Bra~vo achieves its sales and profitability goals, upon our first year anniversary, we will expand in the following categories; bra/intimate apparel, swimwear and accessories, nightwear and at home-wear, and hosiery.
The Market
During the last three years the total women’s intimate apparel, or innerwear, market grew by 10%, to $11.8 billion. All product categories saw robust growth during this period, with the highest growth occurring in Bras (17%) and Bottoms (12%). Consumer awareness of proper bra fitting has been on the increase for the last eight years. Many independent stores across the country have been experiencing double digit sales increases for the last five years. This has been due to two factors,the clothing industry has featured more skin exposing fashions that require speciality foundation garments, and fashion column writers have been stressing the importance of bra fitting along with mentioning the speciality stores in the area and their services.
Non-Chain Speciality stores such as Bra~vo Intimates captured $304 million of the total $10,702 million market in and $341 million of $11,797 million of the intimate apparel market over the previous two years. Direct mail merchants gained the largest portion of market share in the past two years, at $914 million last year. Most of the increase was due to Internet sales.
We have estimated the number of prospective customers in the Royal Oak area as 94,201, and, knowing the missed opportunities of our competitors, this strongly indicates that there is a large void in the market. Therefore we see an underserved market niche opportunity for an intimate apparel store that can serve all the needs of the Tri-county woman.
Financial Projections
Bra~vo Intimates’ financial goals are the following:
- to achieve a net profit margin of over 7% the second year of operation and 15% the third.
- To achieve a net profit of $41,000 the second year and over $100,000 the third year
In order to achieve such figures, we have start-up requirements of approximately $196,000, including $80,000 in initial inventory.
We will seek a five year loan, working with National City Bank in Royal Oak, to make the first year’s payments as flexible as possible.

1.1 Objectives
- To create a point of destination shop for premier lingerie, swimwear and personalized fitting service.
- To achieve the greatest portion of market share in the region for speciality foundation garments.
- To be active in supporting women’s and community organizations, connecting events to in-store promotions.
- To achieve a net profit margin of over 7% the second year of operation and 15% the third.
- To achieve a net profit of $41,000 the second year and over $100,000 the third year.
1.2 Mission
To be the premier intimate apparel and swimwear store in Michigan, fitting every customer in a fashionable bra or swimsuit, giving her incredible support and shape, therefore enhancing her entire silhouette!
1.3 Keys to Success
To succeed in the intimate apparel business we know we must:
- Carry an assortment of foundations in various sizes, styles and colors, in quality brands.
- Carry fashion and basic brands that are a point of difference from our competitors.
- Educate and advise our customers on being fitted, and to have a wardrobe of foundations for a variety of fashion needs.
- Continuously review our sales and adjust inventory levels accordingly.
- Provide customers with excellent customer service in a positive body image atmosphere.
- Advertise in areas that our potential customers will learn about us and the services we offer.
- Keep informed of trends, technology and new brands.
- Have a variety of price points, knowing that women come in all shapes, sizes and economic levels, with the average price point in a middle range.
Company Summary
Our corporation is organized as a Limited Liability Corporation, and will be doing business as Bra~vo, located in the downtown shopping district of Royal Oak. Rapid growth, retail development and easy access from all freeways made this the prime location. The merchandise will be purchased according to our area of focus/expertise with the remaining stock in sizes that fall on the fringe. The product lines have been selected on the following criteria: reputation, quality and extensive size range offered.
2.1 Company Ownership
A family owned and operated business, each member working in their area of expertise, having over 20 years of experience their field.
Corporate ownership is as follows:
| Rebecca Autumn | 55% | Owner, Store Manager, Key Salesperson and Buyer |
| Lucille Winters | 26% | Co-owner, Merchandising Consultant |
| Deborah Summers | 19% | Co-owner, Operations Manager |
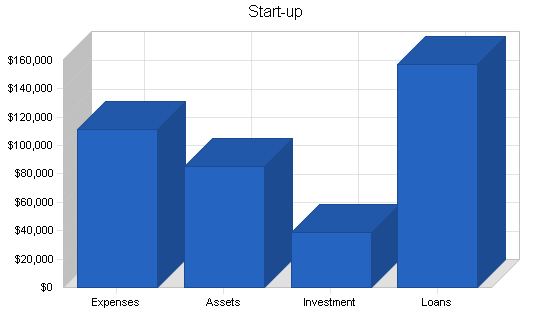
2.2 Start-up Summary
Start-up costs will be financed as follows:
- Owners’ investment $39,000
- Five-year bank loan $157,190
- Short-term revolving line of credit $35,000, for inventory replenishment and new purchases, during months of high receipts.
| Start-up | |
| Requirements | |
| Start-up Expenses | |
| Rent & Security Deposit-3 Months | $10,000 |
| Grand Opening Event | $3,000 |
| POS Supplies | $1,000 |
| Travel-Market Buying Trips | $2,250 |
| Business & Inventory Insurance | $2,100 |
| Permits | $250 |
| Advertising & Promotion | $8,840 |
| Build-out | $15,880 |
| Bank Card Machine & Supplies | $355 |
| Store Fixtures | $17,000 |
| Alterations Equipment | $385 |
| Software Retail Pro | $10,500 |
| Logo and Stationery, Business Cards | $2,000 |
| Window Lettering and Store Sign | $1,450 |
| Organizational Dues & Subscriptions | $260 |
| CPA-Christine Hamill | $400 |
| Payroll-3 Months | $23,595 |
| Real Estate Attorney | $3,000 |
| Company Car Payments-2 Months | $1,040 |
| Business Supplies | $750 |
| Utilites & Telephone-3 Months | $2,100 |
| Credit Card Processing Fees-3 Months | $1,690 |
| Building Taxes & Insurance-3 Months | $1,575 |
| Other | $1,770 |
| Total Start-up Expenses | $111,190 |
| Start-up Assets | |
| Cash Required | $5,000 |
| Start-up Inventory | $80,000 |
| Other Current Assets | $0 |
| Long-term Assets | $0 |
| Total Assets | $85,000 |
| Total Requirements | $196,190 |

| Start-up Funding | |
| Start-up Expenses to Fund | $111,190 |
| Start-up Assets to Fund | $85,000 |
| Total Funding Required | $196,190 |
| Assets | |
| Non-cash Assets from Start-up | $80,000 |
| Cash Requirements from Start-up | $5,000 |
| Additional Cash Raised | $0 |
| Cash Balance on Starting Date | $5,000 |
| Total Assets | $85,000 |
| Liabilities and Capital | |
| Liabilities | |
| Current Borrowing | $0 |
| Long-term Liabilities | $157,190 |
| Accounts Payable (Outstanding Bills) | $0 |
| Other Current Liabilities (interest-free) | $0 |
| Total Liabilities | $157,190 |
| Capital | |
| Planned Investment | |
| Investment Cash-Rebecca Autumn | $22,000 |
| Investment Cash-Lucille Winters | $10,000 |
| Investment Cash-Deborah Summers | $7,000 |
| Other | $0 |
| Additional Investment Requirement | $0 |
| Total Planned Investment | $39,000 |
| Loss at Start-up (Start-up Expenses) | ($111,190) |
| Total Capital | ($72,190) |
| Total Capital and Liabilities | $85,000 |
| Total Funding | $196,190 |
2.3 Company Locations and Facilities
The store will be located in the downtown shopping district of Royal Oak, Michigan. Situated on South Washington street, the main upscale avenue in town. The space is 2,000 (10 x 200) square feet. All business, deliveries and shipments will be handled through the store, with the exception of in-home appointments and outside promotional events.
Royal Oak is located in the Southeastern section of Oakland county, bordering on Wayne and Macomb counties, (see 4.1 Target Marketing Analysis for county details) one mile off the 6-96 and I-75 intersection, and four blocks east of Woodward Avenue. In addition we are only five miles from the Lodge (10) Freeway and the Southfield Expressway.
Products
Bra~vo will carry quality European and American products, such as Rigby & Peller, Prima Donna, Wacoal, OnGossomer, Lise Charmel, and Feline and Ratratti, purchased through reputable U.S. distributors in a variety of sizes, colors and styles. Our expertise and concentration is in bra fitting full-busted and full-figured women. The greatest percentage of our merchandise will be in bras/intimate apparel followed by swimwear, nightwear/At Home-wear and hosiery. Rebecca will do the initial buying, with reorders performed according to sell thru and open to buy programs utilizing the Retail Pro software.
3.1 Product Description
Bra/intimate apparel (coordinate bottoms)
- Bras are the main focus, comprising 45% of our merchandise.
- We will stock AA-JJ cups, 30-48 band sizes, special ordering other sizes.
- Knowing that the most popular sizes for speciality fitting shops are 34D, 36D, 34DD, 36DD respectively, we will have the largest variety of colors, styles and price points in these sizes.
- Prices will range from $35 to $125, with the average being between $45-$65.
- The customer that purchases from this category may do so for one or a combination of the following reasons: difficult to fit, large cup and/or band size, seeking current fashion not seen in other shops or seeking a better fitting service and comfortable shopping atmosphere not found in the competition.
- For the next three years we expect an average growth of 22.5% from this category, primarily from developing our business and taking a larger share of the market with the addition of mastectomy products in the second year.
Shapewear
- Shapewear will be 12% of the inventory.
- Sizes ranging from Small to 5XL, with a price range from $25 to $85, with the concentration in the Large to 5XL, and price at $45-$65.
We expect to see a great deal of growth, with the increase of our African American customer base, the following year planned at a 40.6% increase.
Swimwear and swim accessories
- Swimwear will comprise 20% of the merchandise.
- Sizes will range from a 6 to an 18, with bra-sized swimwear from a C to G cup.
- Prices will range from $85-$180.
- The customer that purchases from this category may do so for one or a combination of the following reasons: the full-busted/figured customer who has a difficult time finding a selection of fashionable swimsuits, requires a salesperson who knows the fit of each brand, to shop in a comfortable intimate shop, purchased other items at the store.
- We expect to see an average of 38% growth of this category, through high word-of-mouth and loyal customer referrals, as well as our expansion of assortment in the second year.
Nightwear/At Home-wear
- Nightwear/At Home-wear will comprise 24% of our store’s merchandise.
- Carrying a size range to appeal to all sizes, carrying sizes Small to 4X.
- Price points range from $60 to $250. A wide price range is due to the seasonal aspect of nightwear and a higher price point for bridal and holiday merchandise.
- The At Home-wear merchandise is less seasonal and more of a middle to low price point.
- The customer that purchases from this category may do so for any one or combination of the following reasons: needs a bridal shower gift, wants a more fashionable assortment than she is currently finding, a local and/or walk thru holiday gift shopper, and the impulse buyer.
- We expect approximately a 16% increase in this category mainly due to word-of-mouth recommendations and updated merchandise, following trends.
Hosiery
- Will make up less than 2% of the store’s inventory.
- The assortment here is lace top stockings and basic panty hose.
- The size range offered will be Small to 3XL.
- Prices will range from $10-$35.
- The customer that purchases from this category may do so for any one or combination of the following reasons: a bride who wants an enhanced lace top stocking for her special day, the local customer who needs a pair of panty hose, walk thru customers.
- We plan a 21% increase in this category for the first year based on: continuously developing a unique assortment, building a reputation as “the store in the metro area” for the greatest assortment of European lace top stockings. This will also build the bridal customer base. She will shop with us for undergarments, nightwear as well as hosiery.
Other
- This category will comprise 1% of our inventory and include accessories, such as lingerie wash, swim wash, and comfy straps (bra accessories).
- The assortment here is small and includes those items that have a successful performance.
- The price range will be $5 to $15.
- The customer that will purchases from this category may do so for any one or combination of the following reasons: is recommended the product by salesperson when being fitted, has been using the product, or is a walk thru shopper that makes an small (impulse) purchase-reacting to the store.
- This category is planned at an increase of $13,550 the second year due to the add on items needed for the mastectomy product line.
Note: Category percentages were determined using industry standards.
3.2 Competitive Edge
Bra~vo has major advantages over its competition.
- The owner is working in the industry as a sales representative, selling to stores in the region, watching how each manages their business, knowing their missed opportunities. Below details our point of difference.
- The business will use the Retail Pro software system, which performs inventory control, point of sale, sales reports & analysis, employee & customer record maintenance.
- We will have a detailed record on each customer, logging her purchases, size, brand preference, etc., for customer follow-up and promotional purposes.
- We will launch our business with an aggressive advertising and promotional program reaching the Tri-county area.
- We will perform minor alterations for a nominal fee.
- Our location is central to our target market.
- The owner, currently a sales rep is acquainted with other manufacturers, this will put us in a position to negotiate additional perks in conjunction with purchases such as, co-op advertising, in-store vendor support, markdown money on poor performers, additional terms/dating on swimwear orders, and priority access to close-outs.
- The owner has worked most of the industry markets, domestically and internationally and knows which are key shows to buying.
- The owner is currently working with over 150 store owners across the country and has developed a working rapport with owners, which she can draw on for advice and idea sharing.
- The owner has excellent computer skills, a strong background in inventory management and customer service
3.3 Sourcing
We will shop for our merchandise as outlined below.
- For suppliers who have a local representative, we will place our weekly/monthly reorders thru and review any products not previously reviewed, and utilize product catalogs for New York based lines.
- The International Lingerie Show (January in Paris): the largest industry show, is the opportunity to see the most extensive variety of European and domestic product lines and place major Fall orders.
- The Intimate Apparel Salon (March in New York): the largest U.S. industry show. To review lines presented in Paris and place Fall orders on lines not previously viewed.
- March Market Week (March in Dallas): to visit vendors and place Fall orders from vendors not available in New York.
- The Intimate Apparel Salon (August in New York): place Spring orders.
- The International Intimate Apparel & Swimwear Show (September in Lyon, France): the largest show featuring the newest collections of European swimwear and Spring intimate apparel. Place annual swimwear and major intimate apparel orders.
3.4 Technology
In this type of retail establishment, one with a high number of SKUs, it is imperative that an advanced inventory and point of sales program be utilized to maintain stock levels and track sales. We will utilize the Retail Pro software system, which is currently the best available in managing the number of SKUs we will carry. This company is known for keeping their products current, adding new features when applicable. Retail Pro is a well known program throughout the industry.
3.5 Future Products
As Bra~vo achieves its sales and profitability goals, upon our first year anniversary, we will expand in the following categories.
Bra/Intimate Apparel:
- We will launch a mastectomy department, currently there is only one shop in the metro area, offering a conservative selection of U.S. products.
- The Tri-county area is home to 41% of the state’s population, this fact demonstrates the strong need for a shop that will carry and be certified in fitting products of this nature. This has been a major concern and need for this market for some time.
- We will offer an extensive mastectomy assortment of U.S. and European products.
- There are an increasing number of mastectomy customers yearly. We know that creating an outreach program in partnership with the hospitals will make this a success.
- We will become certified fitters in the mastectomy products.
- During first year market trips we will explore European mastectomy suppliers, and educate our staff on this customer’s needs. Deborah Summers, with 20 years experience, will set up and manage the insurance billing department.
Swimwear and accessories:
- Add mastectomy swimwear.
- Add three to four new brands that have been repeatedly requested by customers.
- Swimwear is a higher risk category, due to weather and fashion trend predictions. As swimwear buying takes place six to eight months prior to the selling season we will be conservative our first and second years.
Nightwear and At Home-wear:
This category will require continuous fine tuning more than product additions, keeping the assortment small and concentrated, reordering successful styles/brands/colors. Keeping higher stock levels in those items/sizes that have proven to be successful will be a key focus.
Hosiery:
This category will expand, based on customer feedback and stock turn, increasing inventory levels in steady performers.
Other:
This category will be expanded due to the accessories needed for the mastectomy product line in bras and swimwear.
Market Analysis Summary
Consumer awareness of proper bra fitting has been on the increase for the last eight years. Many independent stores across the country have been experiencing double digit sales increases for the last five years. This has been due to two factors,the clothing industry has featured more skin exposing fashions that require speciality foundation garments, and fashion column writers, who for the most part, yearly feature the importance of bra fitting, mentioning the speciality stores in the area and their services. (The Detroit News, February, 2001)
Results from The Detroit News February column, regarding bra fitting, proved to be a motivator for the metro Detroit customer to seek out a local store to get fitted. Stores in the area reported a 20% increase in sales the two weeks following the article.
The full-busted/full-figured customer, when happily served, historically has developed into a loyal customer, telling those that share the same body traits, about her experience and will tend to make a shopping trip with her friend for her next store visit.
4.1 Market Segmentation
Our concentration and expertise is in fitting the full-busted and full-figured woman who seeks a better fit in intimate apparel. The table and chart below summarize the population analysis of the Tri-county (Oakland, Wayne, and Macomb counties) area.
4.1.1 Market Needs
We have estimated the number of prospective customers as 94,201, and, knowing the missed opportunities of our competitors, this strongly indicates that there is a large void in the market. Therefore we see an underserved market niche opportunity for an intimate apparel store that can serve all the needs of the Tri-county woman.
Her needs are listed below:
- For the full-busted/figured customer, finding a garment that fits, supports and is fashionable.
- An expert fitter who has a working knowledge of the fit that each brand offers.
- A fitter that has the ability to develop a rapport with the customer, offering advise about the importance of proper fit and when she should be refitted.
- She wants a professional fitter who has a sensitive and personable way about her and is eager to work with her until she is satisfied.
- A store that tracks her purchases, preferences and size information and will contact her when an item arrives that may interest her.
- A store that will carry a variety of fashion brands, some not currently available in this market, one that will stay current with trends.
- A store that will do minor alterations, to ensure the fit.
- A store that maintains stock in basic items and will place special orders for speciality items.
- A store that has a friendly atmosphere and decor that gives the customer a pleasant shopping experience.
4.1.2 Market Trends
Market growth/trends:
Market trends are favorable for the continued growth and development of the Detroit metro area. Growing an average of 10.25% each year, this trend shows there is a definite need for an intimate apparel store. Current plans for the metro Detroit area include: development of the river walk, expansion of convention facilities, casino development and a future sports stadium. Planned development for Royal Oak includes: hotel/condos, upscale retail shops, a well known chain book store and the beautification of the business district.
Retail news/trends:
According to a recent report by The Michigan Retailers Association, many Michigan retailers are projecting that sales will rise over the next three months, but most don’t expect the current economic slump to be over soon.
Sixty-one percent of retailers expect their second quarter sales to top last year’s figures, according to the monthly Michigan Retail Index Survey, a joint project of the Michigan Retailers Association and the Federal Reserve Bank of Chicago. That’s the highest level of optimism since last September for sales during the next three-month period. The Index found that 35% of Michigan retailers increased year to year sales during March, down slightly from 36% in February. Fifty percent recorded sales decreases and another 15% reported no change. The last time the Index found a majority of the state’s retailers posting year to year sales gains was June of last year.
4.1.3 Main Competitors
Competitor #1
Approximately 10 miles from Royal Oak. Competitor #1 has been in business for 45 years and located in Birmingham for the last 20. Due to her age, approximately 83 years old, she has not kept current with new brands and technology. She has a reputation of being difficult to deal with, as a customer or an employee. Her approximate yearly sales volume at one time was up to approximately 1,200,000 units with a decline in store traffic and high turnover in staff the volume is now closer to 875,000. All inventory and product ordering is done manually. This store has a following from these groups: the upscale Birmingham customer, the local tourist and the local full-figured customer. With the last segment declining more than the other two. The store is merchandised by size with most product behind the counter and only sleepwear available for the customer to browse through. Since this owner has not attended an industry market show in the last 10 years, she has very few of the new European brands now distributed in the U.S. Most of the store’s advertising is placed in immediate local papers and does no in-store promotions or yearly sale. Her current staff has been with her less than seven months, which is unexperienced compared to competitors. With her age she takes one to two weeks per quarter off and does not have a manager that is able to make decisions while she is absent.
Competitor #2
Competitor #2 is 33 miles from Royal Oak, and has been passed down from mother to daughter. Competitor #2 purchased the store six years ago, and has excellent buying skills. Most of her staff has been with her on the average of 2 years. This store’s approximate yearly sales volume is 1,100,000 units and until last year has been on a steady increase. Competitor #2 gave birth to her third child in December 1999 and has not returned to work except on a limited basis. All inventory and product ordering is done manually. The majority of her customers are middle income, conservative suburban women with the average age being 50. The merchandise is displayed by brand and the store is in need of redecoration and updating of fixtures. The merchandise is moderate with some brands also carried at Kohl’s and Hudson’s. The buyer has not attended a Midwest industry market in the last five years and has never attended a major market, therefore not learning about new brands, products or technology. Advertising is placed in local Plymouth papers with no in-store promotional activity. This store is situated in a small one-story mall on a side street of the downtown shopping area, with no signage or windows on the street front. Therefore, capturing any walk-in traffic is difficult.
Competitor #3
Competitor #3 is 57 miles from Royal Oak and has been open two years. Competitor #3 has developed her assortment well for her local clientele, with the majority of her customers coming from Downriver (a price point sensitive customer), Grosse Isle, and some from Detroit. XXX has been in the lingerie industry for seven years. This store was in the black at the beginning of the second year. I estimate her sales as being approximately $300,000. She carries mostly a moderate product line and is merchandised according to brand. She carries more stock than she needs, and like her competitors, she performs all inventory checks and reorders manually. She does attend major industry markets, however is very hesitant to try new styles or brands. Her customer is a conservative, suburban middle income woman between the ages of 35 to 55. She does little advertising and no in-store promotion. She has one part-time employee that has been with her since she opened and is in the process of hiring another.

| Market Analysis | |||||||
| Year 1 | Year 2 | Year 3 | Year 4 | Year 5 | |||
| Potential Customers | Growth | CAGR | |||||
| Royal Oak Consumer | 15% | 9,672 | 11,123 | 12,791 | 14,710 | 16,917 | 15.00% |
| Oakland County | 12% | 28,738 | 32,187 | 36,049 | 40,375 | 45,220 | 12.00% |
| Macomb County | 9% | 10,444 | 11,384 | 12,409 | 13,526 | 14,743 | 9.00% |
| Wayne County | 5% | 46,342 | 48,659 | 51,092 | 53,647 | 56,329 | 5.00% |
| Out of Town | 75% | 25 | 44 | 77 | 135 | 236 | 75.28% |
| Total | 8.80% | 95,221 | 103,397 | 112,418 | 122,393 | 133,445 | 8.80% |
4.2 Industry Analysis
Information on the industry was supplied by the Intimate Apparel Advertising Manager at Women’s Wear Daily. WWD conducts the largest portion of fashion industry (retail and wholesale) statistics and investigative reports. The paper has recently reported that the innerwear or intimate apparel industry from 1997 to 1999 grew by 10% or $11.8 billion. The topics in this section will go into further detail using the recent WWD report on the industry.
4.2.1 Industry Participants
Information below is from Women’s Wear Daily’s U.S. Market Innerwear Strategic Market Report 2000 (based on 1999 reported numbers).
“Women tend to purchase intimate apparel (meaning foundations), from specialists.”
Non-Chain Speciality stores in 1997 captured $304 million of the total $10,702 million market and in 1999, $341 million of $11,797 million intimate apparel market. Direct mail merchants gained the largest portion of market share in the past two years, at $914 million in 1999. Most of the increase was due to Internet sales.
Below features the latest market share percentages.
Distribution Channel % of market
| Discounters | 28% |
| Speciality Chains | 21% |
| Department Stores | 16% |
| National Chains | 14% |
| Direct Mail | 8% |
| Other Speciality Stores | 3% |
| Off-Pricers | 3% |
| Factory Outlets | 3% |
| Other | 3% |
Innerwear Channel Sales Statistics 1997 and 1999
| Distribution Channel | 1997 $MM | 1997 Avg. Price $ | 1999 $MM | 1999 Avg. Price $ |
| Department Stores | 1,811 | 11.36 | 1,903 | 11.65 |
| Speciality Chains | 1,688 | 11.56 | 1,919 | 11.38 |
| Non-Chain Speciality | 304 | 12.37 | 341 | 11.50 |
| Discount Stores | 2,914 | 3.77 | 3,384 | 3.80 |
| National Chains | 2,096 | 8.21 | 2,060 | 8.47 |
| Direct Mail | 634 | 11.58 | 914 | 10.87 |
| Off-Pricers | 411 | 6.31 | 377 | 6.84 |
| Factory Outlets | 584 | 6.54 | 567 | 6.10 |
| Total Innerwear | 10.702 | 6.82 | 11,797 | 6.84 |
4.2.2 Distribution Patterns
According to the WWD, U.S. Market Innerwear 2000 strategic market report.
From 1997 to 1999 the total women’s intimate apparel, or innerwear, market grew by 10%, to $11.8 billion. All product categories saw robust growth during this period, with the highest growth occurring in Bras (17%) and Bottoms (12%).
Bras/Intimate Apparel represent the largest percent of total women’s intimate apparel sales for 1999 at 39%, followed by sleepwear at 24%.
We will continue to see growth in this category with an increase in the number of consumers as well as the proliferation of novelty fabrics and fashions. Growth will slow to about 10% from 2000 to 2002, still respectable, but less than it has been.
Bottoms also had substantial growth increasing 12% from 1997 to 1999. There will be a strong surge in growth of comfort control briefs in newer fabrics. Baby boomers who need some smoothing in the bottom will wear these lightweight alternatives to shapers.
Loungewear/At Home-wear continues to build momentum. Robes, a mainstay of older consumers’ lifestyles will see sales increase by over 10% over the next two years. As At Home-wear and home inspired themes continue to be key consumer interests, this category will continue to grow. Draw string pants and bottoms in general will also continue to grow.
Sleepwear, the second largest product category in innerwear, continues to gain momentum increasing 7% from 1997 to 1999. At nearly a quarter of the total innerwear volume, sleepwear will continue to be a key category. Sleepwear will increase by 20% from 2000 to 20002 driven mostly by young styles and brands.
Shapewear continues to build momentum and volume increasing 10% from 1997 to 1999. Shapewear will continue to increase in conjunction with consumers’ waistlines and rates of obesity. Shapewear will grow by 20% from 2000 to 2002, with one-piece shapers and minimizers the big beneficiaries of this increase.
According to a study reported in USA Today “Growth in bra sales has outpaced most other categories of women’s apparel the past five years.”
Annual increase:
| 1994 |
10.6% |
| 1995 |
9.3% |
| 1996 |
8.2% |
| 1997 | 7.8% |
| 1998 | 8.6% |
| Vs. Growth for all Women’s Apparel | 3.7% |
Source: The NPD Group
The volume of the bra business has continued to have a steady increase each year. This is due to two main factors: 1) the aging of the baby boomers, 2) intimate apparel is one of the only fashion businesses that does not experience the “seasonal” markdown period. Bras can stay at full price all year long, giving a better profit margin than other fashion products such as ready-to-wear.
4.2.3 Competition and Buying Patterns
Future trends for industry participants are reported as follows, again from WWD‘s, U.S. Market Innerwear 2000 Strategic Market Report.
Key strategic issues facing retailers in the different channels, and opportunities.
- Department Stores- Department stores need to figure out how they are going to generate traffic without resorting to price promotions. We think that department stores are going to continue to lose share to other formats because they are just too difficult to shop,and provide no service or information for innerwear.
- Speciality Chains- The main portion of this channel is Victoria’s Secret. This channel has lost some ground over the last two years. Those like The Gap and Ann Taylor can gain share due to product development and transactions from existing traffic.
- Discounters- Their biggest fear is inflation, worrying what it will do to the real disposable income of mainstream America.
- National Chains- Generating store traffic will be a top priority for National Chains. This channel is caught in the middle, neither fish nor fowl, in that they have some great national and private label brands.
- Direct Mail- These merchants love being hot again. However, being in apparel they are still finding it difficult, as the costs of doing business continue to rise.
This report does not offer information regarding non-chain speciality stores and this channel has been left out of this paper in the last five years. It is unfortunate since this is the channel that is known for excellent fitting services, as well as high customer and employee retention. Those women who need an expert fitting service are still visiting a local fitting shop. If WWD did a little more investigative reporting on this channel it may show more insight as to why the department stores and chain speciality stores are losing market share.
Strategy and Implementation Summary
Bra~vo’s strategy to gain the largest portion of market share.
- Policies geared toward total customer service and retention.
- Create a warm and natural shopping environment for women of all shapes and sizes to feel comfortable, serving refreshments, making her feel welcome.
- Employees that are well trained, compensated and appreciated, taking part in fashion merchandising and window decor. We will hold monthly meetings recognizing their contributions and creativity in an applauded way.
5.1 Milestones
The milestones table below outlines our plan with specific dates along with who will enact that step and an assigned budget.
| Milestones | |||||
| Milestone | Start Date | End Date | Budget | Manager | Department |
| Complete Business Plan | 5/31/2001 | 5/31/2001 | $0 | RA | Marketing |
| Confirm Logo | 6/15/2001 | 6/15/2001 | ($1,000) | RA | Marketing |
| Enter PaloAlto business plan contest | 5/31/2001 | 5/31/2001 | $0 | RA | Marketing |
| Apply for Bank Loan | 5/31/2001 | 5/31/2001 | $157,190 | RA | Marketing |
| Secure Store Location/Lease | 6/10/2001 | 6/10/2001 | ($12,500) | RA/LW | Marketing |
| Apply for Business License & Building Permits | 6/1/2001 | 6/1/2001 | ($35) | RA | Marketing |
| Hire Builder Confirm Build out plan | 6/5/2001 | 6/5/2001 | ($18,000) | RA/LW/DS | Marketing |
| Place Inventory Orders | 7/15/2001 | 7/15/2001 | ($95,000) | RA | Marketing |
| Order Store Fixtures | 6/15/2001 | 6/15/2001 | ($18,000) | RA/LW | Marketing |
| Order Alteration Equipment | 7/15/2001 | 7/15/2001 | ($385) | LW | Marketing |
| Purchase RetailPro Program & Hardware | 7/1/2001 | 7/1/2001 | ($10,500) | RA | Marketing |
| Place Opening Advertising | 7/1/2001 | 7/1/2001 | ($8,500) | RA | Marketing |
| Order POS Supplies | 7/5/2001 | 7/5/2001 | ($995) | RA | Web |
| Order Business/Bankcard Supplies & Machine | 7/5/2001 | 7/5/2001 | ($1,105) | DS | Operations |
| Confirm Start of Insurance Plans | 7/15/2001 | 7/15/2001 | ($2,100) | DS | Operations |
| Contact Utility Companies | 7/15/2001 | 7/15/2001 | ($2,250) | DS | Operations |
| Hire Staff | 9/15/2001 | 9/15/2001 | ($1,460) | RA/LW | Department |
| Opening Event | 9/4/2001 | 9/4/2001 | ($3,000) | RA/DS | Department |
| Store Opening | 9/5/2001 | 9/5/2001 | $0 | ABC | Department |
| Other | 1/1/2003 | 1/15/2003 | $0 | ABC | Department |
| Totals | ($17,640) | ||||
5.2 Sales Strategy
- Our goal is to sell a minimum of two units per transaction, an average item being $72, we aim for a total sale of $144.
- Every customer purchase will include care instructions. While being fitted the salesperson will explain product care and each sales receipt will include care instructions and return policy.
- Utilizing the Retail Pro system will enable us to record a customer’s contact information and purchases, enabling us to create a contact list for promotions, special events and the arrival of new products.
- We believe it is important to remain an active member of the local business community supporting our downtown area, taking part in local promotions as well as being an active member in organizations that impact our customers lives (Breast cancer awareness, Gilda’s Club and Dress for Success).
- Our knowledgeable sales staff will offer the highest level of customer service. This type of service during an intimate fitting experience develops a strong bond between the customer and her fitter, which in turn develops a devoted customer.
5.3 Sales Forecast
In this section we outline the first three months of our sales plan in detail, giving pertinent information that will affect sales performance. After which we show the peak selling times for each category. The following table will show our sales plan for the next three years, with the first year in a monthly category plan. We plan an aggressive second year for the intimate apparel category due to the launch of the mastectomy department.
September $19,350, approximately 269 units
This is our opening month and therefore we have estimated sales on the conservative side. If we open according to plan, September 6, 2001, we will have 25 selling days with an average daily goal of $774. We will have a grand opening party the night before opening for business, inviting the press, local retailers, city officials, family and friends. We will serve wine & cheese while professional models feature key items and the staff explains our expertise and answers any questions. We will send out press kits to all the major media and organizations.
- Intimate apparel/bras at $8,500 (44%, and approx. 131 units), we believe that most sales will be in the fashion sets, merchandised on the wall in the front of the store.
- Shapewear is a strong category the industry over, with shaping panties being the leader, we plan $3,000 (16% approx. 32 units) for this category.
- The Sleepwear/At Home-wear category is more of an impulse purchase and based more on fashion than fit and comfort, we will lean more on this category as we start up, with this category planned at $7,500 (39% approx. 81 units). The greatest portion of the items sold in this category will be young contemporary sets and the start of Fall nightwear, especially in robes, followed by At Home/lounging sets.
- Hosiery is something we will build on, planning the majority of the first three months sales to be in everyday basic panty hose selling $250 (approx. 1%, 17 units).
- The final portion of the sales plan is in the “other” category, $100 (approx. 0.5%, eight units), primarily in lingerie wash.
October $23,350, approx. 324 units
In the month of October there are 31 selling days, an average daily goal of $753.
- Our second month we will have an ad in Hour Magazine, the October issue is their Fall Fashion issue and will go on the stand the end of September. This is a high-end glossy magazine and on the stand for approximately one month. That gives the customer an opportunity to go back to the ad more than once if she is making a mental note about visiting the store.
- Bras/Intimate Apparel at $9,000 (38%, and approx. 139 units) same as above, with more fittings taking place, due to advertising.
- Shapewear will increase as the weather turns cooler,and we move into the Fall and Holiday season. Planned at $4,500 (19%, approx. 50 units).
- The Sleepwear/At Home-wear category is planned to grow with cooler weather. Planned at $9,500 (41%, and 110 units).
- Hosiery same as above planned at $250 (1%, 17 units).
- Other category same as above, at $100 (0.4%, approx. eight units).
November $30,000, approx. 417 units
In the month of November there are 29 selling days, an average daily goal of $1,035.
- This month we will bring in swimwear. Our ad in Weddingpages will hit the stand at the end of the month, featuring both undergarments for the bride and swimwear for the honeymoon.
- Bras/Intimate Apparel category will be selling a bit more of the high fashion sets and strapless bras for the Holiday season, planned at $10,000 (approx. 33%, 161 units).
- Shapewear will increase in percentage this month due to the garments needed for Holiday dresses, planned at $4,500 (15%, approx. 55 units).
- Sleepwear/At Home-wear will increase due to the receipt of fall robes, planned at $10,000 (33%, approx. 115 units).
- Swimwear will supported by advertising, planned at $5,000 with an average selling price of $100 (17%, approx. 50 units).
- Hosiery will increase with the Holiday season, planned at $300 (1%, approx. 20 units).
- The Other category will increase with the receipt of swimwear wash, planned at $200 (0.7%, approx. 16 units).


| Sales Forecast | |||
| Year 1 | Year 2 | Year 3 | |
| Sales | |||
| Intimate Apparel/Bras | $170,000 | $225,000 | $255,000 |
| Shapewear | $48,000 | $67,500 | $85,000 |
| Sleepwear/At Home wear | $95,000 | $110,000 | $130,000 |
| Swimwear & Accessories | $71,000 | $112,500 | $135,000 |
| Hosiery | $4,300 | $5,200 | $5,750 |
| Other | $1,450 | $15,000 | $44,500 |
| Total Sales | $389,750 | $535,200 | $655,250 |
| Direct Cost of Sales | Year 1 | Year 2 | Year 3 |
| Intimate Apparel/Bras | $76,500 | $101,250 | $114,750 |
| Shapewear | $19,200 | $27,000 | $34,000 |
| Sleepwear/At Home wear | $38,000 | $44,000 | $52,000 |
| Swimwear & Accessories | $28,400 | $45,000 | $54,000 |
| Hosiery | $2,150 | $2,600 | $2,875 |
| Other | $0 | $0 | $0 |
| Subtotal Direct Cost of Sales | $164,250 | $219,850 | $257,625 |
5.4 Advertising Campaign
In talking with prospective customers, and Sales Reps for the Tri-county papers, we have determined our customer reads/listens/watches the following mass media and have devised our advertising program accordingly. Outlined below is our first three months of advertising.
Newspaper/Magazine
- Detroit Free Press
- The Detroit News
- The Oakland Press
- The Macomb Daily
- The Daily Herald
- Hour Magazine
- The Royal Oak Mirror
- The Metro Times
- The Observer & Eccentric papers
- Weddingpages
Radio
- WJLB
- WNIC
- WPLT
Cable
- BET- Black Entertainment
- Lifetime
- WE- Women’s Entertainment
Advertising Schedule (Print Ads/section/audience/cost:)
September Budget $2,721
Cable Advertising
- A commercial featuring the store and services.
- To be played on BET, Lifetime, H&G, The Weather Channel, and WE
- Approx. $1,300
Gazette- Troy/Somerset
- 1/4 pg. Weekly paper- Sat.
- Above the fold, front 5 pages.
- 4×5 ad. wealthy Oakland county area 1/2 business, 1/2 families
- $136
The Mirror
- 1/4 page Ad.
- Weekly paper- Oakland County
- $50,000 household income
- $1,285
October Budget $2,885
Hour Magazine
- 1/6 pg. 4 color Oversized magazine gives a large ad.
- Fall Fashion issue comes out the last week of September
- Over 110,000 subscriptions. Stays on newsstand until end of month.
- Only Detroit monthly magazine.
- $1,585
Cable Advertising
- A commercial featuring the store and services.
- To be played on BET, Lifetime, H&G , The Weather Channel, and WE
- Approx. $1,300
November Budget $3,233
- Michigan Weddingpages & The Knot website
- Published twice a year, December & June
- Distribution of 60,0000, at over 200 locations
- The Knot website has 12,234 area brides as members and 1,020 additional joining each month. A Profile on their website entitles us to a 75 word description of products, price range, services, hours, photo, logo, map-directions, contact information. They will fax all email replies.
- The Weddingpages Ad 1/3 $1,887
- The Knot site $46 per month
Cable Advertising
- A commercial featuring the store and services.
- To be played on BET, Lifetime, H&G, The Weather Channel, and WE
- Approx. $1,300
5.5 Promotional Plan
September
Opening Party for the press, friends and family.
Press Release kit sent to all major media and organizations 2-3 weeks prior to opening.
Kit will include: press release, glossy picture of store and interior, postcards of some of the brands carried, our business card and an invitation to the opening party.
October
Give a short presentation at the meeting of the Plastic Surgeons Assoc., to explain how we can care and fit their patients. Distribute a folder of information to offer their patients, containing: brands carried, services and a glossy of the store. (This is aimed toward enhancement and reduction surgeries.)
November
The start of “Have a fit during lunch”
The third Thursday of each month we will provide tea sandwiches and beverages while our customers get fitted or shop during their lunch hour. No need to sacrifice lunch for shopping. This will be mentioned in our cable advertising for the month.
Management Summary
Bra~vo has a very strong, experienced and professional management team, with over 35 years of combined experience. With each member working in their area of specialization we have every aspect of the business covered. Each member has their area of expertise and percentage of ownership, creating a unified and synergistic team.
6.1 Management Team
Rebecca Autumn will be: Owner/Operator and will be responsible for buying, customer sales and fittings.
Rebecca has spent 18 years in the women’s apparel industry, with five years in the Intimate Apparel industry, three years as a Sales Manager and two years as a sales representative. Calling on stores across the country, working with them to develop their business through inventory management, sales analysis and store promotions. Being based in the Detroit area during her time as a Sales Rep., she is very familiar with all the Intimate Apparel accounts in the state, as well as many across the country. Rebecca is single, 40 years old, and home owner in Royal Oak.
Lucille Winters will be: Co-owner and will act as merchandising consultant, employee training and part-time sales.
Lucille has an extensive background in retail including, Store Owner, Department Store Manager, Speciality Store Manager and Store Merchandiser. Areas of special skills- in-store promotions, store merchandising, customer service and employee development.
Deborah Summers will be: Co-owner and will act as Operation Manager responsible for payable and receivables, inventory control, in store promotions, billing and sales. Deborah has over 20 years experience in operations management, with comprehensive skills in accounts payable/receivable, payroll, office set-up and insurance billing.
6.2 Personnel Plan
Our store will be open seven days a week during the summer when people are shopping the downtown Royal Oak area. Through the winter season we will close on Sundays as do most of the downtown retailers. For the Holiday season we will extend our hours to two nights a week to accommodate those after work shoppers. We will be located next to a well known upscale seafood restaurant, throughout the summer customers line up to wait for a table. We will be able to capture that traffic. As long as there is a customer in the store we will stay open and serve her.
Below are the hours for each season and a yearly employee plan with average weekly hours and pay. We will contact the head of Wayne State University’s Fashion Merchandising Program to arrange an internship for an outstanding Junior or Senior year student who would like to work and earn credit as she learns about the operations of a fashion store from the ground up.
| Winter Season | Holiday Season | Summer Season | |
| Jan.-April | Oct.-Dec. | May- Sept. | |
| Sunday | closed | 12-5 | 12-5 |
| Monday | 10-5:30 | 10-5:30 | 10-5:30 |
| Tuesday | 10-5:30 | 10-5:30 | 10-5:30 |
| Wednesday | 10-5:30 | 10-7 | 10-5:30 |
| Thursday | 10-7 | 10-7 | 10-7 |
| Friday | 10-5:30 | 10-5:30 | 10-7 |
| Saturday | 10-5:30 | 10-5:30 | 10-5:30 |
| Total Hours | 46.5 | 53 | 53 |
| Personnel Plan | |||
| Year 1 | Year 2 | Year 3 | |
| Rebecca Autumn–Full Time | $42,600 | $45,500 | $50,000 |
| Part Time Employee–18hrs.@$9.00 per hr. | $8,440 | $19,125 | $21,000 |
| Part Time Employee–18hrs.@$9.00 per hr. | $4,950 | $14,375 | $15,525 |
| Lucille Winters–Occasional | $4,183 | $6,500 | $6,750 |
| Deborah Summers–3/4 Time | $28,425 | $42,000 | $50,000 |
| Seasonal Part Time | $1,650 | $1,800 | $1,800 |
| Total People | 4 | 4 | 4 |
| Total Payroll | $90,248 | $129,300 | $145,075 |
Financial Plan
- Being a retail store we will not be selling on credit, nor will we have lay-aways.
- The first year we will keep the part-time help to a minimum.
- Due to the soft economy we plan on a better interest rate than offered in the past five years.
7.1 Important Assumptions
Our sales paid for by credit card will be deposited in our business checking account within 48 hours. Since most of our personnel are part-time, the first year only the Owner/Manager Rebecca Autumn will receive benefits. Our business checking account will be with National City, in Royal Oak. They have reported the approximate current interest rates as those below.
| General Assumptions | |||
| Year 1 | Year 2 | Year 3 | |
| Plan Month | 1 | 2 | 3 |
| Current Interest Rate | 9.00% | 9.00% | 9.00% |
| Long-term Interest Rate | 9.00% | 9.00% | 9.00% |
| Tax Rate | 2.50% | 0.00% | 2.50% |
| Other | 0 | 0 | 0 |
7.2 Key Financial Indicators
The following chart shows the Benchmark figures for Bra~vo.

7.3 Break-even Analysis
The following table and chart show our Break-even Analysis. Fixed costs are based on operating expenses in the first year.

| Break-even Analysis | |
| Monthly Revenue Break-even | $32,367 |
| Assumptions: | |
| Average Percent Variable Cost | 42% |
| Estimated Monthly Fixed Cost | $18,727 |
7.4 Projected Profit and Loss
The following table will indicate projected Profit and Loss.


| Pro Forma Profit and Loss | |||
| Year 1 | Year 2 | Year 3 | |
| Sales | $389,750 | $535,200 | $655,250 |
| Direct Cost of Sales | $164,250 | $219,850 | $257,625 |
| Other | $0 | $0 | $0 |
| Total Cost of Sales | $164,250 | $219,850 | $257,625 |
| Gross Margin | $225,500 | $315,350 | $397,625 |
| Gross Margin % | 57.86% | 58.92% | 60.68% |
| Expenses | |||
| Payroll | $90,248 | $129,300 | $145,075 |
| Sales and Marketing and Other Expenses | $42,025 | $48,354 | $46,460 |
| Depreciation | $0 | $0 | $0 |
| Principle Loan Payment | $21,006 | $5,937 | $7,907 |
| Utilities | $5,475 | $6,325 | $7,085 |
| Telephone | $3,000 | $3,850 | $4,240 |
| Insurance | $8,400 | $8,500 | $8,600 |
| Bankcard Machine | $325 | $200 | $0 |
| Bankcard Processing fees | $9,094 | $12,488 | $15,289 |
| Bank Account fees | $108 | $144 | $150 |
| Business Supplies | $1,955 | $800 | $850 |
| Rent | $32,256 | $30,000 | $30,000 |
| Payroll Taxes | $10,830 | $15,516 | $17,409 |
| Other | $0 | $0 | $0 |
| Total Operating Expenses | $224,722 | $261,414 | $283,065 |
| Profit Before Interest and Taxes | $778 | $53,936 | $114,560 |
| EBITDA | $778 | $53,936 | $114,560 |
| Interest Expense | $14,147 | $12,864 | $10,178 |
| Taxes Incurred | $0 | $0 | $2,610 |
| Net Profit | ($13,369) | $41,072 | $101,773 |
| Net Profit/Sales | -3.43% | 7.67% | 15.53% |
7.5 Projected Cash Flow
The following chart and table will indicate projected cash flow.

| Pro Forma Cash Flow | |||
| Year 1 | Year 2 | Year 3 | |
| Cash Received | |||
| Cash from Operations | |||
| Cash Sales | $389,750 | $535,200 | $655,250 |
| Subtotal Cash from Operations | $389,750 | $535,200 | $655,250 |
| Additional Cash Received | |||
| Sales Tax, VAT, HST/GST Received | $0 | $0 | $0 |
| New Current Borrowing | $0 | $0 | $0 |
| New Other Liabilities (interest-free) | $0 | $0 | $0 |
| New Long-term Liabilities | $0 | $0 | $0 |
| Sales of Other Current Assets | $0 | $0 | $0 |
| Sales of Long-term Assets | $0 | $0 | $0 |
| New Investment Received | $0 | $0 | $0 |
| Subtotal Cash Received | $389,750 | $535,200 | $655,250 |
| Expenditures | Year 1 | Year 2 | Year 3 |
| Expenditures from Operations | |||
| Cash Spending | $90,248 | $129,300 | $145,075 |
| Bill Payments | $228,814 | $349,774 | $406,803 |
| Subtotal Spent on Operations | $319,062 | $479,074 | $551,878 |
| Additional Cash Spent | |||
| Sales Tax, VAT, HST/GST Paid Out | $0 | $0 | $0 |
| Principal Repayment of Current Borrowing | $0 | $0 | $0 |
| Other Liabilities Principal Repayment | $0 | $0 | $0 |
| Long-term Liabilities Principal Repayment | $0 | $28,512 | $31,187 |
| Purchase Other Current Assets | $0 | $0 | $0 |
| Purchase Long-term Assets | $0 | $0 | $0 |
| Dividends | $0 | $0 | $0 |
| Subtotal Cash Spent | $319,062 | $507,586 | $583,065 |
| Net Cash Flow | $70,688 | $27,614 | $72,185 |
| Cash Balance | $75,688 | $103,301 | $175,486 |
7.6 Projected Balance Sheet
Deborah Summers will keep our financial reports current, Chris Hamill our accountant will make a quarterly visit to review the reports and offer suggestions on business development.
| Pro Forma Balance Sheet | |||
| Year 1 | Year 2 | Year 3 | |
| Assets | |||
| Current Assets | |||
| Cash | $75,688 | $103,301 | $175,486 |
| Inventory | $8,298 | $11,106 | $13,015 |
| Other Current Assets | $0 | $0 | $0 |
| Total Current Assets | $83,985 | $114,408 | $188,501 |
| Long-term Assets | |||
| Long-term Assets | $0 | $0 | $0 |
| Accumulated Depreciation | $0 | $0 | $0 |
| Total Long-term Assets | $0 | $0 | $0 |
| Total Assets | $83,985 | $114,408 | $188,501 |
| Liabilities and Capital | Year 1 | Year 2 | Year 3 |
| Current Liabilities | |||
| Accounts Payable | $12,354 | $30,217 | $33,724 |
| Current Borrowing | $0 | $0 | $0 |
| Other Current Liabilities | $0 | $0 | $0 |
| Subtotal Current Liabilities | $12,354 | $30,217 | $33,724 |
| Long-term Liabilities | $157,190 | $128,678 | $97,491 |
| Total Liabilities | $169,544 | $158,895 | $131,215 |
| Paid-in Capital | $39,000 | $39,000 | $39,000 |
| Retained Earnings | ($111,190) | ($124,559) | ($83,487) |
| Earnings | ($13,369) | $41,072 | $101,773 |
| Total Capital | ($85,559) | ($44,487) | $57,286 |
| Total Liabilities and Capital | $83,985 | $114,408 | $188,501 |
| Net Worth | ($85,559) | ($44,487) | $57,286 |
7.7 Business Ratios
Business ratios for the years of this plan are shown below. Industry profile ratios based on the Standard Industrial Classification (SIC) code 5632, Women’s Accessory and Specialty Stores, are shown for comparison.
| Ratio Analysis | ||||
| Year 1 | Year 2 | Year 3 | Industry Profile | |
| Sales Growth | 0.00% | 37.32% | 22.43% | 8.20% |
| Percent of Total Assets | ||||
| Inventory | 9.88% | 9.71% | 6.90% | 50.10% |
| Other Current Assets | 0.00% | 0.00% | 0.00% | 22.40% |
| Total Current Assets | 100.00% | 100.00% | 100.00% | 81.40% |
| Long-term Assets | 0.00% | 0.00% | 0.00% | 18.60% |
| Total Assets | 100.00% | 100.00% | 100.00% | 100.00% |
| Current Liabilities | 14.71% | 26.41% | 17.89% | 42.60% |
| Long-term Liabilities | 187.16% | 112.47% | 51.72% | 14.90% |
| Total Liabilities | 201.87% | 138.88% | 69.61% | 57.50% |
| Net Worth | -101.87% | -38.88% | 30.39% | 42.50% |
| Percent of Sales | ||||
| Sales | 100.00% | 100.00% | 100.00% | 100.00% |
| Gross Margin | 57.86% | 58.92% | 60.68% | 40.50% |
| Selling, General & Administrative Expenses | 61.29% | 51.25% | 44.75% | 22.20% |
| Advertising Expenses | 4.71% | 3.92% | 3.51% | 2.20% |
| Profit Before Interest and Taxes | 0.20% | 10.08% | 17.48% | 1.10% |
| Main Ratios | ||||
| Current | 6.80 | 3.79 | 5.59 | 2.23 |
| Quick | 6.13 | 3.42 | 5.20 | 0.57 |
| Total Debt to Total Assets | 201.87% | 138.88% | 69.61% | 57.50% |
| Pre-tax Return on Net Worth | 15.63% | -92.32% | 182.21% | 2.80% |
| Pre-tax Return on Assets | -15.92% | 35.90% | 55.37% | 6.70% |
| Additional Ratios | Year 1 | Year 2 | Year 3 | |
| Net Profit Margin | -3.43% | 7.67% | 15.53% | n.a |
| Return on Equity | 0.00% | 0.00% | 177.66% | n.a |
| Activity Ratios | ||||
| Inventory Turnover | 5.35 | 22.66 | 21.36 | n.a |
| Accounts Payable Turnover | 19.52 | 12.17 | 12.17 | n.a |
| Payment Days | 27 | 21 | 28 | n.a |
| Total Asset Turnover | 4.64 | 4.68 | 3.48 | n.a |
| Debt Ratios | ||||
| Debt to Net Worth | 0.00 | 0.00 | 2.29 | n.a |
| Current Liab. to Liab. | 0.07 | 0.19 | 0.26 | n.a |
| Liquidity Ratios | ||||
| Net Working Capital | $71,631 | $84,191 | $154,777 | n.a |
| Interest Coverage | 0.05 | 4.19 | 11.26 | n.a |
| Additional Ratios | ||||
| Assets to Sales | 0.22 | 0.21 | 0.29 | n.a |
| Current Debt/Total Assets | 15% | 26% | 18% | n.a |
| Acid Test | 6.13 | 3.42 | 5.20 | n.a |
| Sales/Net Worth | 0.00 | 0.00 | 11.44 | n.a |
| Dividend Payout | 0.00 | 0.00 | 0.00 | n.a |
Appendix
| Sales Forecast | |||||||||||||
| Month 1 | Month 2 | Month 3 | Month 4 | Month 5 | Month 6 | Month 7 | Month 8 | Month 9 | Month 10 | Month 11 | Month 12 | ||
| Sales | |||||||||||||
| Intimate Apparel/Bras | 55% | $8,500 | $9,000 | $10,000 | $10,500 | $9,500 | $15,500 | $16,500 | $18,500 | $18,000 | $19,000 | $23,000 | $12,000 |
| Shapewear | 55% | $3,000 | $4,500 | $4,500 | $4,500 | $2,500 | $4,500 | $5,500 | $5,500 | $6,500 | $3,500 | $2,000 | $1,500 |
| Sleepwear/At Home wear | 60% | $7,500 | $9,500 | $10,000 | $12,500 | $3,000 | $9,500 | $9,500 | $9,500 | $10,000 | $8,500 | $3,000 | $2,500 |
| Swimwear & Accessories | 60% | $0 | $0 | $5,000 | $6,500 | $4,500 | $9,500 | $10,500 | $12,500 | $10,500 | $8,500 | $2,500 | $1,000 |
| Hosiery | 50% | $250 | $250 | $300 | $300 | $250 | $300 | $400 | $500 | $750 | $500 | $250 | $250 |
| Other | 0% | $100 | $100 | $200 | $100 | $100 | $100 | $100 | $100 | $100 | $100 | $250 | $100 |
| Total Sales | $19,350 | $23,350 | $30,000 | $34,400 | $19,850 | $39,400 | $42,500 | $46,600 | $45,850 | $40,100 | $31,000 | $17,350 | |
| Direct Cost of Sales | Month 1 | Month 2 | Month 3 | Month 4 | Month 5 | Month 6 | Month 7 | Month 8 | Month 9 | Month 10 | Month 11 | Month 12 | |
| Intimate Apparel/Bras | $3,825 | $4,050 | $4,500 | $4,725 | $4,275 | $6,975 | $7,425 | $8,325 | $8,100 | $8,550 | $10,350 | $5,400 | |
| Shapewear | $1,200 | $1,800 | $1,800 | $1,800 | $1,000 | $1,800 | $2,200 | $2,200 | $2,600 | $1,400 | $800 | $600 | |
| Sleepwear/At Home wear | $3,000 | $3,800 | $4,000 | $5,000 | $1,200 | $3,800 | $3,800 | $3,800 | $4,000 | $3,400 | $1,200 | $1,000 | |
| Swimwear & Accessories | $0 | $0 | $2,000 | $2,600 | $1,800 | $3,800 | $4,200 | $5,000 | $4,200 | $3,400 | $1,000 | $400 | |
| Hosiery | $125 | $125 | $150 | $150 | $125 | $150 | $200 | $250 | $375 | $250 | $125 | $125 | |
| Other | $0 | $0 | $0 | $0 | $0 | $0 | $0 | $0 | $0 | $0 | $0 | $0 | |
| Subtotal Direct Cost of Sales | $8,150 | $9,775 | $12,450 | $14,275 | $8,400 | $16,525 | $17,825 | $19,575 | $19,275 | $17,000 | $13,475 | $7,525 | |
| General Assumptions | |||||||||||||
| Month 1 | Month 2 | Month 3 | Month 4 | Month 5 | Month 6 | Month 7 | Month 8 | Month 9 | Month 10 | Month 11 | Month 12 | ||
| Plan Month | 1 | 2 | 3 | 4 | 5 | 6 | 7 | 8 | 9 | 10 | 11 | 12 | |
| Current Interest Rate | 9.00% | 9.00% | 9.00% | 9.00% | 9.00% | 9.00% | 9.00% | 9.00% | 9.00% | 9.00% | 9.00% | 9.00% | |
| Long-term Interest Rate | 9.00% | 9.00% | 9.00% | 9.00% | 9.00% | 9.00% | 9.00% | 9.00% | 9.00% | 9.00% | 9.00% | 9.00% | |
| Tax Rate | 30.00% | 0.00% | 0.00% | 0.00% | 0.00% | 0.00% | 0.00% | 0.00% | 0.00% | 0.00% | 0.00% | 0.00% | |
| Other | 0 | 0 | 0 | 0 | 0 | 0 | 0 | 0 | 0 | 0 | 0 | 0 | |
| Pro Forma Profit and Loss | |||||||||||||
| Month 1 | Month 2 | Month 3 | Month 4 | Month 5 | Month 6 | Month 7 | Month 8 | Month 9 | Month 10 | Month 11 | Month 12 | ||
| Sales | $19,350 | $23,350 | $30,000 | $34,400 | $19,850 | $39,400 | $42,500 | $46,600 | $45,850 | $40,100 | $31,000 | $17,350 | |
| Direct Cost of Sales | $8,150 | $9,775 | $12,450 | $14,275 | $8,400 | $16,525 | $17,825 | $19,575 | $19,275 | $17,000 | $13,475 | $7,525 | |
| Other | $0 | $0 | $0 | $0 | $0 | $0 | $0 | $0 | $0 | $0 | $0 | $0 | |
| Total Cost of Sales | $8,150 | $9,775 | $12,450 | $14,275 | $8,400 | $16,525 | $17,825 | $19,575 | $19,275 | $17,000 | $13,475 | $7,525 | |
| Gross Margin | $11,200 | $13,575 | $17,550 | $20,125 | $11,450 | $22,875 | $24,675 | $27,025 | $26,575 | $23,100 | $17,525 | $9,825 | |
| Gross Margin % | 57.88% | 58.14% | 58.50% | 58.50% | 57.68% | 58.06% | 58.06% | 57.99% | 57.96% | 57.61% | 56.53% | 56.63% | |
| Expenses | |||||||||||||
| Payroll | $7,651 | $6,840 | $7,305 | $7,606 | $6,571 | $7,485 | $8,035 | $8,035 | $8,035 | $7,545 | $7,570 | $7,570 | |
| Sales and Marketing and Other Expenses | $4,674 | $4,038 | $4,386 | $3,853 | $3,928 | $2,678 | $5,153 | $2,678 | $2,678 | $3,853 | $1,178 | $2,928 | |
| Depreciation | $0 | $0 | $0 | $0 | $0 | $0 | $0 | $0 | $0 | $0 | $0 | $0 | |
| Principle Loan Payment | $1,191 | $1,191 | $1,191 | $1,191 | $1,191 | $1,191 | $2,310 | $2,310 | $2,310 | $2,310 | $2,310 | $2,310 | |
| Utilities | $425 | $425 | $450 | $475 | $475 | $475 | $475 | $475 | $425 | $425 | $475 | $475 | |
| Telephone | $250 | $250 | $250 | $300 | $175 | $250 | $250 | $300 | $250 | $300 | $250 | $175 | |
| Insurance | $700 | $700 | $700 | $700 | $700 | $700 | $700 | $700 | $700 | $700 | $700 | $700 | |
| Bankcard Machine | $325 | $0 | $0 | $0 | $0 | $0 | $0 | $0 | $0 | $0 | $0 | $0 | |
| Bankcard Processing fees | $452 | $545 | $700 | $803 | $463 | $919 | $992 | $1,087 | $1,070 | $936 | $723 | $405 | |
| Bank Account fees | $0 | $0 | $0 | $12 | $12 | $12 | $12 | $12 | $12 | $12 | $12 | $12 | |
| Business Supplies | $1,250 | $0 | $0 | $235 | $0 | $0 | $235 | $0 | $0 | $235 | $0 | $0 | |
| Rent | $2,688 | $2,688 | $2,688 | $2,688 | $2,688 | $2,688 | $2,688 | $2,688 | $2,688 | $2,688 | $2,688 | $2,688 | |
| Payroll Taxes | 12% | $918 | $821 | $877 | $913 | $789 | $898 | $964 | $964 | $964 | $905 | $908 | $908 |
| Other | $0 | $0 | $0 | $0 | $0 | $0 | $0 | $0 | $0 | $0 | $0 | $0 | |
| Total Operating Expenses | $20,524 | $17,498 | $18,547 | $18,775 | $16,992 | $17,297 | $21,814 | $19,250 | $19,132 | $19,909 | $16,815 | $18,171 | |
| Profit Before Interest and Taxes | ($9,324) | ($3,923) | ($997) | $1,350 | ($5,542) | $5,578 | $2,861 | $7,775 | $7,443 | $3,191 | $710 | ($8,346) | |
| EBITDA | ($9,324) | ($3,923) | ($997) | $1,350 | ($5,542) | $5,578 | $2,861 | $7,775 | $7,443 | $3,191 | $710 | ($8,346) | |
| Interest Expense | $1,179 | $1,179 | $1,179 | $1,179 | $1,179 | $1,179 | $1,179 | $1,179 | $1,179 | $1,179 | $1,179 | $1,179 | |
| Taxes Incurred | $0 | $0 | $0 | $0 | $0 | $0 | $0 | $0 | $0 | $0 | $0 | $0 | |
| Net Profit | ($10,503) | ($5,102) | ($2,176) | $171 | ($6,721) | $4,400 | $1,682 | $6,597 | $6,264 | $2,012 | ($469) | ($9,525) | |
| Net Profit/Sales | -54.28% | -21.85% | -7.25% | 0.50% | -33.86% | 11.17% | 3.96% | 14.16% | 13.66% | 5.02% | -1.51% | -54.90% | |
| Pro Forma Cash Flow | |||||||||||||
| Month 1 | Month 2 | Month 3 | Month 4 | Month 5 | Month 6 | Month 7 | Month 8 | Month 9 | Month 10 | Month 11 | Month 12 | ||
| Cash Received | |||||||||||||
| Cash from Operations | |||||||||||||
| Cash Sales | $19,350 | $23,350 | $30,000 | $34,400 | $19,850 | $39,400 | $42,500 | $46,600 | $45,850 | $40,100 | $31,000 | $17,350 | |
| Subtotal Cash from Operations | $19,350 | $23,350 | $30,000 | $34,400 | $19,850 | $39,400 | $42,500 | $46,600 | $45,850 | $40,100 | $31,000 | $17,350 | |
| Additional Cash Received | |||||||||||||
| Sales Tax, VAT, HST/GST Received | 0.00% | $0 | $0 | $0 | $0 | $0 | $0 | $0 | $0 | $0 | $0 | $0 | $0 |
| New Current Borrowing | $0 | $0 | $0 | $0 | $0 | $0 | $0 | $0 | $0 | $0 | $0 | $0 | |
| New Other Liabilities (interest-free) | $0 | $0 | $0 | $0 | $0 | $0 | $0 | $0 | $0 | $0 | $0 | $0 | |
| New Long-term Liabilities | $0 | $0 | $0 | $0 | $0 | $0 | $0 | $0 | $0 | $0 | $0 | $0 | |
| Sales of Other Current Assets | $0 | $0 | $0 | $0 | $0 | $0 | $0 | $0 | $0 | $0 | $0 | $0 | |
| Sales of Long-term Assets | $0 | $0 | $0 | $0 | $0 | $0 | $0 | $0 | $0 | $0 | $0 | $0 | |
| New Investment Received | $0 | $0 | $0 | $0 | $0 | $0 | $0 | $0 | $0 | $0 | $0 | $0 | |
| Subtotal Cash Received | $19,350 | $23,350 | $30,000 | $34,400 | $19,850 | $39,400 | $42,500 | $46,600 | $45,850 | $40,100 | $31,000 | $17,350 | |
| Expenditures | Month 1 | Month 2 | Month 3 | Month 4 | Month 5 | Month 6 | Month 7 | Month 8 | Month 9 | Month 10 | Month 11 | Month 12 | |
| Expenditures from Operations | |||||||||||||
| Cash Spending | $7,651 | $6,840 | $7,305 | $7,606 | $6,571 | $7,485 | $8,035 | $8,035 | $8,035 | $7,545 | $7,570 | $7,570 | |
| Bill Payments | $468 | $13,978 | $11,856 | $12,418 | $12,323 | $11,838 | $19,259 | $34,202 | $33,804 | $31,115 | $27,773 | $19,780 | |
| Subtotal Spent on Operations | $8,119 | $20,818 | $19,161 | $20,024 | $18,894 | $19,323 | $27,294 | $42,237 | $41,839 | $38,660 | $35,343 | $27,350 | |
| Additional Cash Spent | |||||||||||||
| Sales Tax, VAT, HST/GST Paid Out | $0 | $0 | $0 | $0 | $0 | $0 | $0 | $0 | $0 | $0 | $0 | $0 | |
| Principal Repayment of Current Borrowing | $0 | $0 | $0 | $0 | $0 | $0 | $0 | $0 | $0 | $0 | $0 | $0 | |
| Other Liabilities Principal Repayment | $0 | $0 | $0 | $0 | $0 | $0 | $0 | $0 | $0 | $0 | $0 | $0 | |
| Long-term Liabilities Principal Repayment | $0 | $0 | $0 | $0 | $0 | $0 | $0 | $0 | $0 | $0 | $0 | $0 | |
| Purchase Other Current Assets | $0 | $0 | $0 | $0 | $0 | $0 | $0 | $0 | $0 | $0 | $0 | $0 | |
| Purchase Long-term Assets | $0 | $0 | $0 | $0 | $0 | $0 | $0 | $0 | $0 | $0 | $0 | $0 | |
| Dividends | $0 | $0 | $0 | $0 | $0 | $0 | $0 | $0 | $0 | $0 | $0 | $0 | |
| Subtotal Cash Spent | $8,119 | $20,818 | $19,161 | $20,024 | $18,894 | $19,323 | $27,294 | $42,237 | $41,839 | $38,660 | $35,343 | $27,350 | |
| Net Cash Flow | $11,231 | $2,532 | $10,839 | $14,376 | $956 | $20,077 | $15,206 | $4,363 | $4,011 | $1,440 | ($4,343) | ($10,000) | |
| Cash Balance | $16,231 | $18,763 | $29,602 | $43,978 | $44,933 | $65,011 | $80,217 | $84,580 | $88,591 | $90,031 | $85,687 | $75,688 | |
| Pro Forma Balance Sheet | |||||||||||||
| Month 1 | Month 2 | Month 3 | Month 4 | Month 5 | Month 6 | Month 7 | Month 8 | Month 9 | Month 10 | Month 11 | Month 12 | ||
| Assets | Starting Balances | ||||||||||||
| Current Assets | |||||||||||||
| Cash | $5,000 | $16,231 | $18,763 | $29,602 | $43,978 | $44,933 | $65,011 | $80,217 | $84,580 | $88,591 | $90,031 | $85,687 | $75,688 |
| Inventory | $80,000 | $71,850 | $62,075 | $49,625 | $35,350 | $26,950 | $18,178 | $19,608 | $21,533 | $21,203 | $18,700 | $14,823 | $8,298 |
| Other Current Assets | $0 | $0 | $0 | $0 | $0 | $0 | $0 | $0 | $0 | $0 | $0 | $0 | $0 |
| Total Current Assets | $85,000 | $88,081 | $80,838 | $79,227 | $79,328 | $71,883 | $83,188 | $99,825 | $106,112 | $109,793 | $108,731 | $100,510 | $83,985 |
| Long-term Assets | |||||||||||||
| Long-term Assets | $0 | $0 | $0 | $0 | $0 | $0 | $0 | $0 | $0 | $0 | $0 | $0 | $0 |
| Accumulated Depreciation | $0 | $0 | $0 | $0 | $0 | $0 | $0 | $0 | $0 | $0 | $0 | $0 | $0 |
| Total Long-term Assets | $0 | $0 | $0 | $0 | $0 | $0 | $0 | $0 | $0 | $0 | $0 | $0 | $0 |
| Total Assets | $85,000 | $88,081 | $80,838 | $79,227 | $79,328 | $71,883 | $83,188 | $99,825 | $106,112 | $109,793 | $108,731 | $100,510 | $83,985 |
| Liabilities and Capital | Month 1 | Month 2 | Month 3 | Month 4 | Month 5 | Month 6 | Month 7 | Month 8 | Month 9 | Month 10 | Month 11 | Month 12 | |
| Current Liabilities | |||||||||||||
| Accounts Payable | $0 | $13,583 | $11,442 | $12,007 | $11,937 | $11,213 | $18,118 | $33,072 | $32,764 | $30,180 | $27,106 | $19,354 | $12,354 |
| Current Borrowing | $0 | $0 | $0 | $0 | $0 | $0 | $0 | $0 | $0 | $0 | $0 | $0 | $0 |
| Other Current Liabilities | $0 | $0 | $0 | $0 | $0 | $0 | $0 | $0 | $0 | $0 | $0 | $0 | $0 |
| Subtotal Current Liabilities | $0 | $13,583 | $11,442 | $12,007 | $11,937 | $11,213 | $18,118 | $33,072 | $32,764 | $30,180 | $27,106 | $19,354 | $12,354 |
| Long-term Liabilities | $157,190 | $157,190 | $157,190 | $157,190 | $157,190 | $157,190 | $157,190 | $157,190 | $157,190 | $157,190 | $157,190 | $157,190 | $157,190 |
| Total Liabilities | $157,190 | $170,773 | $168,632 | $169,197 | $169,127 | $168,403 | $175,308 | $190,262 | $189,954 | $187,370 | $184,296 | $176,544 | $169,544 |
| Paid-in Capital | $39,000 | $39,000 | $39,000 | $39,000 | $39,000 | $39,000 | $39,000 | $39,000 | $39,000 | $39,000 | $39,000 | $39,000 | $39,000 |
| Retained Earnings | ($111,190) | ($111,190) | ($111,190) | ($111,190) | ($111,190) | ($111,190) | ($111,190) | ($111,190) | ($111,190) | ($111,190) | ($111,190) | ($111,190) | ($111,190) |
| Earnings | $0 | ($10,503) | ($15,604) | ($17,780) | ($17,609) | ($24,330) | ($19,930) | ($18,248) | ($11,651) | ($5,387) | ($3,375) | ($3,844) | ($13,369) |
| Total Capital | ($72,190) | ($82,693) | ($87,794) | ($89,970) | ($89,799) | ($96,520) | ($92,120) | ($90,438) | ($83,841) | ($77,577) | ($75,565) | ($76,034) | ($85,559) |
| Total Liabilities and Capital | $85,000 | $88,081 | $80,838 | $79,227 | $79,328 | $71,883 | $83,188 | $99,825 | $106,112 | $109,793 | $108,731 | $100,510 | $83,985 |
| Net Worth | ($72,190) | ($82,693) | ($87,794) | ($89,970) | ($89,799) | ($96,520) | ($92,120) | ($90,438) | ($83,841) | ($77,577) | ($75,565) | ($76,034) | ($85,559) |
| Personnel Plan | |||||||||||||
| Month 1 | Month 2 | Month 3 | Month 4 | Month 5 | Month 6 | Month 7 | Month 8 | Month 9 | Month 10 | Month 11 | Month 12 | ||
| Rebecca Autumn–Full Time | 0% | $3,550 | $3,550 | $3,550 | $3,550 | $3,550 | $3,550 | $3,550 | $3,550 | $3,550 | $3,550 | $3,550 | $3,550 |
| Part Time Employee–18hrs.@$9.00 per hr. | 0% | $730 | $730 | $730 | $650 | $650 | $650 | $730 | $730 | $730 | $650 | $730 | $730 |
| Part Time Employee–18hrs.@$9.00 per hr. | 0% | $0 | $0 | $0 | $0 | $0 | $650 | $730 | $730 | $730 | $650 | $730 | $730 |
| Lucille Winters–Occasional | 0% | $1,096 | $285 | $285 | $426 | $96 | $285 | $285 | $285 | $285 | $285 | $285 | $285 |
| Deborah Summers–3/4 Time | 0% | $2,275 | $2,275 | $2,500 | $2,500 | $2,275 | $2,275 | $2,500 | $2,500 | $2,500 | $2,275 | $2,275 | $2,275 |
| Seasonal Part Time | 0% | $0 | $0 | $240 | $480 | $0 | $75 | $240 | $240 | $240 | $135 | $0 | $0 |
| Total People | 4 | 3 | 3 | 3 | 4 | 4 | 4 | 4 | 3 | 3 | 3 | 4 | |
| Total Payroll | $7,651 | $6,840 | $7,305 | $7,606 | $6,571 | $7,485 | $8,035 | $8,035 | $8,035 | $7,545 | $7,570 | $7,570 | |

