
San Francisco Limo
Executive Summary
San Francisco Limo is a limousine service serving San Francisco, Burlingame, and San Jose with top quality transportation services using late model limousine sedans. The company has been formed as a California corporation with John Smith and David Jones the sole owners. San Francisco Limo will generate $52,000 in net profit by year three.
The Market
The transportation/limousine in San Francisco is quite competitive. Airport transportation as well weddings, prom nights, and “nights on the town” are quite competitive and margins have eroded. San Francisco Limo will serve these niches to eliminate downtime of the vehicles as well as building a loyal customer base. The true niche of the transportation business that San Francisco Limo will concentrate on is private school student transport, sightseeing trips, and elderly transportation. These niches have higher margins and are less price sensitive. There are 10 private schools in the area with 3,502 students. For the sight seeing market, there are 25 B&Bs and 44 hotels/motels and for the elderly transportation market there are 19 retirement and assisted living facilities in the area. These three markets have 5% growth rates and 2,000; 2,700; and 1,816 potential customers respectively. As mentioned earlier, San Francisco Limo will serve the Burlingame and San Jose in addition to the San Francisco market. While it is common knowledge that there is a large amount of money flowing through the city to a large degree from the boom of the Internet age, Burlingame is also quite affluent. There are 14 surrounding communities for Burlingame, with 3,632 household incomes in excess of $150,000, the precise demographic that uses limousines.
The Business Model
San Francisco Limo will launch the business at a conservative rate. It currently has three sedans. To control costs, the office is home-based and the vehicles are stored in a rented garage. Office space is a premium in this area so the home-based approach will be maintained as long as it is feasible without compromising custom service.
Currently, the industry average for revenue per vehicle is $4,614 with San Francisco Limo only generating $2,500. This figure needs to drastically rise in order for San Francisco Limo to grow and remain profitable. This below market revenue average is a function of a small customer base and participation in competitive niches. Over time both the customer base and penetration in less competitive markets will increase and the revenue per car should grow dramatically.
The Management Team
In order for the company to be successful, the business must fully leverage the experience and insight of their management team of John and David. John is an eight year veteran of the transportation industry. For the first three years John was a limo driver. For the next five years he was elevated to manager of a 12 car limo fleet. It was during this five year tenure that John really learned the majority of his industry knowledge and insight. While David is an equally seasoned manager, his background is in logistics for a shipping company. David has spent nine years at Airborne Express in their logistics department. This experience was instrumental in the development of David’s management skills and gave him the necessary confidence to start his own business.
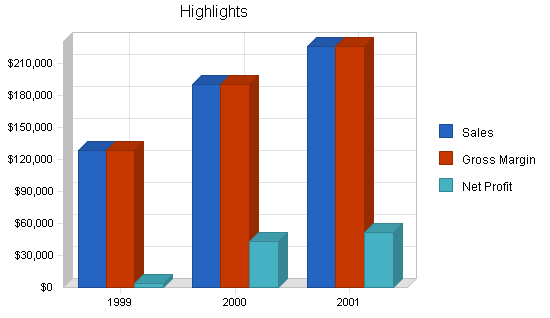
San Francisco Limo will grow at a reasonable pace with both principals working hard doing a little bit of everything. Year one revenue is forecasted to reach $92,000, jumping to $225,000 by year three. Net profits will be $52,000 by year three, 22.94% of sales. Profitability will be reached by month six.
1.1 Objectives
The objective of this business plan is to increase the monthly revenue per vehicle from the present $2,500 to $6,250 by the end of 2001; this number will be 35% better than the statistical national average, $4,614, in the limousine industry for sedans in the Northern California Region.
This will be achieved by:
- Decreasing the company’s reliance on competitive airport transfer type business.
- Increase penetration of more lucrative market segments close to the home base.
- While keeping the most profitable part of the CATA contract, find an even more profitable use for that vehicle.
1.2 Mission
The mission of San Francisco Limo is to become the premiere hourly hire sedan service within a 10-mile radius of Burlingame. We hope to serve a repeat clientele who demand–and can afford–reliable, secure service from drivers with detailed knowledge of the area.
1.3 Keys to Success
- Fleet vehicles must be replaced often to eliminate downtime as well as to maintain an image consistent with the company’s mission statement.
- Superior telephone skills, stressing quick recognition of the client, are essential in fostering the all important repeat clientele.
- Especially true for limousine companies with small fleets, the most import key to success is finding a repeat clientele willing to hire car and driver for a minimum of two hours. While the airport transfer business is booming and there appears to be enough for everyone, it is important to find segments of the market that complement this business during hours when airport transfers are slow. It will also be beneficial to find market segments that are brand loyal (less price-sensitive) which result in longer fares of a less-hectic nature.
Company Summary
San Francisco Limo Incorporated is a small privately-owned limousine service headquartered in Burlingame.
Currently there are three sedans running. The sedans have been under utilized due to a lack of marketing direction. One vehicle is primarily tied up fulfilling a steady but low-yielding Medicare subcontract (CATA).
The other two vehicles have been struggling to capture transfer business (mostly to and from SFO Airport). This business, although attractive and growing steadily, has many competitors and involves a high level of dead-heading to pick up a fare or returning empty after a drop off.
A steady diet of airport pickups and drop-offs is hectic and stressful for the drivers. The airport transfer business is also clustered at certain hours in the morning and again at certain hours in the late afternoon which tends to leave the vehicles idle during certain slow airport periods each day. As a result, it is difficult to reach the national average for revenue per car of $4,615 per month.
2.1 Company History
San Francisco Limo was established at the beginning of 1997, and experienced losses resulting from too many hired drivers and inadequate managerial control. $26,500 was borrowed from family of the stockholders. The mistakes of the past have been corrected and the company is now on level footing.
However, the monthly revenue per vehicle stands at approximately $2,500, whereas, it should exceed the national average for the Northern California Region of $4,615. These statistics are based on the 1997-98 version of Limousine & Chauffeured Transportation Fact Book,which will be hereafter referred to as The Fact Book.

| Past Performance | |||
| 1996 | 1997 | 1998 | |
| Sales | $0 | $0 | $92,007 |
| Gross Margin | $0 | $0 | $88,898 |
| Gross Margin % | 0.00% | 0.00% | 96.62% |
| Operating Expenses | $0 | $0 | $55,141 |
| Collection Period (days) | 0 | 0 | 18 |
| Balance Sheet | |||
| 1996 | 1997 | 1998 | |
| Current Assets | |||
| Cash | $0 | $0 | $1,200 |
| Accounts Receivable | $0 | $0 | $4,000 |
| Other Current Assets | $0 | $0 | $0 |
| Total Current Assets | $0 | $0 | $5,200 |
| Long-term Assets | |||
| Long-term Assets | $0 | $0 | $14,000 |
| Accumulated Depreciation | $0 | $0 | $0 |
| Total Long-term Assets | $0 | $0 | $14,000 |
| Total Assets | $0 | $0 | $19,200 |
| Current Liabilities | |||
| Accounts Payable | $0 | $0 | $0 |
| Current Borrowing | $0 | $0 | $12,000 |
| Other Current Liabilities (interest free) | $0 | $0 | $3,500 |
| Total Current Liabilities | $0 | $0 | $15,500 |
| Long-term Liabilities | $0 | $0 | $26,500 |
| Total Liabilities | $0 | $0 | $42,000 |
| Paid-in Capital | $0 | $0 | $100 |
| Retained Earnings | $0 | $0 | ($56,657) |
| Earnings | $0 | $0 | $33,757 |
| Total Capital | $0 | $0 | ($22,800) |
| Total Capital and Liabilities | $0 | $0 | $19,200 |
| Other Inputs | |||
| Payment Days | 0 | 0 | 80 |
| Sales on Credit | $0 | $0 | $40,000 |
| Receivables Turnover | 0.00 | 0.00 | 10.00 |
2.2 Company Ownership
The company is incorporated in the state of California by John Smith and David Jones, with equal shares held by their spouses.
2.3 Company Locations and Facilities
This is a home office, located in Burlingame, California. A two-car garage is also rented in nearby San Bruno, CA. There are no offices outside the homes of the owners. To maintain efficient head office fleet control management, a sophisticated network of cell phones and two-meter shortwave communication, in conjunction with land lines, are implemented by the company.

Services
San Francisco Limo will offer limousine services in the San Francisco/Burlingame/San Jose area for customers seeking reliable transportation services. The company will gradually seize its service offerings in the competitive market of airport transfers and will specifically target customers who need sightseeing services, transportation of private school students, and elderly citizens. There is less competition in these markets; and the customers are less price sensitive, which will allow San Francisco Limo to charge premium prices for its services.
3.1 Competitive Comparison
The competition for transfer business to and from SFO Airport is strong. There are 59 limousine companies advertising in the San Francisco/Burlingame/San Jose Yellow Pages directory with the following advertising noise level:
- Full Column: 1
- Three Quarter Column: 3
- Half Column: 5
- Quarter Column: 9
- 1 Inch In-Column: 6
- Half Inch In-Column: 1
- Bold Lettering: 8
Of the Quarter column and bigger ads the market segments stressed are:
- Weddings: 11
- Sightseeing: 2
- Airport: All 18
- Proms/Bachelor Parties/Night on Town: 13
- Private School Student Transportation: None
- Assisted Living and Elderly Transportation: 1, and another mentioned handicap capability.
- Corporate: most all offer corporate accounts.
Clearly weddings, prom night/night on the town, and airport transfers are the most competitive. Elderly transportation, private school student transport, and sight-seeing are the least competitive.
At the time of this writing, a sampling of limousine services was undertaken to get a feel for the level of price competition. Eight companies were called in the San Francisco/Swampscott/Beverly/Burlingame area. Of the eight, there were answering machines at two of them. At a third, an elderly woman asked me to call another number. Of the five reached, the charges for a 4:30 a.m. pick up in Beverly for a trip to SFO were:
- Rolls Royce Limo Service: $75.00
- Admiral Limo: $90.00
- Custom Coach Airport Limo: $45.00
- Dependable airport limo: $50.00
- San Francisco Limo: $45.00
- Although it is a shared service, U.S. Shuttle will pick up a fare in Beverly: $22.
3.2 Sales Literature
At the present time no sales literature/brochures are available. Creation of these is a recommendation made in the section on Marketing.
Market Analysis Summary
The major core market for San Francisco Limo is the group of communities located within 10 miles of Burlingame. Fourteen of the most important towns have a total population of over 340,000 comprising 126,000 households. Per capita income ranges from $15,000 in some areas in Lynn to $32,973 in Burlingame. The primary sub-group within this population is made up of those with annual household incomes over $150,000 which comes to 3,632 households. Over 26% of these are in Burlingame alone.
There are many limousine companies to serve this population. The goal of San Francisco Limo must be to segment this market and concentrate the company’s marketing efforts on those markets which are not receiving much attention from competing limousine services. The most attractive segments for which a need exists, and where there is adequate wealth to afford limousine service, are:
- Private School Student Transportation: 10 private schools with 3,502 students
- Sightseeing Segment: 25 B&Bs and 44 Hotel/Motels. Many more not listed in the local Yellow Pages.
- Elderly Transportation: 19 retirement and assisted living institutions.
4.1 Market Segmentation
The are many competitors. There are 59 listed in the Burlingame/San Francisco/San Jose Yellow Pages. Six of these now have advertisements of the same size as San Francisco Limo. A further 18 have ads which are larger. An analysis of these ads indicate that most of the competition is concentrating its marketing efforts on:
- Airport Transfers: All 18 large ads stress this.
- Weddings: 11 of the 18 ads stress this.
- Parties/Night-on-the-Town: 13 of the 18 large ads mention this.
The segments of the market which have attracted the least attention are:
- Private School Student Transportation: None of the 18 mention this.
- Elderly Transportation: Only one of the 18 listed this as a service. Another mentioned handicap capability.
- Sightseeing: Only two of the 18 listed this.
It makes logical sense for San Francisco Limo to direct its marketing approach at these latter three segments. In 1999, the market potential for the private school transportation segment is estimated to be around 2,000 customers. The numerous B&Bs, hotels and inns in the area are estimated to provide around 2,700 customers who need sightseeing services. At the same time, the market potential for the elderly transportation services is estimated to be around 1,800 customers annually. Each of these three customer segments is expected to grow at a steady rate of 5% per year. The chart and table below outline the market potential and its growth for each of the three customer segments.

| Market Analysis | |||||||
| 1999 | 2000 | 2001 | 2002 | 2003 | |||
| Potential Customers | Growth | CAGR | |||||
| Private School Trans | 5% | 2,000 | 2,100 | 2,205 | 2,315 | 2,431 | 5.00% |
| Sight-seeing | 5% | 2,700 | 2,835 | 2,977 | 3,126 | 3,282 | 5.00% |
| Elderly Transport | 5% | 1,816 | 1,907 | 2,002 | 2,102 | 2,207 | 5.00% |
| Total | 5.00% | 6,516 | 6,842 | 7,184 | 7,543 | 7,920 | 5.00% |
4.2 Target Market Segment Strategy
Most of the limousine service competition in the area is concentrated in the corporate, airport transfer, and wedding transportation market segment. While these segments have steady demand for the limousine service, the high level of competition has eroded the margins. Further, incumbent competitors have advantages of vehicle fleets larger than San Francisco Limo.
Consequently, San Francisco Limo will selectively focus its marketing strategy on the private school, sightseeing and elderly transportation segments of the limousine market. The market analysis shows that these segments are less price sensitive. Such customers will require reliable, on time pick ups and knowledgeable drivers. At the same time, competition in these segments is very low. San Francisco Limo can gain a competitive advantage by entering these markets and establishing the reputation of being a reliable service provider. This will be achieved by providing premium services to the targeted customer base and relying on customer referrals to generate new leads.
4.2.1 Market Needs
The customer needs in the limousine transportation market are quite diverse. Corporate and airport transfer clients are mostly interested in reliable and fast service. For these clients, limousine services save time and effort compared to using public transportation or personal vehicles. Prom and bachelor party clients are more interested in the social status associated with the limousine service; however, this segment is less loyal and shops around for the best value. At the same time, wedding and funeral transportation clients, who also seek the emotional benefits of using a limousine service, may be less price sensitive than other segments. Further, the sightseeing segment, which is currently underserved, does not only need spacious and comfortable accommodation during the trip, but also benefits from a driver who is very familiar with the area and who can serve as a guide as well.
4.3 Service Business Analysis
Statistics from The Fact Book show operating results compiled from over 9,600 operators nation-wide. These comparative statistics are available by area of the country and are broken down by type of vehicle. The average hourly rate for a sedan in the Northern California area was $39 in 1997. The sources of revenue of operators was:
- Weddings: 20%
- Airport Transfers: 24%
- Corporate clients: 21.5%
- Night-on-the-Town: 15%
- Funeral: 5%
- Hotel/Resort: 10%
- Other: 4.5%
The Fact Book also gives regional average monthly vehicle revenue of operators owning up to 10 vehicles. These statistics are broken out by type of vehicle (limousines, sedans, vans, buses). The average monthly revenue per sedan in the Northern California region was $4,614, as quoted by The Fact Book. San Francisco Limo is presently achieving a monthly per vehicle revenue of only $2,500. These numbers are also available online at www.limousinecentral.com.
4.3.1 Competition and Buying Patterns
The private transportation services market in the San Francisco area is quite competitive. There are numerous limousine services, shuttles, and taxi cabs available for a wide range of prices.
Of the major customer segments mentioned in The Fact Book, the corporate clients choose limousine services with large fleets that will accommodate their varying needs. This customer segment provides longer term contracts but is more difficult to break into and is more demanding. Wedding and funeral ceremonies, as well as the night-on-the-town customers, usually require stretch limousines to accommodate bigger groups of people. Airport transfer customers usually only require timely pickups and dropoffs and have lower expectations for any additional service features. Growing competition in this segment has made these customers price conscious.
4.3.2 Main Competitors
Since San Francisco Limo only operates sedans, it cannot serve the wedding, night-on-the town, or funeral segments mentioned earlier since stretch limousines are the norm there. The corporate client sector (representing 21.5% of the pie) is hotly contested for by five or six giant players, such as San Francisco Coach, which have huge fleets. The competition for the airport transfer business, although large and growing, is stiff including the 1500 taxis of the San Francisco area, shared shuttle service, and virtually all limousine services. The most immediate competition felt by San Francisco Limo’s present business activity is supplied by:
- Northshore Shuttle Service
- Northshore Airport Limo
- Dependable Airport Shuttle
- Northshore Limo and Sedan Service
- R and A Shuttle Service
- New England Livery
Of the total pie of revenue sources mentioned in The Fact Book, two segments remain: Hotel/resort: 10% and “Other”: 4.5%. It is within these segments that the greatest opportunity exists for diversifying San Francisco Limo’s services.
Strategy and Implementation Summary
The sales and marketing strategy is to move as quickly as possible into the three designated market segments (Sight-seeing, Private School Transportation, and Elderly Transport) that represent excellent growth potential. It has been shown that these market areas are presently not being actively pursued by the competition.
The marketing thrust will consist of direct contact to the responsible person at selected private schools, the creation and distribution of color brochures to Inns, Bed and Breakfasts, Assisted Living and Retirement Communities, and direct mailing to new high worth individuals using the resources of a list company.
5.1 Competitive Edge
The major competitive edge that San Francisco Limo will emphasize is the high quality of its customer service. The company will differentiate itself through the courteousness and good people skills of the dispatchers and drivers, on time pickups and drop offs, and drivers who are highly knowledgeable of the local area. These efforts will generate good word of mouth among the targeted customer group. As the company grows, special efforts will be devoted to the customer service training of the new employees. ‘The customer is always right’ will be the core underlying concept of the customer philosophy of San Francisco Limo.
5.2 Marketing Strategy
The key element of the marketing strategy is to create a high quality color brochure. A properly designed brochure would be 8 1/2 by 11 inches, and folded in thirds for placement in racks at inns. The photography used would convey the desired image of the company and promote the suggested use. The photo of car and driver pointing a tourist’s attention to a well-known tourist destination would be placed on one third of the brochure accompanied by suggested destinations and trip durations. For example, “Cape Ann Circuit Tour” – three hours. Includes Gloucester, Rockport, Motif #1, etc. Another tour name might be called “Indian Summer” and involve an excursion to see the foliage. Four or five carefully thought-out tours with interesting highlights should be included with durations up to a full day. It would be this side of the brochure that would be folded forward and made visible to B&B guests. In similar manner the second section of the brochure would stress the Private School Transportation market and might show a San Francisco Limo with driver in front of the chapel at St. John’s Prep helping a student in a Lacrosse uniform with his luggage.
There should be no resistance at all in getting Inns and B&Bs to accept the brochures and to place them on display for their guests. There are no competing limousine companies who now do this, and a positive result can be expected immediately.
The private schools are more difficult to gain entry; however, once the company is established it would be difficult for a competitor to steal the business away. It will be necessary to call the schools and find out who the responsible person is. After sending a cover letter and color brochure, the responsible person should be contacted in person. Pingree, St. John’s Prep and Governor Dummer are the most attractive for San Francisco Limo. It is likely that the school will send a packet of information to parents of new students that will include a long list of services and costs including transportation off campus. The school will have a policy on who may pick up a student. San Francisco Limo’s name and phone number need to be included in that packet and the company needs to understand the procedure.
The third targeted new market segment for San Francisco Limo is elderly transportation. A list will be obtained of wealthy households in the area. There are 3,632 households within the 14 communities surrounding Burlingame that have incomes in excess of $150,000–26% of them are located in Burlingame alone. The names and addresses can be purchased from a list company such as Act One Mailing List Services, Inc in Burlingame. The cost would be about $300. The names and addresses can be bought as either self-adhesive labels, or as a file on disk. Postage franking can be done by machine. Cost of mailing the brochures would be about $.38 apiece and would include stamping, folding, addressing, and closing with a sticker. It is assumed that many of these wealthy families have children in private schools, so the direct mailing will serve a double duty of reaching the parents of private school students as well as reaching those who need transportation for an elderly family member.
Included in the budget for May is $6,500 to cover the costs of creating and printing the brochure. The printing itself for 10,000 color brochures comes to $2,369 for 80 lb cover stock paper. The rest of the money is for photography, mechanicals, and layout. The direct mailing could be done gradually in order to test the response rate, but the brochures definitely need to distributed by hand to at least 100 selected B&Bs and Inns as soon as possible.
5.2.1 Promotion Strategy
The brochure, described earlier in this business plan, plays a pivotal role in getting the word out concerning San Francisco Limo. Cards should always be made available to passengers. Small magnets can also be obtained at a nominal cost, and can be made in the shape of a limousine. These will help to keep the phone number of the company always handy.
5.2.2 Pricing Strategy
Pricing is more of a deciding factor in the sight-seeing market segment. A $45 per hour rate is reasonable and should not be a problem, especially as a small group of four could share the cost. San Francisco Limo is considering the purchase of a van to better serve this market sector as well as the transfer business of families.
In the private school student transportation market the clientele would more readily choose the limousine company that it has used before that recognizes the student and knows the way. Hourly rates could even move up to $48 or $49 per hour. This is also true of the elderly transportation market. Once an individual uses San Francisco Limo to pick up and transport his/her mother or other family member, he or she will not change limousine services to save a few dollars. Companionship and personal contact play an important role in these market segments thus making them less price sensitive. Charging an extra $10 per hour is unlikely to bring clients to price shop for a replacement sedan service.
5.3 Sales Strategy
Both partners in San Francisco Limo have excellent telephone and interpersonal skills; these are skills which have been useful in making customers comfortable while in the sedan. Keeping customers happy, we feel, is an implicit part of building a relationship that will encourage repeat business. Another helpful strategy to determine how effective our marketing strategies are is finding out how the customer came to call San Francisco Limo.
The new brochures will be available in the vehicles, and some amount of profiling should be carried out by the driver. If the client is being picked up for an airport transfer from a multi-million dollar estate on Burlingame Neck or Nahant, then the driver might look for an unobtrusive moment to ask if the client might have children in private schools or an elderly parent. Keeping a note of the name and address is useful and making sure it is added to a mailing list. An offer of an initial free hour or reduced rate for that elderly or student business might be considered.
Quiet moments should be used to market corporate accounts. A “no” answer does not mean forever. Being friendly, courteous and persistent pays off.
5.3.1 Sales Forecast
- CATA Sales. For the first three months of 1999, CATA sales figures are actual. This segment of San Francisco Limo’s business will decrease to make room for more profitable transfer and hourly chauffeur business resulting from the marketing plan. Assume that the CATA business will consist only of two round trips daily for the existing two rehab patients for whom the waiting period is only 10-15 minutes. These trips are daily, totaling 60 trips per month and generating revenue of $44 per trip–which takes one hour.
- Corporate Clients. Actual sales figures are used for the first three months of 1999. These clients are not much different from the credit card transfer type fares except they are on an open account basis with payment terms of 60 days. The projections for April through July will continue at the average of $1,000 monthly growing to $1,200 per month for the remainder of the year, and years 2000 and 2001 will be projected at $1,400 monthly.
- Transfer (credit cards). This represents the bulk of San Francisco Limo’s present business. Actual figures are given for January through March. Dramatic increases have already been felt as a result of the Yellow Pages ads appearing in May. Seventy-nine trips at an average of $42.30 per trip were performed in March. Assume trips to increase to 100 trips per month in May. June and July will see 120, increasing to 130 in August, 140 in September and October. One hundred and fifty in November, December and January 2000. February 2000 the monthly trips will increase to 160, at an increased average rate of $44. One hundred and seventy trips in June. Year 2001 will average 180 trips monthly, with average per trip price increasing to $48.
- Hourly Hire. This is the segment that is being especially targeted. Actual total for March was $1,617.19 representing 36 hours. Marketing efforts will result in steady increases in this segment beginning in May. We assume that new hourly business will be generated in the tourist, school, and elderly segments amounting to six hours weekly in May, growing steadily to 20 hours weekly in November. After a Christmas and New Year’s lull, hourly hire will pick up again in February 2000 and reach 25 hours/week in April where it will continue at that rate for the rest of 2000. The hourly hire is assumed to reach 30 hours weekly in 2001. We assume an hourly rate of $45 through year 2000. The rate will increase to $48 per hour in 2001.

| Sales Forecast | |||
| 1999 | 2000 | 2001 | |
| Sales | |||
| CATA | $38,645 | $36,960 | $36,960 |
| Corporate Clients | $13,197 | $16,800 | $16,800 |
| Transfers (Credit Cards) | $55,866 | $86,865 | $103,680 |
| Hourly Hire | $20,697 | $49,590 | $69,120 |
| Total Sales | $128,405 | $190,215 | $226,560 |
| Direct Cost of Sales | 1999 | 2000 | 2001 |
| CATA | $0 | $0 | $0 |
| Corporate Clients | $0 | $0 | $0 |
| Transfers (Credit Cards) | $0 | $0 | $0 |
| Hourly Hire | $0 | $0 | $0 |
| Subtotal Direct Cost of Sales | $0 | $0 | $0 |
5.4 Strategic Alliances
There are no strategic alliances at the moment, however, there are possibilities of this in the future.
5.5 Milestones
The most important marketing events, as well as their costs, are noted in the Milestones Table. The actual costs and the dates of implementation will be added when known. The figure of $13,382 is comprised of the down payment of $5,441 for each new vehicle plus the cost of paying off the remaining balance owed on one vehicle ($12,000) less the amount realized from the trade-in value of the two cars (estimated at $9,500). A third vehicle (trade-in value $2,500) will be traded-in in December with a down payment of $5,441 less proceeds from trade-in.
| Milestones | |||||
| Milestone | Start Date | End Date | Budget | Manager | Department |
| Design and Produce Brochure | 5/10/1999 | 5/10/1999 | $6,500 | Peter | Marketing |
| Design Company Logo | 5/10/1999 | 5/10/1999 | $500 | Peter | Marketing |
| Trade-in Two Vehicles | 5/15/1999 | 5/15/1999 | $13,382 | Tim | Operations |
| Buy Address List/labels | 6/1/1999 | 6/1/1999 | $300 | Peter | Marketing |
| Mailing Brochures | 6/10/1999 | 6/10/1999 | $1,140 | Peter | Marketing |
| Business Plan Creation | 4/20/1999 | 4/20/1999 | $1,950 | Peter/Tim | Marketing |
| Trade-In Third Vehicle | 12/1/1999 | 12/1/1999 | $2,941 | Tim | Operations |
| Totals | $26,713 | ||||
Management Summary
The management of the company is jointly undertaken by both owners. Both owners are well aware of the pit-falls of growing too fast and are now taking a more cautious approach to growth. Growth of the company up through the end of year 2001 will be handled by keeping the owners themselves as principle drivers. The projections have assumed peak production hours per month of 316 in 1999 increasing to 390 per month in 2001. This work load can be handled by each owner working 160 hrs per month (i.e. 40/week) with the remainder taken up by the present third driver. Since some time is necessary handling administrative and sales work, it is assumed that the third driver will gradually increase his driving hours to 40 per week in order to free up sufficient management time for non-production administrative/sales work. After year 2001 the management of the company will consider adding additional drivers and/or support staff to handle further growth.
6.1 Organizational Structure
The organizational structure is a simple one. The two owners are in constant contact during the day, and confer on all management and marketing decisions. One owner is primarily responsible for entering the accounts into the computer. The other owner handles the credit card aspects. Leased equipment has been obtained to facilitate the credit card activity and conversion to cash within a two to three day period. The third member takes his instructions from both owners. Each member has a two-meter unlimited use transmitter/receiver providing an effective communication link.
6.2 Personnel Plan
At the present time San Francisco Limo has three vehicles. Two are being driven full time by the two owners and the third part-time by a relative. The part-time driver, Brian, mainly handles the CATA contract–which requires approximately two hours per day. Growth in demand for San Francisco Limo’s services cannot be met with the present arrangement. Growth will require Brian to work a full 40-hour week. Based on the assumptions made when projecting sales the following production hours (behind the wheel) will be necessary. The following table shows the projected hours per month:
| Market Sector | 1999 | 2000 | 2001 |
| CATA | 60 | 60 | 60 |
| Corporate | 26 | 30 | 30 |
| Airport Transfer | 150 | 170 | 180 |
| Hourly | 80 | 100 |
120 |
| Total: | 316 | 360 | 390 |
The above production time will be met by the hired driver (Brian) working 40 hr/week for a total per month of 160 hours. The remainder (156 per month in 1999 up to 230 per month in year 2001) can be handled by each owner working a maximum of 30 hrs driving, with the remaining time spent handling administrative and marketing matters.
It is assumed that each owner will increase his salary, drawing up to $500 per week, beginning December 1999 and increasing to $650/wk and $800/wk as of June first in years 2000 and 2001 respectively. Brian’s salary will remain $9/hr for 1999 increasing to $9.50 in 2000 and $10/hr in 2001. He will work 40 hrs per week beginning in September 1999, until which time he will work 25 hrs/week.
| Personnel Plan | |||
| 1999 | 2000 | 2001 | |
| Tim Politano | $15,200 | $28,200 | $32,800 |
| Peter Battinelli | $15,200 | $28,200 | $32,800 |
| Brian | $12,960 | $19,760 | $20,800 |
| Other | $0 | $0 | $0 |
| Total People | 3 | 3 | 3 |
| Total Payroll | $43,360 | $76,160 | $86,400 |
Financial Plan
The financial plan is to borrow $25,000 now from private sources or a financial institution, at an interest rate of 10%, to finance the marketing plan (brochures, logo design, and direct mail campaign), as well as to finance down payment on two new vehicles. (See “Milestones”). Most of the cost of the new vehicles will be dealer-financed. These new funds will be repaid through the increased cash flow of the company over the next two years. The $12,000 owed on one existing vehicle will need to be repaid before trading it in.
7.1 Important Assumptions
- Short-term Interest Rate: An interest rate of 10% is assumed on the $25,000 in borrowings to be obtained in May 1999 from private sources or a financial institution.
- Long-term Debt: An interest rate of .9% is assumed on auto dealer financing.
- Payment Days: This relates to normal accounts payable. Assume 30 days.
- Collection Days: This relates primarily to corporate client and CATA revenue. Assumption is 60 days. Since this represents only a portion of total revenues, we have assumed only 10% of sales are on credit. Most revenue is on a credit card basis with payment coming within a few days. See below – “sales on credit.”
- Tax Rate: The California corporate tax rate on profits is 9.5%. Added to this is the federal corporate tax rate on profits up to $50,000 of 15%. Total: 24.5%.
- Sales on Credit: Assume only 10% of total sales are on 60 days credit. We regard the credit card sales as a cash sale for projection purposes.
- Personnel Burden: The employer’s cost of various contributions totals 12.65% based on total payroll.
| General Assumptions | |||
| 1999 | 2000 | 2001 | |
| Plan Month | 1 | 2 | 3 |
| Current Interest Rate | 10.00% | 10.00% | 10.00% |
| Long-term Interest Rate | 0.90% | 0.90% | 0.90% |
| Tax Rate | 24.96% | 24.50% | 24.96% |
| Other | 0 | 0 | 0 |
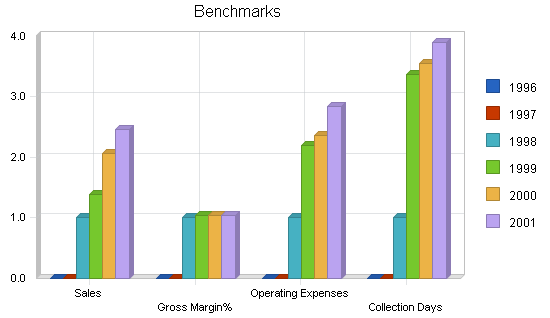
7.2 Key Financial Indicators
The following chart shows our past, as well as our projected, benchmarks.
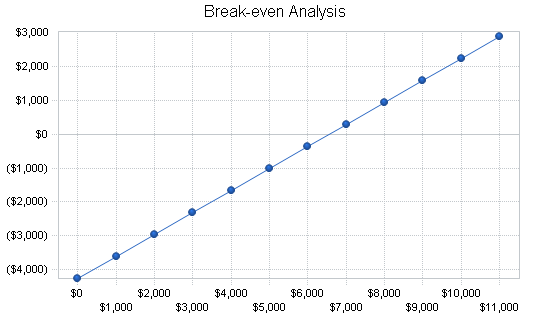
7.3 Break-even Analysis
Assuming for every hour the San Francisco Limo hires out its services it will collect $45 net of any tolls, credit card charges, of other reimbursable fees, there are certain variable costs:
- Fuel and oil: $2.60
- Labor for Driver: $10.14 (all inclusive)
- Total variable: $12.74
For every hour that a car is hired, a net revenue is produced of $32.26 ($45 less $12.74) to go toward paying the company’s fixed costs. These fixed costs (not including the extraordinary marketing expenses planned for 1999) total $4,258. According to the Break-even Analysis, 132 hours of hired service per month need to be provided in order to break even. This compares favorably to a hire service capacity of 480 hours per month (40 hrs/wk for each of three cars). At an hourly hire of $43 the break-even point would be 141 hours. At $48 per hour break-even comes at 121 hours.
| Break-even Analysis | |
| Monthly Revenue Break-even | $6,551 |
| Assumptions: | |
| Average Percent Variable Cost | 35% |
| Estimated Monthly Fixed Cost | $4,258 |
7.4 Projected Profit and Loss
- Yellow Pages Ads: San Francisco Limo has committed to quarter column ads in three local directories (directories #422, 540, and 584) at a monthly cost of $28, $35, and $32 respectively, as well as “one inch in-column” ads in directories #322 and #222 (Beverly, Topsfield, Danvers/San Francisco, San Jose, Danvers) at a monthly cost of $55 each. Total monthly expense is $205. These new directories are appearing in April/May 1999.
- Brochures: These brochures will primarily be delivered to B&Bs and assisted living institutions, as well as be mailed to targeted wealthy households in the area. The numbers for May reflect the $6,500 spent on these brochures. A logo needs to be designed for both the brochure and the letterhead $500.
- Depreciation: (A) Office furniture (total $2,000 as at 12/31/98) is being depreciated over seven years. Straight line method. $23.80 per month. (B) The two new sedans planned for acquisition in May 1999 (cost $27,205 each) will have an estimated depreciated value after 18 months of $15,500 each. Depreciation for both vehicles totals $1,300 monthly. It is assumed that at the end of an 18 month period, these vehicles will be sold at the net book value and will be replaced at the same acquisition cost by two similar vehicles. At the end of 1999 the 1991 Pontiac will be sold and replaced with a new vehicle also at a cost of $27,205, which will have monthly depreciation of $650 and will be replaced in similar manner as the other vehicles.
- Garage Rental: $200 monthly for garage located in Lynn that serves partly as home base/office.
- Fuel: Vehicle mileage is approximately 17-18 mpg. Fuel used is 93 octane costing about $1.20 per gallon. It is assumed that to achieve every $50 of revenue a vehicle will require two gallons of fuel. In 1999 the revenue is projected at $128,405. This would amount to 5,136 gallons @ $1.20 equalling $6,163.
- Oil Changes: Oil changes are made every 3,000 miles and cost approximately $30. At 18 mpg and assuming two gallons per $50 revenue, for every $4,167 in revenue an oil change is necessary. STRONG>Repairs: The reasoning behind trading in vehicles every 18 months is to avoid downtime and expenditures in repairs. However, even new vehicles require some attention (including tires, etc). An expense of $800 per month per vehicles until the present vehicles are replaced with new ones, after which $100 per month per vehicle.
- Washing and Waxing: Assume 6 washes per month per vehicle @ $20.
- Airport Fees: An airport fee of $1.35 is charged on pickups at SFO but not on drop-offs. Assume that 90% of Transfer and Corporate Client revenue involves SFO Airport. Assume 50% of that involves a pickup.
- Dues and Subscriptions: Charges for daily newspapers supplied for clients. $660 annually.
- Registration and Transfers: $85 per vehicle every other year, and $35 on sale of vehicle to transfer plates.
- Excise Tax: This is set by the town at $13 per $1,000.
- Insurance: Insurance will depend on the coverage. According to John Walsh Insurance in San Francisco, they insure a livery company with five vehicles (not carrying passengers) at an annual cost of $12,000. Assume $2,000 per vehicle.
- Telephone: San Francisco Limo has an 800 number at $35/month, a cell phone from Nextel with 300 free minutes at $300 per month (.43/minute thereafter) averaging $350/month, three walkie-talkie units with unlimited usage at $40 each, and two land lines averaging $100/month. Total: $605/month. We have increased this in 2000 and 2001 to reflect increased sales activity.
- Payroll: See section “Payroll” for explanation of assumptions on salaries.
- Accounting: $680 payable every four months.
- Miscellaneous: Includes postage, uniforms, office supplies, fines and tickets, etc. Assume $100/month.
- Self-mailer Campaign: Once the brochures are ready (June), a list will be purchased (at approx. $300) of the $3,600 wealthy households in the area. The cost for mailing these will be spread out over a period of six months. Mailing, including folding, sticker closing, and franking will cost about .38 each ($380 June, September, and November).
- Leased Equipment: This $55 refers to monthly rental of credit card equipment.
| Pro Forma Profit and Loss | |||
| 1999 | 2000 | 2001 | |
| Sales | $128,405 | $190,215 | $226,560 |
| Direct Cost of Sales | $0 | $0 | $0 |
| Other | $0 | $0 | $0 |
| Total Cost of Sales | $0 | $0 | $0 |
| Gross Margin | $128,405 | $190,215 | $226,560 |
| Gross Margin % | 100.00% | 100.00% | 100.00% |
| Expenses | |||
| Payroll | $43,360 | $76,160 | $86,400 |
| Sales and Marketing and Other Expenses | $50,754 | $32,805 | $36,087 |
| Depreciation | $10,685 | $278 | $11,983 |
| Depreciation | $660 | $660 | $660 |
| Utilities | $0 | $0 | $0 |
| Insurance | $6,000 | $6,000 | $6,000 |
| Garage Rental | $2,400 | $2,400 | $2,400 |
| Accounting | $2,040 | $2,040 | $2,040 |
| Payroll Taxes | $5,485 | $9,634 | $10,930 |
| Other | $0 | $0 | $0 |
| Total Operating Expenses | $121,384 | $129,977 | $156,500 |
| Profit Before Interest and Taxes | $7,021 | $60,238 | $70,060 |
| EBITDA | $17,706 | $60,516 | $82,043 |
| Interest Expense | $2,491 | $2,501 | $1,204 |
| Taxes Incurred | $1,080 | $14,146 | $17,185 |
| Net Profit | $3,450 | $43,591 | $51,671 |
| Net Profit/Sales | 2.69% | 22.92% | 22.81% |
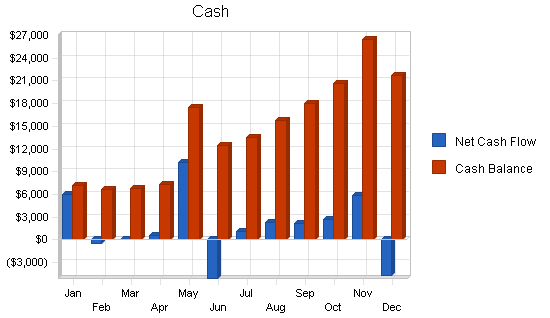
7.5 Projected Cash Flow
Capital Expenditures: The remaining $12,000 owed on the 1996 has to be repaid and the two present vehicles (the 1994 and the 1996) sold for a combined price of $9,500. To meet the cash requirements for this repayment, the company will secure a one-month $4,000 loan from its bank. This short-term loan is reflected as a corresponding increase in the April’s Current Borrowing and a subsequent decrease in the same line in May. The sales transaction of the two old vehicles in the amount of $9,500 is reflected in April’s cash flow. The purchase transaction in May for each car resulted in:
- Increase in Capital Assets (vehicle): $27,205
- Increase in Long-Term Borrowing (dealer financing): $21,764
- Monthly Depreciation Provision: $650
- Monthly Repayment Loan Principal: $613.
At the end of 18 months, these cars will be sold for an estimated price of $15,500 each and two new cars (same transaction as above) will replace them. The sale transaction for each car will be:
- Decrease Capital Assets (vehicle): $27,205
- Decrease Accumulated Depreciation: $11,705
- Repay Outstanding Loan Balance: $10,730
- Increase Cash From Sale: $15,500.
The net effect of the buy/sell per car is:
- Decrease Accumulated Depreciation: $11,705
- Increase Dealer Financing Per Car: $11,034
- Increase Cash From Sale: $15,500. In December of 1999 a 6-7 passenger van will be purchased. For sake of simplicity of projections, we will assume the same price and financial arrangements as for the Mercury Marquis. In similar fashion, this vehicle will also be traded in after 18 months.
- Other Liabilities: Some outstanding debts remain from the start-up period, including tunnel charges (Fast Lane) amounting to $3,500. This amount is repaid in 2001 in a lump sum. There is also the matter of repayment of the $26,500 borrowed from private sources at the start of the business.
| Pro Forma Cash Flow | |||
| 1999 | 2000 | 2001 | |
| Cash Received | |||
| Cash from Operations | |||
| Cash Sales | $115,565 | $171,194 | $203,904 |
| Cash from Receivables | $14,115 | $17,709 | $21,885 |
| Subtotal Cash from Operations | $129,679 | $188,903 | $225,789 |
| Additional Cash Received | |||
| Sales Tax, VAT, HST/GST Received | $0 | $0 | $0 |
| New Current Borrowing | $21,000 | $0 | $0 |
| New Other Liabilities (interest-free) | $0 | $0 | $0 |
| New Long-term Liabilities | $64,099 | $0 | $0 |
| Sales of Other Current Assets | $0 | $0 | $0 |
| Sales of Long-term Assets | $12,000 | $0 | $0 |
| New Investment Received | $0 | $0 | $0 |
| Subtotal Cash Received | $226,778 | $188,903 | $225,789 |
| Expenditures | 1999 | 2000 | 2001 |
| Expenditures from Operations | |||
| Cash Spending | $43,360 | $76,160 | $86,400 |
| Bill Payments | $66,090 | $69,237 | $75,986 |
| Subtotal Spent on Operations | $109,450 | $145,397 | $162,386 |
| Additional Cash Spent | |||
| Sales Tax, VAT, HST/GST Paid Out | $0 | $0 | $0 |
| Principal Repayment of Current Borrowing | $8,000 | $15,000 | $10,000 |
| Other Liabilities Principal Repayment | $0 | $0 | $3,500 |
| Long-term Liabilities Principal Repayment | $7,164 | $0 | $10,494 |
| Purchase Other Current Assets | $0 | $0 | $0 |
| Purchase Long-term Assets | $81,615 | $0 | $0 |
| Dividends | $0 | $0 | $0 |
| Subtotal Cash Spent | $206,229 | $160,397 | $186,380 |
| Net Cash Flow | $20,550 | $28,506 | $39,408 |
| Cash Balance | $21,750 | $50,256 | $89,664 |
7.6 Projected Balance Sheet
Except for $2,000 in office equipment at the end of 1998, capital assets represents three vehicles. The 1994 and 1996 sedans will be sold in May and replaced by two new Mercury Marquis at a book value of $27,205 each. The third vehicle (1991 Pontiac) will remain in service until the end of 1999, at which time it will be replaced by a Town and Country six to seven passenger van at an acquisition price of $27,205.
Capital assets of $12,000 (net of above equipment) represents the net book value of three vehicles which are to be traded in during 1999. This figure of $12,000 is the net amount expected to be realized at the time of the planned trade-ins. Therefore no further depreciation has been provided for these vehicles. Inventory represents uniforms purchased but not yet written off.
| Pro Forma Balance Sheet | |||
| 1999 | 2000 | 2001 | |
| Assets | |||
| Current Assets | |||
| Cash | $21,750 | $50,256 | $89,664 |
| Accounts Receivable | $2,726 | $4,038 | $4,809 |
| Other Current Assets | $0 | $0 | $0 |
| Total Current Assets | $24,475 | $54,293 | $94,473 |
| Long-term Assets | |||
| Long-term Assets | $83,615 | $83,615 | $83,615 |
| Accumulated Depreciation | $10,685 | $10,963 | $22,946 |
| Total Long-term Assets | $72,930 | $72,652 | $60,669 |
| Total Assets | $97,405 | $126,945 | $155,142 |
| Liabilities and Capital | 1999 | 2000 | 2001 |
| Current Liabilities | |||
| Accounts Payable | $4,820 | $5,769 | $6,288 |
| Current Borrowing | $25,000 | $10,000 | $0 |
| Other Current Liabilities | $3,500 | $3,500 | $0 |
| Subtotal Current Liabilities | $33,320 | $19,269 | $6,288 |
| Long-term Liabilities | $83,435 | $83,435 | $72,941 |
| Total Liabilities | $116,755 | $102,704 | $79,229 |
| Paid-in Capital | $100 | $100 | $100 |
| Retained Earnings | ($22,900) | ($19,450) | $24,142 |
| Earnings | $3,450 | $43,591 | $51,671 |
| Total Capital | ($19,350) | $24,242 | $75,913 |
| Total Liabilities and Capital | $97,405 | $126,945 | $155,142 |
| Net Worth | ($19,350) | $24,242 | $75,913 |
7.7 Business Ratios
The following table represents San Francisco Limo’s Business Ratios. Industry standards are taken from SIC code 4119, “other local transportation.”
| Ratio Analysis | ||||
| 1999 | 2000 | 2001 | Industry Profile | |
| Sales Growth | 39.56% | 48.14% | 19.11% | 3.70% |
| Percent of Total Assets | ||||
| Accounts Receivable | 2.80% | 3.18% | 3.10% | 16.70% |
| Other Current Assets | 0.00% | 0.00% | 0.00% | 47.00% |
| Total Current Assets | 25.13% | 42.77% | 60.89% | 64.90% |
| Long-term Assets | 74.87% | 57.23% | 39.11% | 35.10% |
| Total Assets | 100.00% | 100.00% | 100.00% | 100.00% |
| Current Liabilities | 34.21% | 15.18% | 4.05% | 30.00% |
| Long-term Liabilities | 85.66% | 65.73% | 47.02% | 26.20% |
| Total Liabilities | 119.87% | 80.90% | 51.07% | 56.20% |
| Net Worth | -19.87% | 19.10% | 48.93% | 43.80% |
| Percent of Sales | ||||
| Sales | 100.00% | 100.00% | 100.00% | 100.00% |
| Gross Margin | 100.00% | 100.00% | 100.00% | 78.20% |
| Selling, General & Administrative Expenses | 97.34% | 77.08% | 77.06% | 55.40% |
| Advertising Expenses | 1.28% | 1.29% | 1.09% | 0.70% |
| Profit Before Interest and Taxes | 5.47% | 31.67% | 30.92% | 2.10% |
| Main Ratios | ||||
| Current | 0.73 | 2.82 | 15.02 | 1.96 |
| Quick | 0.73 | 2.82 | 15.02 | 1.51 |
| Total Debt to Total Assets | 119.87% | 80.90% | 51.07% | 56.20% |
| Pre-tax Return on Net Worth | -23.41% | 238.17% | 90.70% | 3.50% |
| Pre-tax Return on Assets | 4.65% | 45.48% | 44.38% | 8.10% |
| Additional Ratios | 1999 | 2000 | 2001 | |
| Net Profit Margin | 2.69% | 22.92% | 22.81% | n.a |
| Return on Equity | 0.00% | 179.82% | 68.07% | n.a |
| Activity Ratios | ||||
| Accounts Receivable Turnover | 4.71 | 4.71 | 4.71 | n.a |
| Collection Days | 61 | 65 | 71 | n.a |
| Accounts Payable Turnover | 14.71 | 12.17 | 12.17 | n.a |
| Payment Days | 27 | 28 | 29 | n.a |
| Total Asset Turnover | 1.32 | 1.50 | 1.46 | n.a |
| Debt Ratios | ||||
| Debt to Net Worth | 0.00 | 4.24 | 1.04 | n.a |
| Current Liab. to Liab. | 0.29 | 0.19 | 0.08 | n.a |
| Liquidity Ratios | ||||
| Net Working Capital | ($8,845) | $35,025 | $88,185 | n.a |
| Interest Coverage | 2.82 | 24.09 | 58.20 | n.a |
| Additional Ratios | ||||
| Assets to Sales | 0.76 | 0.67 | 0.68 | n.a |
| Current Debt/Total Assets | 34% | 15% | 4% | n.a |
| Acid Test | 0.65 | 2.61 | 14.26 | n.a |
| Sales/Net Worth | 0.00 | 7.85 | 2.98 | n.a |
| Dividend Payout | 0.00 | 0.00 | 0.00 | n.a |
Appendix
| Sales Forecast | |||||||||||||
| Jan | Feb | Mar | Apr | May | Jun | Jul | Aug | Sep | Oct | Nov | Dec | ||
| Sales | |||||||||||||
| CATA | 0% | $5,475 | $3,016 | $2,434 | $3,080 | $3,080 | $3,080 | $3,080 | $3,080 | $3,080 | $3,080 | $3,080 | $3,080 |
| Corporate Clients | 0% | $899 | $1,351 | $947 | $1,000 | $1,000 | $1,000 | $1,000 | $1,200 | $1,200 | $1,200 | $1,200 | $1,200 |
| Transfers (Credit Cards) | 0% | $1,900 | $2,400 | $3,344 | $3,807 | $4,230 | $5,076 | $5,076 | $5,499 | $5,922 | $5,922 | $6,345 | $6,345 |
| Hourly Hire | 0% | $0 | $0 | $1,617 | $0 | $1,080 | $1,440 | $1,800 | $2,160 | $2,880 | $3,240 | $3,600 | $2,880 |
| Total Sales | $8,274 | $6,767 | $8,342 | $7,887 | $9,390 | $10,596 | $10,956 | $11,939 | $13,082 | $13,442 | $14,225 | $13,505 | |
| Direct Cost of Sales | Jan | Feb | Mar | Apr | May | Jun | Jul | Aug | Sep | Oct | Nov | Dec | |
| CATA | $0 | $0 | $0 | $0 | $0 | $0 | $0 | $0 | $0 | $0 | $0 | $0 | |
| Corporate Clients | $0 | $0 | $0 | $0 | $0 | $0 | $0 | $0 | $0 | $0 | $0 | $0 | |
| Transfers (Credit Cards) | $0 | $0 | $0 | $0 | $0 | $0 | $0 | $0 | $0 | $0 | $0 | $0 | |
| Hourly Hire | $0 | $0 | $0 | $0 | $0 | $0 | $0 | $0 | $0 | $0 | $0 | $0 | |
| Subtotal Direct Cost of Sales | $0 | $0 | $0 | $0 | $0 | $0 | $0 | $0 | $0 | $0 | $0 | $0 | |
| Personnel Plan | |||||||||||||
| Jan | Feb | Mar | Apr | May | Jun | Jul | Aug | Sep | Oct | Nov | Dec | ||
| Tim Politano | 0% | $1,200 | $1,200 | $1,200 | $1,200 | $1,200 | $1,200 | $1,200 | $1,200 | $1,200 | $1,200 | $1,200 | $2,000 |
| Peter Battinelli | 0% | $1,200 | $1,200 | $1,200 | $1,200 | $1,200 | $1,200 | $1,200 | $1,200 | $1,200 | $1,200 | $1,200 | $2,000 |
| Brian | 0% | $900 | $900 | $900 | $900 | $900 | $900 | $900 | $900 | $1,440 | $1,440 | $1,440 | $1,440 |
| Other | 0% | $0 | $0 | $0 | $0 | $0 | $0 | $0 | $0 | $0 | $0 | $0 | $0 |
| Total People | 3 | 3 | 3 | 3 | 3 | 3 | 3 | 3 | 3 | 3 | 3 | 3 | |
| Total Payroll | $3,300 | $3,300 | $3,300 | $3,300 | $3,300 | $3,300 | $3,300 | $3,300 | $3,840 | $3,840 | $3,840 | $5,440 | |
| General Assumptions | |||||||||||||
| Jan | Feb | Mar | Apr | May | Jun | Jul | Aug | Sep | Oct | Nov | Dec | ||
| Plan Month | 1 | 2 | 3 | 4 | 5 | 6 | 7 | 8 | 9 | 10 | 11 | 12 | |
| Current Interest Rate | 10.00% | 10.00% | 10.00% | 10.00% | 10.00% | 10.00% | 10.00% | 10.00% | 10.00% | 10.00% | 10.00% | 10.00% | |
| Long-term Interest Rate | 0.90% | 0.90% | 0.90% | 0.90% | 0.90% | 0.90% | 0.90% | 0.90% | 0.90% | 0.90% | 0.90% | 0.90% | |
| Tax Rate | 30.00% | 24.50% | 24.50% | 24.50% | 24.50% | 24.50% | 24.50% | 24.50% | 24.50% | 24.50% | 24.50% | 24.50% | |
| Other | 0 | 0 | 0 | 0 | 0 | 0 | 0 | 0 | 0 | 0 | 0 | 0 | |
| Pro Forma Profit and Loss | |||||||||||||
| Jan | Feb | Mar | Apr | May | Jun | Jul | Aug | Sep | Oct | Nov | Dec | ||
| Sales | $8,274 | $6,767 | $8,342 | $7,887 | $9,390 | $10,596 | $10,956 | $11,939 | $13,082 | $13,442 | $14,225 | $13,505 | |
| Direct Cost of Sales | $0 | $0 | $0 | $0 | $0 | $0 | $0 | $0 | $0 | $0 | $0 | $0 | |
| Other | $0 | $0 | $0 | $0 | $0 | $0 | $0 | $0 | $0 | $0 | $0 | $0 | |
| Total Cost of Sales | $0 | $0 | $0 | $0 | $0 | $0 | $0 | $0 | $0 | $0 | $0 | $0 | |
| Gross Margin | $8,274 | $6,767 | $8,342 | $7,887 | $9,390 | $10,596 | $10,956 | $11,939 | $13,082 | $13,442 | $14,225 | $13,505 | |
| Gross Margin % | 100.00% | 100.00% | 100.00% | 100.00% | 100.00% | 100.00% | 100.00% | 100.00% | 100.00% | 100.00% | 100.00% | 100.00% | |
| Expenses | |||||||||||||
| Payroll | $3,300 | $3,300 | $3,300 | $3,300 | $3,300 | $3,300 | $3,300 | $3,300 | $3,840 | $3,840 | $3,840 | $5,440 | |
| Sales and Marketing and Other Expenses | $4,036 | $3,966 | $4,057 | $4,662 | $11,610 | $3,397 | $3,038 | $3,480 | $3,169 | $3,188 | $3,618 | $2,533 | |
| Depreciation | $23 | $24 | $23 | $23 | $1,324 | $1,324 | $1,324 | $1,324 | $1,324 | $1,324 | $1,324 | $1,324 | |
| Depreciation | $55 | $55 | $55 | $55 | $55 | $55 | $55 | $55 | $55 | $55 | $55 | $55 | |
| Utilities | $0 | $0 | $0 | $0 | $0 | $0 | $0 | $0 | $0 | $0 | $0 | $0 | |
| Insurance | $500 | $500 | $500 | $500 | $500 | $500 | $500 | $500 | $500 | $500 | $500 | $500 | |
| Garage Rental | $200 | $200 | $200 | $200 | $200 | $200 | $200 | $200 | $200 | $200 | $200 | $200 | |
| Accounting | $170 | $170 | $170 | $170 | $170 | $170 | $170 | $170 | $170 | $170 | $170 | $170 | |
| Payroll Taxes | 13% | $417 | $417 | $417 | $417 | $417 | $417 | $417 | $417 | $486 | $486 | $486 | $688 |
| Other | $0 | $0 | $0 | $0 | $0 | $0 | $0 | $0 | $0 | $0 | $0 | $0 | |
| Total Operating Expenses | $8,701 | $8,632 | $8,722 | $9,327 | $17,576 | $9,363 | $9,004 | $9,446 | $9,744 | $9,763 | $10,193 | $10,910 | |
| Profit Before Interest and Taxes | ($427) | ($1,865) | ($380) | ($1,440) | ($8,186) | $1,233 | $1,952 | $2,493 | $3,338 | $3,679 | $4,032 | $2,595 | |
| EBITDA | ($404) | ($1,841) | ($357) | ($1,417) | ($6,862) | $2,557 | $3,276 | $3,817 | $4,662 | $5,003 | $5,356 | $3,919 | |
| Interest Expense | $120 | $120 | $120 | $53 | $261 | $260 | $259 | $258 | $257 | $256 | $255 | $271 | |
| Taxes Incurred | ($164) | ($486) | ($123) | ($366) | ($2,070) | $238 | $415 | $547 | $755 | $839 | $925 | $569 | |
| Net Profit | ($383) | ($1,499) | ($378) | ($1,128) | ($6,378) | $734 | $1,278 | $1,687 | $2,326 | $2,584 | $2,851 | $1,755 | |
| Net Profit/Sales | -4.63% | -22.15% | -4.53% | -14.30% | -67.92% | 6.93% | 11.66% | 14.13% | 17.78% | 19.23% | 20.05% | 12.99% | |
| Pro Forma Cash Flow | |||||||||||||
| Jan | Feb | Mar | Apr | May | Jun | Jul | Aug | Sep | Oct | Nov | Dec | ||
| Cash Received | |||||||||||||
| Cash from Operations | |||||||||||||
| Cash Sales | $7,447 | $6,090 | $7,508 | $7,098 | $8,451 | $9,536 | $9,860 | $10,745 | $11,774 | $12,098 | $12,803 | $12,155 | |
| Cash from Receivables | $2,000 | $2,028 | $822 | $682 | $833 | $794 | $943 | $1,061 | $1,099 | $1,198 | $1,309 | $1,347 | |
| Subtotal Cash from Operations | $9,447 | $8,118 | $8,330 | $7,780 | $9,284 | $10,330 | $10,803 | $11,806 | $12,873 | $13,296 | $14,112 | $13,501 | |
| Additional Cash Received | |||||||||||||
| Sales Tax, VAT, HST/GST Received | 0.00% | $0 | $0 | $0 | $0 | $0 | $0 | $0 | $0 | $0 | $0 | $0 | $0 |
| New Current Borrowing | $0 | $0 | $0 | $0 | $21,000 | $0 | $0 | $0 | $0 | $0 | $0 | $0 | |
| New Other Liabilities (interest-free) | $0 | $0 | $0 | $0 | $0 | $0 | $0 | $0 | $0 | $0 | $0 | $0 | |
| New Long-term Liabilities | $0 | $0 | $0 | $0 | $43,529 | $0 | $0 | $0 | $0 | $0 | $0 | $20,570 | |
| Sales of Other Current Assets | $0 | $0 | $0 | $0 | $0 | $0 | $0 | $0 | $0 | $0 | $0 | $0 | |
| Sales of Long-term Assets | $0 | $0 | $0 | $9,500 | $0 | $0 | $0 | $0 | $0 | $0 | $2,500 | $0 | |
| New Investment Received | $0 | $0 | $0 | $0 | $0 | $0 | $0 | $0 | $0 | $0 | $0 | $0 | |
| Subtotal Cash Received | $9,447 | $8,118 | $8,330 | $17,280 | $73,813 | $10,330 | $10,803 | $11,806 | $12,873 | $13,296 | $16,612 | $34,071 | |
| Expenditures | Jan | Feb | Mar | Apr | May | Jun | Jul | Aug | Sep | Oct | Nov | Dec | |
| Expenditures from Operations | |||||||||||||
| Cash Spending | $3,300 | $3,300 | $3,300 | $3,300 | $3,300 | $3,300 | $3,300 | $3,300 | $3,840 | $3,840 | $3,840 | $5,440 | |
| Bill Payments | $178 | $5,321 | $4,957 | $5,407 | $5,873 | $10,947 | $5,232 | $5,073 | $5,627 | $5,595 | $5,711 | $6,169 | |
| Subtotal Spent on Operations | $3,478 | $8,621 | $8,257 | $8,707 | $9,173 | $14,247 | $8,532 | $8,373 | $9,467 | $9,435 | $9,551 | $11,609 | |
| Additional Cash Spent | |||||||||||||
| Sales Tax, VAT, HST/GST Paid Out | $0 | $0 | $0 | $0 | $0 | $0 | $0 | $0 | $0 | $0 | $0 | $0 | |
| Principal Repayment of Current Borrowing | $0 | $0 | $0 | $8,000 | $0 | $0 | $0 | $0 | $0 | $0 | $0 | $0 | |
| Other Liabilities Principal Repayment | $0 | $0 | $0 | $0 | $0 | $0 | $0 | $0 | $0 | $0 | $0 | $0 | |
| Long-term Liabilities Principal Repayment | $0 | $0 | $0 | $0 | $0 | $1,194 | $1,194 | $1,194 | $1,194 | $1,194 | $1,194 | $0 | |
| Purchase Other Current Assets | $0 | $0 | $0 | $0 | $0 | $0 | $0 | $0 | $0 | $0 | $0 | $0 | |
| Purchase Long-term Assets | $0 | $0 | $0 | $0 | $54,410 | $0 | $0 | $0 | $0 | $0 | $0 | $27,205 | |
| Dividends | $0 | $0 | $0 | $0 | $0 | $0 | $0 | $0 | $0 | $0 | $0 | $0 | |
| Subtotal Cash Spent | $3,478 | $8,621 | $8,257 | $16,707 | $63,583 | $15,441 | $9,726 | $9,567 | $10,661 | $10,629 | $10,745 | $38,814 | |
| Net Cash Flow | $5,969 | ($503) | $73 | $574 | $10,229 | ($5,111) | $1,078 | $2,239 | $2,212 | $2,666 | $5,867 | ($4,742) | |
| Cash Balance | $7,169 | $6,666 | $6,739 | $7,312 | $17,542 | $12,431 | $13,509 | $15,747 | $17,959 | $20,625 | $26,492 | $21,750 | |
| Pro Forma Balance Sheet | |||||||||||||
| Jan | Feb | Mar | Apr | May | Jun | Jul | Aug | Sep | Oct | Nov | Dec | ||
| Assets | Starting Balances | ||||||||||||
| Current Assets | |||||||||||||
| Cash | $1,200 | $7,169 | $6,666 | $6,739 | $7,312 | $17,542 | $12,431 | $13,509 | $15,747 | $17,959 | $20,625 | $26,492 | $21,750 |
| Accounts Receivable | $4,000 | $2,827 | $1,477 | $1,488 | $1,595 | $1,701 | $1,967 | $2,120 | $2,253 | $2,462 | $2,609 | $2,722 | $2,726 |
| Other Current Assets | $0 | $0 | $0 | $0 | $0 | $0 | $0 | $0 | $0 | $0 | $0 | $0 | $0 |
| Total Current Assets | $5,200 | $9,996 | $8,142 | $8,227 | $8,907 | $19,243 | $14,398 | $15,629 | $18,000 | $20,421 | $23,234 | $29,214 | $24,475 |
| Long-term Assets | |||||||||||||
| Long-term Assets | $14,000 | $14,000 | $14,000 | $14,000 | $4,500 | $58,910 | $58,910 | $58,910 | $58,910 | $58,910 | $58,910 | $56,410 | $83,615 |
| Accumulated Depreciation | $0 | $23 | $47 | $70 | $93 | $1,417 | $2,741 | $4,065 | $5,389 | $6,713 | $8,037 | $9,361 | $10,685 |
| Total Long-term Assets | $14,000 | $13,977 | $13,953 | $13,930 | $4,407 | $57,493 | $56,169 | $54,845 | $53,521 | $52,197 | $50,873 | $47,049 | $72,930 |
| Total Assets | $19,200 | $23,973 | $22,095 | $22,157 | $13,314 | $76,736 | $70,567 | $70,474 | $71,521 | $72,618 | $74,107 | $76,263 | $97,405 |
| Liabilities and Capital | Jan | Feb | Mar | Apr | May | Jun | Jul | Aug | Sep | Oct | Nov | Dec | |
| Current Liabilities | |||||||||||||
| Accounts Payable | $0 | $5,156 | $4,777 | $5,217 | $5,502 | $10,772 | $5,063 | $4,886 | $5,440 | $5,405 | $5,504 | $6,003 | $4,820 |
| Current Borrowing | $12,000 | $12,000 | $12,000 | $12,000 | $4,000 | $25,000 | $25,000 | $25,000 | $25,000 | $25,000 | $25,000 | $25,000 | $25,000 |
| Other Current Liabilities | $3,500 | $3,500 | $3,500 | $3,500 | $3,500 | $3,500 | $3,500 | $3,500 | $3,500 | $3,500 | $3,500 | $3,500 | $3,500 |
| Subtotal Current Liabilities | $15,500 | $20,656 | $20,277 | $20,717 | $13,002 | $39,272 | $33,563 | $33,386 | $33,940 | $33,905 | $34,004 | $34,503 | $33,320 |
| Long-term Liabilities | $26,500 | $26,500 | $26,500 | $26,500 | $26,500 | $70,029 | $68,835 | $67,641 | $66,447 | $65,253 | $64,059 | $62,865 | $83,435 |
| Total Liabilities | $42,000 | $47,156 | $46,777 | $47,217 | $39,502 | $109,301 | $102,398 | $101,027 | $100,387 | $99,158 | $98,063 | $97,368 | $116,755 |
| Paid-in Capital | $100 | $100 | $100 | $100 | $100 | $100 | $100 | $100 | $100 | $100 | $100 | $100 | $100 |
| Retained Earnings | ($56,657) | ($22,900) | ($22,900) | ($22,900) | ($22,900) | ($22,900) | ($22,900) | ($22,900) | ($22,900) | ($22,900) | ($22,900) | ($22,900) | ($22,900) |
| Earnings | $33,757 | ($383) | ($1,882) | ($2,260) | ($3,388) | ($9,765) | ($9,031) | ($7,753) | ($6,066) | ($3,740) | ($1,156) | $1,696 | $3,450 |
| Total Capital | ($22,800) | ($23,183) | ($24,682) | ($25,060) | ($26,188) | ($32,565) | ($31,831) | ($30,553) | ($28,866) | ($26,540) | ($23,956) | ($21,104) | ($19,350) |
| Total Liabilities and Capital | $19,200 | $23,973 | $22,095 | $22,157 | $13,314 | $76,736 | $70,567 | $70,474 | $71,521 | $72,618 | $74,107 | $76,263 | $97,405 |
| Net Worth | ($22,800) | ($23,183) | ($24,682) | ($25,060) | ($26,188) | ($32,565) | ($31,831) | ($30,553) | ($28,866) | ($26,540) | ($23,956) | ($21,104) | ($19,350) |


