
Wy'East Law Firm
Executive Summary
Wy’East Law Firm (WLF) is a boutique technology law firm located in Portland, Oregon. The firm will be lead by Richard Bloom, a seasoned attorney previously with (name omitted)’s e-group. WLF will service all needs generated by technology firms, with specialization on mergers and acquisitions and qualified stock option plans; and handles both start-up and established companies.
In addition to WLF’s technology practice, we will offer public interest legal work at subsidized rates. The technology practice will allow the firm to be able to provide public interest organizations legal help at the cost of overhead.
WLF is a limited liability company founded and lead by Richard Bloom.
1.1 Objectives
The objectives for WLF for the first three years of operation include:
- To create a law firm whose primary goal is to exceed customer’s expectations.
- To develop a client list that includes at least 20 companies, each with revenues of over $3 million.
- To increase the ability to serve public interest organizations each year.
- To be able to offer each year some legal services at a subsidized rate.
1.2 Mission
The mission of Wy’East Law Firm is to provide the Portland community with technological and public interest legal guidance. We exist to attract and maintain customers and to support the public interest community. When we adhere to this maxim, everything else will fall into place.
Company Summary
WLF is a law firm serving technology companies and public interest organizations, and will subsidize its public interest work with local companies. WLF specializes in mergers and acquisitions as well as stock option plans, but can handle most legal needs for a technology company.
The technology work will subsidize the company’s public interest work which will be billed out at the cost of overhead.
2.1 Company Ownership
WLF is a limited liability company, owned solely by Richard Bloom.
2.2 Start-up Summary
WLF’s start-up costs will include all equipment needed for the home office, website creation, and advertising.
The home office equipment will be the largest chunk of the start-up expenses. This equipment includes 4 computers, a fax machine, copier, cellular phone, office supplies, additional land line, a DSL connection, and office furniture.
Start-up expenses will also include advertising. Two methods will be used: a content-only website and the Yellow Pages.

| Start-up | |
| Requirements | |
| Start-up Expenses | |
| Legal | $0 |
| Stationery etc. | $100 |
| Website creation | $500 |
| DSL installation | $150 |
| Office equipment | $500 |
| Rent | $0 |
| Research and development | $0 |
| Expensed equipment | $0 |
| Other | $0 |
| Total Start-up Expenses | $1,250 |
| Start-up Assets | |
| Cash Required | $18,750 |
| Other Current Assets | $0 |
| Long-term Assets | $5,000 |
| Total Assets | $23,750 |
| Total Requirements | $25,000 |
| Start-up Funding | |
| Start-up Expenses to Fund | $1,250 |
| Start-up Assets to Fund | $23,750 |
| Total Funding Required | $25,000 |
| Assets | |
| Non-cash Assets from Start-up | $5,000 |
| Cash Requirements from Start-up | $18,750 |
| Additional Cash Raised | $0 |
| Cash Balance on Starting Date | $18,750 |
| Total Assets | $23,750 |
| Liabilities and Capital | |
| Liabilities | |
| Current Borrowing | $0 |
| Long-term Liabilities | $0 |
| Accounts Payable (Outstanding Bills) | $0 |
| Other Current Liabilities (interest-free) | $0 |
| Total Liabilities | $0 |
| Capital | |
| Planned Investment | |
| Investor 1 | $25,000 |
| Investor 2 | $0 |
| Other | $0 |
| Additional Investment Requirement | $0 |
| Total Planned Investment | $25,000 |
| Loss at Start-up (Start-up Expenses) | ($1,250) |
| Total Capital | $23,750 |
| Total Capital and Liabilities | $23,750 |
| Total Funding | $25,000 |
Services
WLF will provide provide law services to two different groups of customers.
- Technology law services. WLF will provide legal services to high technology clients, to both start-up companies and established firms. While the firm excels in mergers, acquisitions, and qualified stock option plans, we also have experience in almost any legal field that a tech firm encounters. These clients, billed at market rate, will subsidize the public interest clients.
- Public interest law. WLF will serve regional public interest organizations, with a concentration on environmental and civil rights organizations. For most public interest organizations, good legal help is expensive. By using technology clients to subsidize the cost of legal fees for public interest firms, WLF is able to make significant contributions back to the community.
Market Analysis Summary
WLF’s customers can be divided into two groups, technology firms and public interest organizations.
- Technology firms. New clients are likely to be from small technology firms or start-up companies. The reason for this is that the larger tech firms usually will go with one of the larger law firms in town because a large firm can offer them a wide range of services and do all of the different types of work that is needed. This type of customer sees an advantage for one firm handling all of their needs, and rightfully so. A smaller company has fewer overall legal needs and can be serviced by a boutique firm. A start-up might also be attracted to us because of our willingness to accept equity as partial payment for services rendered. Clients that were brought over to WLF from Richard’s old firm are typically small firms, but there are a few larger companies that are using this firm for some services and kept some other work at (name omitted), where Richard practiced before.
- Public interest organizations. These clients will be diversified, some are environmental organizations others are civil rights groups. While some public interest organizations receive their legal services for free (pro bono) from some attorneys, there is an extreme shortage of legal help for these organizations. Therefore, it is quite attractive to these organizations to have the possibility of receiving top legal help at a subsidized rate. Attracting these clients will not be the problem, the difficulty will be for Richard to select which organization will receive his help.

| Market Analysis | |||||||
| Year 1 | Year 2 | Year 3 | Year 4 | Year 5 | |||
| Potential Customers | Growth | CAGR | |||||
| Technology companies | 9% | 345 | 376 | 410 | 447 | 487 | 9.00% |
| Public interest organizations | 8% | 278 | 300 | 324 | 350 | 378 | 7.98% |
| Other | 0% | 0 | 0 | 0 | 0 | 0 | 0.00% |
| Total | 8.55% | 623 | 676 | 734 | 797 | 865 | 8.55% |
4.1 Target Market Segment Strategy
WLF will be targeting high technology companies for two reasons.
- Although the economy has taken a recent plummet, particularly technology firms, technology is still a growing sector of the economy. This is evidenced by the fact that 17 out of the top 25 fastest growing companies are technology firms, according to The Business Journal of Portland.
- Technology is Richard’s area of expertise. Richard practiced law at one of the top three law firms in Portland and was in their e-group, concentrating on technology firms. His experience, coupled with his network of colleagues within the industry, makes technology firms attractive customers.
WLF will be targeting public interest organizations for one simple reason, a desire to give back to the community. Public interest work is inherently altruistic to some degree. Generally, the person performing the work receives a good feeling for his/her contribution, but in today’s capitalistic society, someone who donates his/her time at far below market wages should be considered altruistic.
4.2 Service Business Analysis
The technology law practice is fairly competitive in Portland. Most larger, more prestigious firms have attorneys who specialize in technology. Some smaller firms also have attorneys who do work for technology companies. Lastly, there are boutique firms, like WLF. As a service-based industry, the practice of law is driven by personal relationships and reputation. Potential clients choose attorneys based on reputation and who they are familiar with or are recommended to. Therefore, if the attorney is providing better service to a client, the client is likely to form a long lasting business relationship with the client.
Clients typically switch attorneys only if they are unhappy with their current attorney. New companies find attorneys through networking: who they know or who their friends know.

WLF has the advantage that when Richard left (name omitted) he brought 15 of his clients, which, for now, are almost enough to survive on.
Strategy and Implementation Summary
WLF will be courting new technology clients through networking and advertisements in the Yellow Pages, Business Journal of Portland, and other technology specific regional journals. As stated earlier, WLF has a sufficient amount of business at day one, however, more technology clients means the ability to perform more public interest work.
Richard will be attending the Portland Venture Group meetings as well as other informal gatherings of technology companies to network with the different technology firms in the region. These networking activities along with advertisements in appropriate media forms will allow WLF to steadily grow their list of clients.
5.1 Competitive Edge
WLF’s competitive advantage will be based on two factors, experience and specialization:
- Experience. Richard brings to WLF three years of practicing technology law at a top firm in Portland. Reputation carries a lot of weight and Richard’s time at (name omitted) means a lot in the Portland legal community and is very attractive to prospective clients. Additionally, beyond the reputation of working for a coveted firm, is the fact that the three years spent at (name omitted) provided Richard with big name clients.
- Specialization. As a boutique firm that concentrates on technology companies, WLF is in a desirable situation because it’s knowledge base is considerable, relative to other firms that practice a wide range of law.
5.2 Sales Strategy
WLF’s sales strategy will begin with months two through five with the goal of serving the existing customer base of clients. The absence of bringing in new clients during this time is purposeful, it allows WLF and the existing clients to form a new relationship at WLF, different from their previous relationship at (name omitted).
Month six will signal WLF’s conscious effort to generate new clients. Using the previously mentioned networking techniques, Richard, through personal communications, will convince prospective clients of the value of a boutique technology law firm, specifically the depth of knowledge and the close attention that the client will get when dealing with a small firm.
Regarding the public interest organizations, there will be less of a sale strategy, more of a choosing of the organizations that Richard wants to represent. There are so many needy public interest organizations that Richard will have to pick and choose those that he wishes to help out.
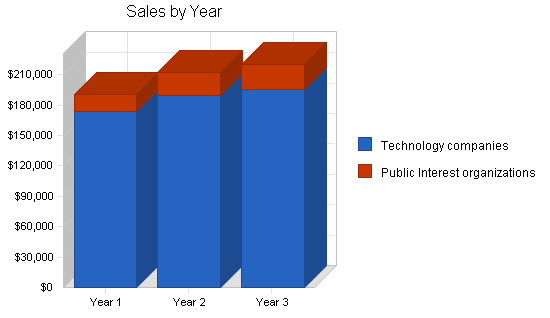
5.2.1 Sales Forecast
The first month will be spent setting up the home office. This will include setting up the office, a conference room, and all of the computer equipment. During the first month, Richard will also be serving some existing technology clients and some public interest clients. We project that if we spend 1/3 of our time on the technology clients, this would sufficiently subsidize the public interest clients so we would only have to cover overhead expenses.
By month six, Richard will begin actively soliciting new clients. Between months one and five he will continue networking, though will not be actively seeking customers. From month seven on and there will be a slight increase in clients taken aboard. There will be only a slight increase so as to create solid relationships with the new and existing clients. Richard will be cognizant of the possibility of growing too fast and not being able to offer the same quality service to his clients.
| Sales Forecast | |||
| Year 1 | Year 2 | Year 3 | |
| Sales | |||
| Technology companies | $174,096 | $189,525 | $195,747 |
| Public Interest organizations | $16,839 | $22,578 | $24,547 |
| Total Sales | $190,935 | $212,103 | $220,294 |
| Direct Cost of Sales | Year 1 | Year 2 | Year 3 |
| Technology companies | $0 | $0 | $0 |
| Public Interest organizations | $0 | $0 | $0 |
| Subtotal Direct Cost of Sales | $0 | $0 | $0 |
5.3 Milestones
WLF will have several milestones early on:
- Business plan completion.
- Set up home office.
- First month of total technology subsidy.
| Milestones | |||||
| Milestone | Start Date | End Date | Budget | Manager | Department |
| Business plan completion | 1/1/2001 | 1/1/2001 | $0 | Richard | Marketing |
| Set up ofifce | 1/1/2001 | 1/1/2001 | $0 | Richard | Department |
| First month of total technology subsidy | 4/1/2001 | 4/1/2001 | $0 | WLF | Department |
| Totals | $0 | ||||
Management Summary
Wy’East Law Firm is an Oregon Corporation founded and run by Richard Bloom. Richard has a degree in Political Science from the University of Colorado, Boulder, and a J.D. from Lewis and Clark University. While at Lewis and Clark, Richard was the President of the school’s Public Interest Student Organization. It was through this organization that Richard became fond of public interest law. After graduation, Richard went to work for (name omitted) for three years in the e-group which concentrated on technology. While working in the e-group, Richard worked on technology issues with a number of well known start-up organizations and established companies.
One of the perks working at (name omitted) was his ability to do pro bono work which counted toward his required yearly billable hours requirement. Richard has spent a fair amount of time with 1000 Friends of Oregon and other public interest organizations. After three years however, Richard was feeling constrained and desired more autonomy. He decided to leave and start his own firm. Richard was able to bring a fair number of his clients from (name omitted) to his new firm, helping the transition from leaving an established practice to hanging out his own shingle and starting over.
6.1 Personnel Plan
The staff will consist of Richard working full time. In addition to Richard, a part-time secretary and part-time paralegal will join WLF by month two. Month four will bring WLF a law clerk, and a second law clerk by month eight.
| Personnel Plan | |||
| Year 1 | Year 2 | Year 3 | |
| Richard | $66,000 | $66,000 | $66,000 |
| Receptionist/ secretary | $11,550 | $12,500 | $13,500 |
| Paralegal | $22,000 | $23,000 | $24,000 |
| Law clerk | $8,100 | $11,000 | $12,000 |
| Law clerk | $4,500 | $11,000 | $12,000 |
| Total People | 5 | 5 | 5 |
| Total Payroll | $112,150 | $123,500 | $127,500 |
Financial Plan
The following sections will outline important financial information.
7.1 Important Assumptions
The following table details important assumptions.
| General Assumptions | |||
| Year 1 | Year 2 | Year 3 | |
| Plan Month | 1 | 2 | 3 |
| Current Interest Rate | 10.00% | 10.00% | 10.00% |
| Long-term Interest Rate | 10.00% | 10.00% | 10.00% |
| Tax Rate | 25.42% | 25.00% | 25.42% |
| Other | 0 | 0 | 0 |
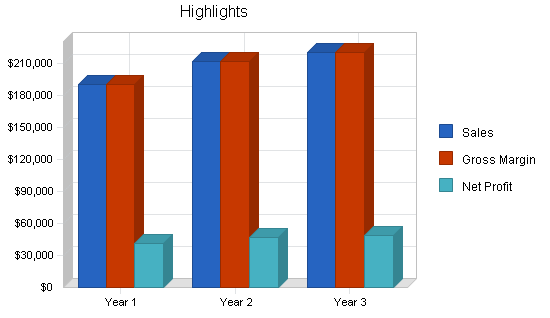
7.2 Projected Profit and Loss
The following table and charts present the projected profit and loss.


| Pro Forma Profit and Loss | |||
| Year 1 | Year 2 | Year 3 | |
| Sales | $190,935 | $212,103 | $220,294 |
| Direct Cost of Sales | $0 | $0 | $0 |
| Other | $0 | $0 | $0 |
| Total Cost of Sales | $0 | $0 | $0 |
| Gross Margin | $190,935 | $212,103 | $220,294 |
| Gross Margin % | 100.00% | 100.00% | 100.00% |
| Expenses | |||
| Payroll | $112,150 | $123,500 | $127,500 |
| Sales and Marketing and Other Expenses | $2,160 | $2,160 | $2,160 |
| Depreciation | $1,668 | $1,666 | $1,666 |
| Leased Equipment | $0 | $0 | $0 |
| Utilities | $1,500 | $1,500 | $1,500 |
| Rent | $2,400 | $2,400 | $2,400 |
| Payroll Taxes | $16,823 | $18,525 | $19,125 |
| Other | $0 | $0 | $0 |
| Total Operating Expenses | $136,701 | $149,751 | $154,351 |
| Profit Before Interest and Taxes | $54,235 | $62,352 | $65,943 |
| EBITDA | $55,903 | $64,018 | $67,609 |
| Interest Expense | $0 | $0 | $0 |
| Taxes Incurred | $13,210 | $15,588 | $16,761 |
| Net Profit | $41,024 | $46,764 | $49,182 |
| Net Profit/Sales | 21.49% | 22.05% | 22.33% |
7.3 Break-even Analysis
The Break-even Analysis indicates what WLF will need in hours and revenue a month to reach the break-even point.

| Break-even Analysis | |
| Monthly Revenue Break-even | $11,392 |
| Assumptions: | |
| Average Percent Variable Cost | 0% |
| Estimated Monthly Fixed Cost | $11,392 |
7.4 Projected Cash Flow
The following chart and table show anticipated cash flow.

| Pro Forma Cash Flow | |||
| Year 1 | Year 2 | Year 3 | |
| Cash Received | |||
| Cash from Operations | |||
| Cash Sales | $47,734 | $53,026 | $55,074 |
| Cash from Receivables | $112,707 | $155,697 | $163,912 |
| Subtotal Cash from Operations | $160,441 | $208,722 | $218,986 |
| Additional Cash Received | |||
| Sales Tax, VAT, HST/GST Received | $0 | $0 | $0 |
| New Current Borrowing | $0 | $0 | $0 |
| New Other Liabilities (interest-free) | $0 | $0 | $0 |
| New Long-term Liabilities | $0 | $0 | $0 |
| Sales of Other Current Assets | $0 | $0 | $0 |
| Sales of Long-term Assets | $0 | $0 | $0 |
| New Investment Received | $0 | $0 | $0 |
| Subtotal Cash Received | $160,441 | $208,722 | $218,986 |
| Expenditures | Year 1 | Year 2 | Year 3 |
| Expenditures from Operations | |||
| Cash Spending | $112,150 | $123,500 | $127,500 |
| Bill Payments | $31,394 | $41,570 | $41,800 |
| Subtotal Spent on Operations | $143,544 | $165,070 | $169,300 |
| Additional Cash Spent | |||
| Sales Tax, VAT, HST/GST Paid Out | $0 | $0 | $0 |
| Principal Repayment of Current Borrowing | $0 | $0 | $0 |
| Other Liabilities Principal Repayment | $0 | $0 | $0 |
| Long-term Liabilities Principal Repayment | $0 | $0 | $0 |
| Purchase Other Current Assets | $0 | $0 | $0 |
| Purchase Long-term Assets | $0 | $0 | $0 |
| Dividends | $0 | $0 | $0 |
| Subtotal Cash Spent | $143,544 | $165,070 | $169,300 |
| Net Cash Flow | $16,898 | $43,652 | $49,686 |
| Cash Balance | $35,648 | $79,300 | $128,986 |
7.5 Projected Balance Sheet
The following table displays the projected balance sheet.
| Pro Forma Balance Sheet | |||
| Year 1 | Year 2 | Year 3 | |
| Assets | |||
| Current Assets | |||
| Cash | $35,648 | $79,300 | $128,986 |
| Accounts Receivable | $30,494 | $33,874 | $35,183 |
| Other Current Assets | $0 | $0 | $0 |
| Total Current Assets | $66,141 | $113,174 | $164,168 |
| Long-term Assets | |||
| Long-term Assets | $5,000 | $5,000 | $5,000 |
| Accumulated Depreciation | $1,668 | $3,334 | $5,000 |
| Total Long-term Assets | $3,332 | $1,666 | $0 |
| Total Assets | $69,473 | $114,840 | $164,168 |
| Liabilities and Capital | Year 1 | Year 2 | Year 3 |
| Current Liabilities | |||
| Accounts Payable | $4,699 | $3,302 | $3,448 |
| Current Borrowing | $0 | $0 | $0 |
| Other Current Liabilities | $0 | $0 | $0 |
| Subtotal Current Liabilities | $4,699 | $3,302 | $3,448 |
| Long-term Liabilities | $0 | $0 | $0 |
| Total Liabilities | $4,699 | $3,302 | $3,448 |
| Paid-in Capital | $25,000 | $25,000 | $25,000 |
| Retained Earnings | ($1,250) | $39,774 | $86,538 |
| Earnings | $41,024 | $46,764 | $49,182 |
| Total Capital | $64,774 | $111,538 | $160,721 |
| Total Liabilities and Capital | $69,473 | $114,840 | $164,168 |
| Net Worth | $64,774 | $111,538 | $160,721 |
7.6 Business Ratios
Industry profile ratios based on the NAICS code 541110, Offices of Lawyers, are shown in the table below.
| Ratio Analysis | ||||
| Year 1 | Year 2 | Year 3 | Industry Profile | |
| Sales Growth | 0.00% | 11.09% | 3.86% | 8.50% |
| Percent of Total Assets | ||||
| Accounts Receivable | 43.89% | 29.50% | 21.43% | 8.60% |
| Other Current Assets | 0.00% | 0.00% | 0.00% | 66.90% |
| Total Current Assets | 95.20% | 98.55% | 100.00% | 75.50% |
| Long-term Assets | 4.80% | 1.45% | 0.00% | 24.50% |
| Total Assets | 100.00% | 100.00% | 100.00% | 100.00% |
| Current Liabilities | 6.76% | 2.88% | 2.10% | 50.20% |
| Long-term Liabilities | 0.00% | 0.00% | 0.00% | 12.90% |
| Total Liabilities | 6.76% | 2.88% | 2.10% | 63.10% |
| Net Worth | 93.24% | 97.12% | 97.90% | 36.90% |
| Percent of Sales | ||||
| Sales | 100.00% | 100.00% | 100.00% | 100.00% |
| Gross Margin | 100.00% | 100.00% | 100.00% | 0.00% |
| Selling, General & Administrative Expenses | 78.70% | 77.95% | 77.55% | 58.20% |
| Advertising Expenses | 0.13% | 0.11% | 0.11% | 0.50% |
| Profit Before Interest and Taxes | 28.40% | 29.40% | 29.93% | 3.40% |
| Main Ratios | ||||
| Current | 14.08 | 34.28 | 47.62 | 1.54 |
| Quick | 14.08 | 34.28 | 47.62 | 1.09 |
| Total Debt to Total Assets | 6.76% | 2.88% | 2.10% | 63.10% |
| Pre-tax Return on Net Worth | 83.73% | 55.90% | 41.03% | 12.30% |
| Pre-tax Return on Assets | 78.07% | 54.29% | 40.17% | 33.40% |
| Additional Ratios | Year 1 | Year 2 | Year 3 | |
| Net Profit Margin | 21.49% | 22.05% | 22.33% | n.a |
| Return on Equity | 63.33% | 41.93% | 30.60% | n.a |
| Activity Ratios | ||||
| Accounts Receivable Turnover | 4.70 | 4.70 | 4.70 | n.a |
| Collection Days | 57 | 74 | 76 | n.a |
| Accounts Payable Turnover | 7.68 | 12.17 | 12.17 | n.a |
| Payment Days | 34 | 36 | 29 | n.a |
| Total Asset Turnover | 2.75 | 1.85 | 1.34 | n.a |
| Debt Ratios | ||||
| Debt to Net Worth | 0.07 | 0.03 | 0.02 | n.a |
| Current Liab. to Liab. | 1.00 | 1.00 | 1.00 | n.a |
| Liquidity Ratios | ||||
| Net Working Capital | $61,442 | $109,872 | $160,721 | n.a |
| Interest Coverage | 0.00 | 0.00 | 0.00 | n.a |
| Additional Ratios | ||||
| Assets to Sales | 0.36 | 0.54 | 0.75 | n.a |
| Current Debt/Total Assets | 7% | 3% | 2% | n.a |
| Acid Test | 7.59 | 24.02 | 37.41 | n.a |
| Sales/Net Worth | 2.95 | 1.90 | 1.37 | n.a |
| Dividend Payout | 0.00 | 0.00 | 0.00 | n.a |
Appendix
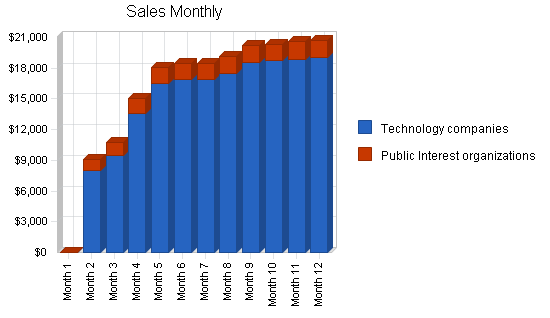
| Sales Forecast | |||||||||||||
| Month 1 | Month 2 | Month 3 | Month 4 | Month 5 | Month 6 | Month 7 | Month 8 | Month 9 | Month 10 | Month 11 | Month 12 | ||
| Sales | |||||||||||||
| Technology companies | 0% | $0 | $8,005 | $9,514 | $13,587 | $16,547 | $16,874 | $16,854 | $17,525 | $18,547 | $18,752 | $18,887 | $19,004 |
| Public Interest organizations | 0% | $0 | $1,100 | $1,200 | $1,500 | $1,545 | $1,587 | $1,584 | $1,654 | $1,666 | $1,548 | $1,741 | $1,714 |
| Total Sales | $0 | $9,105 | $10,714 | $15,087 | $18,092 | $18,461 | $18,438 | $19,179 | $20,213 | $20,300 | $20,628 | $20,718 | |
| Direct Cost of Sales | Month 1 | Month 2 | Month 3 | Month 4 | Month 5 | Month 6 | Month 7 | Month 8 | Month 9 | Month 10 | Month 11 | Month 12 | |
| Technology companies | $0 | $0 | $0 | $0 | $0 | $0 | $0 | $0 | $0 | $0 | $0 | $0 | |
| Public Interest organizations | $0 | $0 | $0 | $0 | $0 | $0 | $0 | $0 | $0 | $0 | $0 | $0 | |
| Subtotal Direct Cost of Sales | $0 | $0 | $0 | $0 | $0 | $0 | $0 | $0 | $0 | $0 | $0 | $0 | |
| Personnel Plan | |||||||||||||
| Month 1 | Month 2 | Month 3 | Month 4 | Month 5 | Month 6 | Month 7 | Month 8 | Month 9 | Month 10 | Month 11 | Month 12 | ||
| Richard | 0% | $5,500 | $5,500 | $5,500 | $5,500 | $5,500 | $5,500 | $5,500 | $5,500 | $5,500 | $5,500 | $5,500 | $5,500 |
| Receptionist/ secretary | 0% | $0 | $1,050 | $1,050 | $1,050 | $1,050 | $1,050 | $1,050 | $1,050 | $1,050 | $1,050 | $1,050 | $1,050 |
| Paralegal | 0% | $0 | $2,000 | $2,000 | $2,000 | $2,000 | $2,000 | $2,000 | $2,000 | $2,000 | $2,000 | $2,000 | $2,000 |
| Law clerk | 0% | $0 | $0 | $0 | $900 | $900 | $900 | $900 | $900 | $900 | $900 | $900 | $900 |
| Law clerk | 0% | $0 | $0 | $0 | $0 | $0 | $0 | $0 | $900 | $900 | $900 | $900 | $900 |
| Total People | 1 | 3 | 3 | 4 | 4 | 4 | 4 | 5 | 5 | 5 | 5 | 5 | |
| Total Payroll | $5,500 | $8,550 | $8,550 | $9,450 | $9,450 | $9,450 | $9,450 | $10,350 | $10,350 | $10,350 | $10,350 | $10,350 | |
| General Assumptions | |||||||||||||
| Month 1 | Month 2 | Month 3 | Month 4 | Month 5 | Month 6 | Month 7 | Month 8 | Month 9 | Month 10 | Month 11 | Month 12 | ||
| Plan Month | 1 | 2 | 3 | 4 | 5 | 6 | 7 | 8 | 9 | 10 | 11 | 12 | |
| Current Interest Rate | 10.00% | 10.00% | 10.00% | 10.00% | 10.00% | 10.00% | 10.00% | 10.00% | 10.00% | 10.00% | 10.00% | 10.00% | |
| Long-term Interest Rate | 10.00% | 10.00% | 10.00% | 10.00% | 10.00% | 10.00% | 10.00% | 10.00% | 10.00% | 10.00% | 10.00% | 10.00% | |
| Tax Rate | 30.00% | 25.00% | 25.00% | 25.00% | 25.00% | 25.00% | 25.00% | 25.00% | 25.00% | 25.00% | 25.00% | 25.00% | |
| Other | 0 | 0 | 0 | 0 | 0 | 0 | 0 | 0 | 0 | 0 | 0 | 0 | |
| Pro Forma Profit and Loss | |||||||||||||
| Month 1 | Month 2 | Month 3 | Month 4 | Month 5 | Month 6 | Month 7 | Month 8 | Month 9 | Month 10 | Month 11 | Month 12 | ||
| Sales | $0 | $9,105 | $10,714 | $15,087 | $18,092 | $18,461 | $18,438 | $19,179 | $20,213 | $20,300 | $20,628 | $20,718 | |
| Direct Cost of Sales | $0 | $0 | $0 | $0 | $0 | $0 | $0 | $0 | $0 | $0 | $0 | $0 | |
| Other | $0 | $0 | $0 | $0 | $0 | $0 | $0 | $0 | $0 | $0 | $0 | $0 | |
| Total Cost of Sales | $0 | $0 | $0 | $0 | $0 | $0 | $0 | $0 | $0 | $0 | $0 | $0 | |
| Gross Margin | $0 | $9,105 | $10,714 | $15,087 | $18,092 | $18,461 | $18,438 | $19,179 | $20,213 | $20,300 | $20,628 | $20,718 | |
| Gross Margin % | 0.00% | 100.00% | 100.00% | 100.00% | 100.00% | 100.00% | 100.00% | 100.00% | 100.00% | 100.00% | 100.00% | 100.00% | |
| Expenses | |||||||||||||
| Payroll | $5,500 | $8,550 | $8,550 | $9,450 | $9,450 | $9,450 | $9,450 | $10,350 | $10,350 | $10,350 | $10,350 | $10,350 | |
| Sales and Marketing and Other Expenses | $180 | $180 | $180 | $180 | $180 | $180 | $180 | $180 | $180 | $180 | $180 | $180 | |
| Depreciation | $139 | $139 | $139 | $139 | $139 | $139 | $139 | $139 | $139 | $139 | $139 | $139 | |
| Leased Equipment | $0 | $0 | $0 | $0 | $0 | $0 | $0 | $0 | $0 | $0 | $0 | $0 | |
| Utilities | $125 | $125 | $125 | $125 | $125 | $125 | $125 | $125 | $125 | $125 | $125 | $125 | |
| Rent | $200 | $200 | $200 | $200 | $200 | $200 | $200 | $200 | $200 | $200 | $200 | $200 | |
| Payroll Taxes | 15% | $825 | $1,283 | $1,283 | $1,418 | $1,418 | $1,418 | $1,418 | $1,553 | $1,553 | $1,553 | $1,553 | $1,553 |
| Other | $0 | $0 | $0 | $0 | $0 | $0 | $0 | $0 | $0 | $0 | $0 | $0 | |
| Total Operating Expenses | $6,969 | $10,477 | $10,477 | $11,512 | $11,512 | $11,512 | $11,512 | $12,547 | $12,547 | $12,547 | $12,547 | $12,547 | |
| Profit Before Interest and Taxes | ($6,969) | ($1,372) | $238 | $3,576 | $6,581 | $6,950 | $6,927 | $6,633 | $7,667 | $7,754 | $8,082 | $8,172 | |
| EBITDA | ($6,830) | ($1,233) | $377 | $3,715 | $6,720 | $7,089 | $7,066 | $6,772 | $7,806 | $7,893 | $8,221 | $8,311 | |
| Interest Expense | $0 | $0 | $0 | $0 | $0 | $0 | $0 | $0 | $0 | $0 | $0 | $0 | |
| Taxes Incurred | ($2,091) | ($343) | $59 | $894 | $1,645 | $1,737 | $1,732 | $1,658 | $1,917 | $1,938 | $2,020 | $2,043 | |
| Net Profit | ($4,878) | ($1,029) | $178 | $2,682 | $4,935 | $5,212 | $5,195 | $4,974 | $5,750 | $5,815 | $6,061 | $6,129 | |
| Net Profit/Sales | 0.00% | -11.30% | 1.66% | 17.77% | 27.28% | 28.23% | 28.17% | 25.94% | 28.45% | 28.65% | 29.38% | 29.58% | |
| Pro Forma Cash Flow | |||||||||||||
| Month 1 | Month 2 | Month 3 | Month 4 | Month 5 | Month 6 | Month 7 | Month 8 | Month 9 | Month 10 | Month 11 | Month 12 | ||
| Cash Received | |||||||||||||
| Cash from Operations | |||||||||||||
| Cash Sales | $0 | $2,276 | $2,679 | $3,772 | $4,523 | $4,615 | $4,610 | $4,795 | $5,053 | $5,075 | $5,157 | $5,180 | |
| Cash from Receivables | $0 | $0 | $228 | $6,869 | $8,145 | $11,390 | $13,578 | $13,845 | $13,847 | $14,410 | $15,162 | $15,233 | |
| Subtotal Cash from Operations | $0 | $2,276 | $2,906 | $10,641 | $12,668 | $16,006 | $18,188 | $18,640 | $18,900 | $19,485 | $20,319 | $20,413 | |
| Additional Cash Received | |||||||||||||
| Sales Tax, VAT, HST/GST Received | 0.00% | $0 | $0 | $0 | $0 | $0 | $0 | $0 | $0 | $0 | $0 | $0 | $0 |
| New Current Borrowing | $0 | $0 | $0 | $0 | $0 | $0 | $0 | $0 | $0 | $0 | $0 | $0 | |
| New Other Liabilities (interest-free) | $0 | $0 | $0 | $0 | $0 | $0 | $0 | $0 | $0 | $0 | $0 | $0 | |
| New Long-term Liabilities | $0 | $0 | $0 | $0 | $0 | $0 | $0 | $0 | $0 | $0 | $0 | $0 | |
| Sales of Other Current Assets | $0 | $0 | $0 | $0 | $0 | $0 | $0 | $0 | $0 | $0 | $0 | $0 | |
| Sales of Long-term Assets | $0 | $0 | $0 | $0 | $0 | $0 | $0 | $0 | $0 | $0 | $0 | $0 | |
| New Investment Received | $0 | $0 | $0 | $0 | $0 | $0 | $0 | $0 | $0 | $0 | $0 | $0 | |
| Subtotal Cash Received | $0 | $2,276 | $2,906 | $10,641 | $12,668 | $16,006 | $18,188 | $18,640 | $18,900 | $19,485 | $20,319 | $20,413 | |
| Expenditures | Month 1 | Month 2 | Month 3 | Month 4 | Month 5 | Month 6 | Month 7 | Month 8 | Month 9 | Month 10 | Month 11 | Month 12 | |
| Expenditures from Operations | |||||||||||||
| Cash Spending | $5,500 | $8,550 | $8,550 | $9,450 | $9,450 | $9,450 | $9,450 | $10,350 | $10,350 | $10,350 | $10,350 | $10,350 | |
| Bill Payments | ($761) | ($687) | $1,458 | $1,879 | $2,841 | $3,571 | $3,660 | $3,656 | $3,724 | $3,975 | $3,999 | $4,079 | |
| Subtotal Spent on Operations | $4,739 | $7,863 | $10,008 | $11,329 | $12,291 | $13,021 | $13,110 | $14,006 | $14,074 | $14,325 | $14,349 | $14,429 | |
| Additional Cash Spent | |||||||||||||
| Sales Tax, VAT, HST/GST Paid Out | $0 | $0 | $0 | $0 | $0 | $0 | $0 | $0 | $0 | $0 | $0 | $0 | |
| Principal Repayment of Current Borrowing | $0 | $0 | $0 | $0 | $0 | $0 | $0 | $0 | $0 | $0 | $0 | $0 | |
| Other Liabilities Principal Repayment | $0 | $0 | $0 | $0 | $0 | $0 | $0 | $0 | $0 | $0 | $0 | $0 | |
| Long-term Liabilities Principal Repayment | $0 | $0 | $0 | $0 | $0 | $0 | $0 | $0 | $0 | $0 | $0 | $0 | |
| Purchase Other Current Assets | $0 | $0 | $0 | $0 | $0 | $0 | $0 | $0 | $0 | $0 | $0 | $0 | |
| Purchase Long-term Assets | $0 | $0 | $0 | $0 | $0 | $0 | $0 | $0 | $0 | $0 | $0 | $0 | |
| Dividends | $0 | $0 | $0 | $0 | $0 | $0 | $0 | $0 | $0 | $0 | $0 | $0 | |
| Subtotal Cash Spent | $4,739 | $7,863 | $10,008 | $11,329 | $12,291 | $13,021 | $13,110 | $14,006 | $14,074 | $14,325 | $14,349 | $14,429 | |
| Net Cash Flow | ($4,739) | ($5,587) | ($7,102) | ($688) | $376 | $2,985 | $5,078 | $4,634 | $4,826 | $5,160 | $5,970 | $5,984 | |
| Cash Balance | $14,011 | $8,424 | $1,322 | $634 | $1,010 | $3,995 | $9,073 | $13,707 | $18,533 | $23,693 | $29,663 | $35,648 | |
| Pro Forma Balance Sheet | |||||||||||||
| Month 1 | Month 2 | Month 3 | Month 4 | Month 5 | Month 6 | Month 7 | Month 8 | Month 9 | Month 10 | Month 11 | Month 12 | ||
| Assets | Starting Balances | ||||||||||||
| Current Assets | |||||||||||||
| Cash | $18,750 | $14,011 | $8,424 | $1,322 | $634 | $1,010 | $3,995 | $9,073 | $13,707 | $18,533 | $23,693 | $29,663 | $35,648 |
| Accounts Receivable | $0 | $0 | $6,829 | $14,637 | $19,083 | $24,507 | $26,962 | $27,213 | $27,752 | $29,065 | $29,879 | $30,188 | $30,494 |
| Other Current Assets | $0 | $0 | $0 | $0 | $0 | $0 | $0 | $0 | $0 | $0 | $0 | $0 | $0 |
| Total Current Assets | $18,750 | $14,011 | $15,253 | $15,959 | $19,717 | $25,517 | $30,958 | $36,286 | $41,459 | $47,597 | $53,573 | $59,852 | $66,141 |
| Long-term Assets | |||||||||||||
| Long-term Assets | $5,000 | $5,000 | $5,000 | $5,000 | $5,000 | $5,000 | $5,000 | $5,000 | $5,000 | $5,000 | $5,000 | $5,000 | $5,000 |
| Accumulated Depreciation | $0 | $139 | $278 | $417 | $556 | $695 | $834 | $973 | $1,112 | $1,251 | $1,390 | $1,529 | $1,668 |
| Total Long-term Assets | $5,000 | $4,861 | $4,722 | $4,583 | $4,444 | $4,305 | $4,166 | $4,027 | $3,888 | $3,749 | $3,610 | $3,471 | $3,332 |
| Total Assets | $23,750 | $18,872 | $19,975 | $20,542 | $24,161 | $29,822 | $35,124 | $40,313 | $45,347 | $51,346 | $57,183 | $63,323 | $69,473 |
| Liabilities and Capital | Month 1 | Month 2 | Month 3 | Month 4 | Month 5 | Month 6 | Month 7 | Month 8 | Month 9 | Month 10 | Month 11 | Month 12 | |
| Current Liabilities | |||||||||||||
| Accounts Payable | $0 | $0 | $2,132 | $2,521 | $3,458 | $4,184 | $4,273 | $4,268 | $4,327 | $4,577 | $4,598 | $4,677 | $4,699 |
| Current Borrowing | $0 | $0 | $0 | $0 | $0 | $0 | $0 | $0 | $0 | $0 | $0 | $0 | $0 |
| Other Current Liabilities | $0 | $0 | $0 | $0 | $0 | $0 | $0 | $0 | $0 | $0 | $0 | $0 | $0 |
| Subtotal Current Liabilities | $0 | $0 | $2,132 | $2,521 | $3,458 | $4,184 | $4,273 | $4,268 | $4,327 | $4,577 | $4,598 | $4,677 | $4,699 |
| Long-term Liabilities | $0 | $0 | $0 | $0 | $0 | $0 | $0 | $0 | $0 | $0 | $0 | $0 | $0 |
| Total Liabilities | $0 | $0 | $2,132 | $2,521 | $3,458 | $4,184 | $4,273 | $4,268 | $4,327 | $4,577 | $4,598 | $4,677 | $4,699 |
| Paid-in Capital | $25,000 | $25,000 | $25,000 | $25,000 | $25,000 | $25,000 | $25,000 | $25,000 | $25,000 | $25,000 | $25,000 | $25,000 | $25,000 |
| Retained Earnings | ($1,250) | ($1,250) | ($1,250) | ($1,250) | ($1,250) | ($1,250) | ($1,250) | ($1,250) | ($1,250) | ($1,250) | ($1,250) | ($1,250) | ($1,250) |
| Earnings | $0 | ($4,878) | ($5,907) | ($5,729) | ($3,047) | $1,888 | $7,100 | $12,295 | $17,270 | $23,019 | $28,835 | $34,896 | $41,024 |
| Total Capital | $23,750 | $18,872 | $17,843 | $18,021 | $20,703 | $25,638 | $30,850 | $36,045 | $41,020 | $46,769 | $52,585 | $58,646 | $64,774 |
| Total Liabilities and Capital | $23,750 | $18,872 | $19,975 | $20,542 | $24,161 | $29,822 | $35,124 | $40,313 | $45,347 | $51,346 | $57,183 | $63,323 | $69,473 |
| Net Worth | $23,750 | $18,872 | $17,843 | $18,021 | $20,703 | $25,638 | $30,850 | $36,045 | $41,020 | $46,769 | $52,585 | $58,646 | $64,774 |

