
Fargo Medical Laboratories
Executive Summary
Fargo Medical Laboratories (FML) is a start-up company committed to providing the most convenient, friendliest blood testing service to the physicians of the Main Street Professional Building and the surrounding area. Fargo Medical Laboratories has been founded as a single member L.L.C. registered in North Dakota by Dave Gigsted. Fargo Medical Laboratories will quickly gain market share serving the Fargo medical community.
Objectives
Fargo Medical Laboratories has established three significant objectives to pursue. The first is securing 60% of the physicians in the Main Street Professional Building as customers. The second objective is to develop 20% of their revenue from physicians who practice in the nearby vicinity. The third objective is the desire to reach profitability with 12 months. This is especially important since Fargo Medical Laboratories will be using bank debt would like to see a positive ROI fairly soon.
Market
Fargo Medical Laboratories has identified two market segments they will serve. First is the large number of physicians that have a practice in the Main Street Professional Building, where Fargo Medical Laboratories will lease space. This customer segment has 128 potential customers with a growth rate of 3%. The second group is physicians that have medical practices in other nearby facilities. There are 115 potential customers in this segment with a 5% annual growth rate.
Services
Fargo Medical Laboratories offers a comprehensive battery of blood tests for physician’s patients. Several tests will be done in-house including:
- CBC- A complete test of red blood cell count, white blood count, and a platelet count. Each of these three can be ordered individually if needed.
- Blood sugar test- Frequently requested for diabetics or possible diabetics.
- Electrolyte testing- For patients who are on diuretics and there is concern that they may be losing too many of their electrolytes.
- Creatine- Often used to check kidney functioning or to determine if there is heart or kidney problems.
Other types of blood analysis can be done with the specimen sent to a central lab for testing.
Management
Fargo Medical Laboratories has been founded and will be led by Dave Gigsted. Dave received an undergraduate degree in small business management. After graduation Dave got his laboratory technician certification and went to work for a laboratory. He was eventually elevated to lab manager, staying with the lab for five years.
Dave then moved with his wife to Fargo where he worked for a year in a lab. Surveying the business environment with the thought of opening up his own blood laboratory, he recognized the great need for a lab in the Main Street Professional Building, and developed a plan and secured financing for the venture.
1.1 Objectives
- To gain 60% of the Professional Building’s blood testing work.
- Develop 20% of the revenues from offices outside the Professional Building.
- Reach profitability within 12 months.
1.2 Mission
It is Fargo Medical Laboratories’ mission to serve local physicians with fast, accurate, private, reasonably priced blood testing services. Fargo Medical Laboratories exists to exceed all of their customer’s expectations.
1.3 Keys to Success
- Lease space in the Main Street Professional Building, the location of our primary target market.
- Set up a strong contract with a large local laboratory to outsource the more difficult tests, ensuring fast service and good rates.
- Follow a strict regime of accounting controls to help ensure profitability.

Company Summary
Fargo Medical Laboratories has been formed as an L.L.C., registered in North Dakota. Fargo Medical Laboratories is a single member entity owned by Dave Gigsted. Fargo Medical Laboratories will lease office space in the Main Street Professional Building. This building has over 120 offices, 93 of which are leased by medical professionals. Of the 93, a high percentage of those are primary care physicians or general practitioners. There currently is no laboratory within this professional building, and doctors are forced to send their patients across town to have blood drawn and analyzed.
2.1 Company Ownership
The owner of Fargo Medical Laboratories is Dave Gigsted. Dave has received bank debt financing and will have a long term loan to pay off.
2.2 Start-up Summary
Fargo Medical Laboratories will require the following equipment for the start up of the business:
- Waiting room furniture
- Two computers with QuickBooks Pro, Microsoft Office, and insurance billing software, sharing a laser printer and a broadband Internet connection.
- Five portable ice coolers.
- Four chairs for the blood drawing rooms.
- Latex gloves, syringes, needles.
- Autoanalyzer.
- Complete blood testing machine.
- Centrifuge.
- Refrigerator/freezer unit.

| Start-up Funding | |
| Start-up Expenses to Fund | $5,000 |
| Start-up Assets to Fund | $165,000 |
| Total Funding Required | $170,000 |
| Assets | |
| Non-cash Assets from Start-up | $73,000 |
| Cash Requirements from Start-up | $92,000 |
| Additional Cash Raised | $0 |
| Cash Balance on Starting Date | $92,000 |
| Total Assets | $165,000 |
| Liabilities and Capital | |
| Liabilities | |
| Current Borrowing | $0 |
| Long-term Liabilities | $170,000 |
| Accounts Payable (Outstanding Bills) | $0 |
| Other Current Liabilities (interest-free) | $0 |
| Total Liabilities | $170,000 |
| Capital | |
| Planned Investment | |
| Investor 1 | $0 |
| Investor 2 | $0 |
| Other | $0 |
| Additional Investment Requirement | $0 |
| Total Planned Investment | $0 |
| Loss at Start-up (Start-up Expenses) | ($5,000) |
| Total Capital | ($5,000) |
| Total Capital and Liabilities | $165,000 |
| Total Funding | $170,000 |
| Start-up | |
| Requirements | |
| Start-up Expenses | |
| Legal | $1,000 |
| Stationery etc. | $0 |
| Brochures | $500 |
| Consultants | $0 |
| Insurance | $500 |
| Rent | $1,000 |
| Research and Development | $0 |
| Expensed Equipment | $2,000 |
| Other | $0 |
| Total Start-up Expenses | $5,000 |
| Start-up Assets | |
| Cash Required | $92,000 |
| Other Current Assets | $0 |
| Long-term Assets | $73,000 |
| Total Assets | $165,000 |
| Total Requirements | $170,000 |
Services
Fargo Medical Laboratories offers routine blood tests on-site and more complex blood tests outsourced to a central lab. FML will be located inside the Main Street Professional Building which is home to numerous physicians. Currently, when the doctors need blood work done, they have to send their patients to an off-site laboratory, a 15 minute drive from the doctor’s office.
Once Fargo Medical Laboratories is up an running the doctors will be able to send their patients to FML’s offices, within the building. For simple tests Fargo Medical Laboratories will do the analysis in-house, for more complex blood work the specimens will be sent to an outsourced central laboratory.
The advantages to the physicians and their patients include: convenience (blood can be drawn within the same building), and faster service (there is no driving or transportation time to get the blood drawn), and for the most commonly requested tests the analysis occurs in-house guaranteeing results within 24 hours.
Fargo Medical Laboratories will offer the following tests in-house:
- Red blood cell count- $15
- White blood cell count- $15
- CBC (a more complete test that counts platelets in addition to white and red blood cell counts)- $30
- Blood sugar (suited for diabetics or people who are trying to determine if they have a blood sugar problem)- $15
- Electrolytes (for people on diuretics)- $20
- Creatine (tests for heart or kidney difficulties)- $15
If more extensive blood work is needed, blood with be drawn in our offices and sent to a central laboratory. Fargo Medical Laboratories will use a courier service that transports the samples in an ice cooler. The specimens are tested within 24-36 hours of receipt at the central lab and the results are returned to FML via encrypted email.
Market Analysis Summary
Fargo Medical Laboratories has identified two market segments. The first segment is the physicians that practice within the same professional building as FML. The second group is comprised of physicians that practice in the surrounding area.

4.1 Market Segmentation
Fargo Medical Laboratories will provide services geared to two distinct customer segments.
- Main Street Professional Building physicians– This segment is made up of physicians that practice medicine in offices that are located within the Main Street Professional Building. There is a wide range of specialties represented, but predominantly primary care and general practitioners. Most types of doctors need blood work done on their patients with some regularity. The Main Street physicians have always just had to send their patients to another area of town to have blood drawn and analyzed. This is not convenient for their patients and is time consuming, so physicians in the building would generally be quite happy if there were a blood laboratory within the building.
- Nearby physicians– These physicians practice near the Main Street Professional Building. These doctors also have to send their patients out to a different location to have blood work done. Fargo Medical Laboratories’ services would be attractive to this group because FML would be located closer to their offices than the blood lab currently used. The advantage to this group of physicians would also be convenience.

| Market Analysis | |||||||
| Year 1 | Year 2 | Year 3 | Year 4 | Year 5 | |||
| Potential Customers | Growth | CAGR | |||||
| Main Street building physicians | 3% | 128 | 132 | 136 | 140 | 144 | 2.99% |
| Nearby physicians | 5% | 115 | 121 | 127 | 133 | 140 | 5.04% |
| Total | 3.97% | 243 | 253 | 263 | 273 | 284 | 3.97% |
4.2 Target Market Segment Strategy
It is fairly intuitive as to why physicians within the Main Street Professional Building will be targeted, they are the customers who would have the most demand for Fargo Medical Laboratories’ services. Almost all types of doctors regularly have patients who need blood testing done. Assuming that the lab accepts most of the common types of medical insurance, the lab is generally chosen by being the most convenient for the patient since they are the ones who must travel to the lab to have the blood drawn.
For physicians who work within the Main Street Professional Building, Fargo Medical Laboratories would be the most convenient laboratory, being located within the same building as the physician’s offices. No longer would the doctor have to ask the patient to travel to have blood drawn. For the second target market, the nearby physicians, the reasoning is similar, convenience for the patients. While it is not quite as convenient as sending the patient to another office within the same building, Fargo Medical Laboratories would still be closer than the current lab.
4.3 Service Business Analysis
Blood laboratories all provide similar services. Most accept a wide range of insurance plans. Some do the tests in-house, others will outsource the tests. Where the tests are completed is not really that significant. To be competitive the labs need to have the tests completed within a couple of days at the most. This means it all comes down to convenience. Labs serve the physicians and doctors that are closest in terms of geographic proximity. In most cities/towns, you will see labs placed throughout the city serving the different clusters of physicians.
Fargo is different, or at least Main Street is. Main Street Professional Building has for years been trying to have a laboratory locate within the building to serve the large population of doctors. The trouble has been that South Dakota is experiencing an exodus of people. As college students have completed school, they have left the state. Fargo has had difficulty attracting qualified technical people, in this instance phlebotomists (blood drawing technicians) and chemical analyzers. This is the explanation for the absence of a blood laboratory in the Main Street Professional Building. The need has existed, just no one has “stepped up to the plate”, at least not until now.
4.3.1 Competition and Buying Patterns
In Fargo, there is a total of seven blood drawing laboratories. Of the seven, two only serve their specific clients and do not do work for other physicians. Of the remaining five, three offer basic tests done on-site, like Fargo Medical Laboratories, and the remaining two are full service laboratories that do work complex for the other labs.
The closest competitor to Fargo Medical Laboratories is Mednet, located four miles away. This is the facility that 95% of the physicians in the Main Street Professional Building currently use. It is used by these physicians because of convenience, it WAS the closest laboratory. As mentioned earlier, blood testing service providers are chosen based on convenience, how close they are to the patients. Hours of operation (i.e. longer hours/evening hours) are insignificant since physicians are only available during traditional daytime office hours.
Strategy and Implementation Summary
Fargo Medical Laboratories will leverage their competitive edge of a convenient location within a large medical facility to help it quickly gain market share. FML has developed a strategic marketing plan that will use several different methods to develop local awareness of itself and the benefits offered. Fargo Medical Laboratories has also developed a sales strategy to help turn the qualified leads into clients by emphasizing the significant benefits that physicians can offer their patients by sending them to Fargo Medical Laboratories. Sections 5.1-5.3 offers more detail regarding the competitive edge, marketing and sales strategies.
5.1 Competitive Edge
Fargo Medical Laboratories’ competitive edge is convenience. In the blood analysis industry it is hard to differentiate yourself from competitors assuming a few basic levels of care and performance:
- You accept several popular insurance plans, otherwise many patients could not use your service.
- You provide fast analysis, tests are completed and reported within 48-60 hours at the most.
- You provide accurate, precise results.
If these basic, foundational levels of performance are met, then you are competitive. This is why convenience is so important and why it is an effective way of distinguishing one lab from another. The physician is looking for a way to get a blood sample from a patient that is easiest from the patient’s perspective.
Other factors include maintaining a high level of customer satisfaction. If these were not met it would not “kill the deal” but would decrease sales. Here are some important customer service elements that all employees of Fargo Medical Laboratories will emphasize:
- The receptionists and phlebotomists are friendly.
- A satisfactory specimen is secured on the first try.
- Patient discomfort is minimized.
- The phlebotomist was able to personify the laboratory and promote a positive impression between the lab and the patient.
These customer service factors will certainly be taught to all employees to ensure the most positive patient experience.
5.2 Marketing Strategy
Fargo Medical Laboratories will undertake a marketing strategy employing three means of communicating its new service offering:
- Direct mail. Local physicians will receive a flyer announcing the opening of Fargo Medical Laboratories and detailing the services offered. A list of physicians is easily obtained through the local licensing board.
- Personal introductions to Main Street Professional Building tenants. A representative from Fargo Medical Laboratories will visit all of the medical offices within the building as a way of introducing FML to the doctors. This will provide FML with an opportunity to develop a personal relationship with doctors, something that is useful and valuable for service providers within a licensed industry.
- Advertisements. Ads will be placed in the regional flyer that all licensed physicians receive as members of their local chapter of the American Medical Association (AMA).
5.3 Sales Strategy
Fargo Medical Laboratories’ sales strategy will be used to convert a qualified lead into a client by emphasizing three important services:
- Most forms of insurance accepted– This is important because the vast number of patients that will have their blood tested will not be self-paying, they will be using insurance. FML would not be a viable alternative if they did not accept popular insurance plans.
- Quick turnaround– A doctor’s diagnosis and treatment is often based on the results of the test. It is not reasonable to expect the patient to wait an excessive period of time for the results. Fargo Medical Laboratories will deliver results fast.
- Convenience– There is no other alternative that is more convenient than sending the patients to an office within the building.
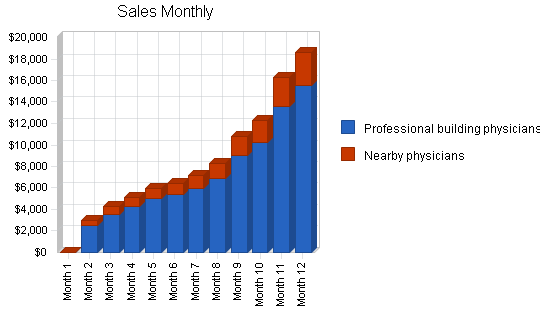
5.3.1 Sales Forecast
Fargo Medical Laboratories had developed a conservative sales forecast for the three years of this business plan. A conservative forecast was chosen because the venture is being funded by bank debt, which is fairly risk-averse, and therefore, it is in Fargo Medical Laboratories’ best interests if they are able to meet the monthly sales goals. If the forecast was more aggressive it would be far easier for FML to miss sales targets and find themselves hurting financially due to inaccurate assumptions and forecasts. This would then cast doubt on the survival of the business.

| Sales Forecast | |||
| Year 1 | Year 2 | Year 3 | |
| Sales | |||
| Professional building physicians | $81,778 | $210,545 | $232,545 |
| Nearby physicians | $16,356 | $42,109 | $46,509 |
| Total Sales | $98,134 | $252,654 | $279,054 |
| Direct Cost of Sales | Year 1 | Year 2 | Year 3 |
| Professional building physicians | $28,622 | $73,691 | $81,391 |
| Nearby physicians | $5,724 | $14,738 | $16,278 |
| Subtotal Direct Cost of Sales | $34,347 | $88,429 | $97,669 |
5.4 Milestones
Fargo Medical Laboratories has identified several milestones for the organization to achieve. The achievement of the milestones will be instrumental in the success of the the venture. By enumerating the milestones it provides the organization with clear goals that everyone can focus their energy on.

| Milestones | |||||
| Milestone | Start Date | End Date | Budget | Manager | Department |
| Completion of business plan | 1/1/2003 | 2/1/2003 | $0 | Dave | Business development |
| Secure lease | 1/1/2003 | 2/15/2003 | $0 | Dave | Operations |
| Conversion of 50% of in-house drs into customers | 2/15/2003 | 10/15/2003 | $0 | Dave | Sales |
| Profitability | 10/15/2003 | 12/15/2003 | $0 | Dave | Everyone |
| Revenue of $100,000 | 12/15/2003 | 2/1/2004 | $0 | Dave | Sales |
| Totals | $0 | ||||
Management Summary
Dave Gigsted is the founder and manager of Fargo Medical Laboratories. Dave received his undergraduate degree in Small Business Management from the University of Illinois. While in college, Dave worked at a bicycle shop, initially as a mechanic, moving up to assistant manager by the time he graduated. This provided him with hands-on business experience to combine with his business degree.
Upon graduation, Dave began his job search, including opportunities in the medical profession. His mother and aunt are both registered nurses who shared with Dave that, at that time in Illinois, lab technicians were in short supply. So Dave enrolled in an eight-month program through the community college for a degree in Laboratory Technology. After completing this degree, Dave went to work at a laboratory. Within two years, he had been promoted to Lab Manager. Dave found this work challenging, enjoyed the medical aspect and worked hard in the business end of the job.
After five years, Dave and his wife moved to Fargo for a job opportunity for his wife. He immediately began working at a laboratory and worked there for a year. During this time Dave began looking into different business opportunities, recognizing that he had now developed sufficient business skills to operate his own business. Dave found there was a high concentration of physicians in a professional building with no nearby lab. In talking with people, he learned the physicians were looking for a lab to relocate to the building but but had been unable to find any. Armed with this information, Dave began to draft a business plan confident that with a solid strategy and comprehensive plan he would be able to find financing and begin his new venture.
6.1 Personnel Plan
- Dave will handle business development, sales, marketing, accounting, courier, customer service, and assorted lab tech work.
- Two phlebotomists on staff at any one time to draw blood
- One Lab technician will be responsible for doing onsite blood tests. This will be a part-time position. Dave will be able to fill in as needed in this capacity
| Personnel Plan | |||
| Year 1 | Year 2 | Year 3 | |
| Dave | $22,000 | $28,000 | $32,000 |
| Phlebotomist | $16,500 | $18,000 | $18,000 |
| Phlebotomist | $15,000 | $18,000 | $18,000 |
| Lab technician | $22,000 | $24,000 | $24,000 |
| Total People | 4 | 4 | 4 |
| Total Payroll | $75,500 | $88,000 | $92,000 |
Financial Plan
The following sections will outline important financial information.
7.1 Important Assumptions
The following table includes important financial assumptions.
| General Assumptions | |||
| Year 1 | Year 2 | Year 3 | |
| Plan Month | 1 | 2 | 3 |
| Current Interest Rate | 10.00% | 10.00% | 10.00% |
| Long-term Interest Rate | 10.00% | 10.00% | 10.00% |
| Tax Rate | 30.00% | 30.00% | 30.00% |
| Other | 0 | 0 | 0 |
7.2 Break-even Analysis
The Break-even Analysis indicates what will be needed in monthly revenue to reach the break even point.

| Break-even Analysis | |
| Monthly Revenue Break-even | $15,388 |
| Assumptions: | |
| Average Percent Variable Cost | 35% |
| Estimated Monthly Fixed Cost | $10,002 |
7.3 Business Ratios
The following chart provides business ratios for Fargo Medical Laboratories as well as for the blood-related health industry, SIC Code 8099.01. Fargo Medical Laboratories’ ratios are consistent with the industry, with the exception of liabilities because it is a start-up organization that is relying on financing for its start-up costs.
| Ratio Analysis | ||||
| Year 1 | Year 2 | Year 3 | Industry Profile | |
| Sales Growth | 0.00% | 157.46% | 10.45% | 7.73% |
| Percent of Total Assets | ||||
| Accounts Receivable | 28.45% | 57.95% | 60.94% | 28.59% |
| Other Current Assets | 0.00% | 0.00% | 0.00% | 42.01% |
| Total Current Assets | 35.47% | 61.72% | 75.71% | 72.68% |
| Long-term Assets | 64.53% | 38.28% | 24.29% | 27.32% |
| Total Assets | 100.00% | 100.00% | 100.00% | 100.00% |
| Current Liabilities | 11.14% | 10.18% | 10.66% | 36.54% |
| Long-term Liabilities | 174.60% | 127.62% | 111.54% | 22.81% |
| Total Liabilities | 185.74% | 137.80% | 122.20% | 59.35% |
| Net Worth | -85.74% | -37.80% | -22.20% | 40.65% |
| Percent of Sales | ||||
| Sales | 100.00% | 100.00% | 100.00% | 100.00% |
| Gross Margin | 65.00% | 65.00% | 65.00% | 100.00% |
| Selling, General & Administrative Expenses | 138.75% | 61.53% | 58.82% | 81.83% |
| Advertising Expenses | 0.00% | 0.00% | 0.00% | 1.10% |
| Profit Before Interest and Taxes | -57.31% | 10.73% | 13.50% | 0.61% |
| Main Ratios | ||||
| Current | 3.18 | 6.06 | 7.10 | 1.64 |
| Quick | 3.18 | 6.06 | 7.10 | 1.32 |
| Total Debt to Total Assets | 185.74% | 137.80% | 122.20% | 0.81% |
| Pre-tax Return on Net Worth | 93.56% | -27.56% | -88.79% | 66.74% |
| Pre-tax Return on Assets | -80.22% | 10.42% | 19.71% | 2.43% |
| Additional Ratios | Year 1 | Year 2 | Year 3 | |
| Net Profit Margin | -73.97% | 3.30% | 5.94% | n.a |
| Return on Equity | 0.00% | 0.00% | 0.00% | n.a |
| Activity Ratios | ||||
| Accounts Receivable Turnover | 2.86 | 2.86 | 2.86 | n.a |
| Collection Days | 54 | 89 | 122 | n.a |
| Accounts Payable Turnover | 7.99 | 12.17 | 12.17 | n.a |
| Payment Days | 27 | 28 | 29 | n.a |
| Total Asset Turnover | 1.08 | 2.21 | 2.32 | n.a |
| Debt Ratios | ||||
| Debt to Net Worth | 0.00 | 0.00 | 0.00 | n.a |
| Current Liab. to Liab. | 0.06 | 0.07 | 0.09 | n.a |
| Liquidity Ratios | ||||
| Net Working Capital | $22,012 | $58,961 | $78,141 | n.a |
| Interest Coverage | -3.44 | 1.78 | 2.69 | n.a |
| Additional Ratios | ||||
| Assets to Sales | 0.92 | 0.45 | 0.43 | n.a |
| Current Debt/Total Assets | 11% | 10% | 11% | n.a |
| Acid Test | 0.63 | 0.37 | 1.38 | n.a |
| Sales/Net Worth | 0.00 | 0.00 | 0.00 | n.a |
| Dividend Payout | 0.00 | 0.00 | 0.00 | n.a |
7.4 Projected Profit and Loss
The following table will show annual projected profit and loss. A net loss will occur the first year, with well developed profit in year two and year three.


| Pro Forma Profit and Loss | |||
| Year 1 | Year 2 | Year 3 | |
| Sales | $98,134 | $252,654 | $279,054 |
| Direct Cost of Sales | $34,347 | $88,429 | $97,669 |
| Other Costs of Sales | $0 | $0 | $0 |
| Total Cost of Sales | $34,347 | $88,429 | $97,669 |
| Gross Margin | $63,787 | $164,225 | $181,385 |
| Gross Margin % | 65.00% | 65.00% | 65.00% |
| Expenses | |||
| Payroll | $75,500 | $88,000 | $92,000 |
| Sales and Marketing and Other Expenses | $2,400 | $3,000 | $3,500 |
| Depreciation | $14,604 | $14,604 | $14,604 |
| Rent | $12,000 | $13,500 | $14,500 |
| Utilities | $1,800 | $1,800 | $1,800 |
| Insurance | $2,400 | $3,000 | $3,500 |
| Payroll Taxes | $11,325 | $13,200 | $13,800 |
| Other | $0 | $0 | $0 |
| Total Operating Expenses | $120,029 | $137,104 | $143,704 |
| Profit Before Interest and Taxes | ($56,242) | $27,121 | $37,681 |
| EBITDA | ($41,638) | $41,725 | $52,285 |
| Interest Expense | $16,350 | $15,200 | $14,000 |
| Taxes Incurred | $0 | $3,576 | $7,104 |
| Net Profit | ($72,592) | $8,345 | $16,577 |
| Net Profit/Sales | -73.97% | 3.30% | 5.94% |
7.5 Projected Cash Flow
The following chart and table describe the projected cash flow. Because we will have a large starting balance because of our initial bank loan, our cash flow should be strong enough to cover our expenses as the business becomes established. The only concern will be to monitor the accounts receivable balances, since the majority of our revenue will be in receivables.

| Pro Forma Cash Flow | |||
| Year 1 | Year 2 | Year 3 | |
| Cash Received | |||
| Cash from Operations | |||
| Cash Sales | $24,533 | $63,164 | $69,764 |
| Cash from Receivables | $47,853 | $148,948 | $202,364 |
| Subtotal Cash from Operations | $72,386 | $212,112 | $272,127 |
| Additional Cash Received | |||
| Sales Tax, VAT, HST/GST Received | $0 | $0 | $0 |
| New Current Borrowing | $0 | $0 | $0 |
| New Other Liabilities (interest-free) | $0 | $0 | $0 |
| New Long-term Liabilities | $0 | $0 | $0 |
| Sales of Other Current Assets | $0 | $0 | $0 |
| Sales of Long-term Assets | $0 | $0 | $0 |
| New Investment Received | $0 | $26,000 | $0 |
| Subtotal Cash Received | $72,386 | $238,112 | $272,127 |
| Expenditures | Year 1 | Year 2 | Year 3 |
| Expenditures from Operations | |||
| Cash Spending | $75,500 | $88,000 | $92,000 |
| Bill Payments | $70,537 | $140,143 | $154,709 |
| Subtotal Spent on Operations | $146,037 | $228,143 | $246,709 |
| Additional Cash Spent | |||
| Sales Tax, VAT, HST/GST Paid Out | $0 | $0 | $0 |
| Principal Repayment of Current Borrowing | $0 | $0 | $0 |
| Other Liabilities Principal Repayment | $0 | $0 | $0 |
| Long-term Liabilities Principal Repayment | $12,000 | $12,000 | $12,000 |
| Purchase Other Current Assets | $0 | $0 | $0 |
| Purchase Long-term Assets | $0 | $0 | $0 |
| Dividends | $0 | $0 | $0 |
| Subtotal Cash Spent | $158,037 | $240,143 | $258,709 |
| Net Cash Flow | ($85,651) | ($2,031) | $13,419 |
| Cash Balance | $6,349 | $4,318 | $17,737 |
7.6 Projected Balance Sheet
The following table will indicate the projected balance sheet. We will achieve positive Net Worth in the second and third years.
| Pro Forma Balance Sheet | |||
| Year 1 | Year 2 | Year 3 | |
| Assets | |||
| Current Assets | |||
| Cash | $6,349 | $4,318 | $17,737 |
| Accounts Receivable | $25,748 | $66,290 | $73,216 |
| Other Current Assets | $0 | $0 | $0 |
| Total Current Assets | $32,097 | $70,608 | $90,953 |
| Long-term Assets | |||
| Long-term Assets | $73,000 | $73,000 | $73,000 |
| Accumulated Depreciation | $14,604 | $29,208 | $43,812 |
| Total Long-term Assets | $58,396 | $43,792 | $29,188 |
| Total Assets | $90,493 | $114,400 | $120,141 |
| Liabilities and Capital | Year 1 | Year 2 | Year 3 |
| Current Liabilities | |||
| Accounts Payable | $10,085 | $11,647 | $12,811 |
| Current Borrowing | $0 | $0 | $0 |
| Other Current Liabilities | $0 | $0 | $0 |
| Subtotal Current Liabilities | $10,085 | $11,647 | $12,811 |
| Long-term Liabilities | $158,000 | $146,000 | $134,000 |
| Total Liabilities | $168,085 | $157,647 | $146,811 |
| Paid-in Capital | $0 | $26,000 | $26,000 |
| Retained Earnings | ($5,000) | ($77,592) | ($69,247) |
| Earnings | ($72,592) | $8,345 | $16,577 |
| Total Capital | ($77,592) | ($43,247) | ($26,671) |
| Total Liabilities and Capital | $90,493 | $114,400 | $120,141 |
| Net Worth | ($77,592) | ($43,247) | ($26,671) |
Appendix
| Sales Forecast | |||||||||||||
| Month 1 | Month 2 | Month 3 | Month 4 | Month 5 | Month 6 | Month 7 | Month 8 | Month 9 | Month 10 | Month 11 | Month 12 | ||
| Sales | |||||||||||||
| Professional building physicians | 0% | $0 | $2,500 | $3,565 | $4,245 | $4,989 | $5,353 | $5,978 | $6,874 | $8,989 | $10,225 | $13,545 | $15,515 |
| Nearby physicians | 0% | $0 | $500 | $713 | $849 | $998 | $1,071 | $1,196 | $1,375 | $1,798 | $2,045 | $2,709 | $3,103 |
| Total Sales | $0 | $3,000 | $4,278 | $5,094 | $5,987 | $6,424 | $7,174 | $8,249 | $10,787 | $12,270 | $16,254 | $18,618 | |
| Direct Cost of Sales | Month 1 | Month 2 | Month 3 | Month 4 | Month 5 | Month 6 | Month 7 | Month 8 | Month 9 | Month 10 | Month 11 | Month 12 | |
| Professional building physicians | $0 | $875 | $1,248 | $1,486 | $1,746 | $1,874 | $2,092 | $2,406 | $3,146 | $3,579 | $4,741 | $5,430 | |
| Nearby physicians | $0 | $175 | $250 | $297 | $349 | $375 | $418 | $481 | $629 | $716 | $948 | $1,086 | |
| Subtotal Direct Cost of Sales | $0 | $1,050 | $1,497 | $1,783 | $2,095 | $2,248 | $2,511 | $2,887 | $3,775 | $4,295 | $5,689 | $6,516 | |
| Personnel Plan | |||||||||||||
| Month 1 | Month 2 | Month 3 | Month 4 | Month 5 | Month 6 | Month 7 | Month 8 | Month 9 | Month 10 | Month 11 | Month 12 | ||
| Dave | 0% | $0 | $2,000 | $2,000 | $2,000 | $2,000 | $2,000 | $2,000 | $2,000 | $2,000 | $2,000 | $2,000 | $2,000 |
| Phlebotomist | 0% | $0 | $1,500 | $1,500 | $1,500 | $1,500 | $1,500 | $1,500 | $1,500 | $1,500 | $1,500 | $1,500 | $1,500 |
| Phlebotomist | 0% | $0 | $0 | $1,500 | $1,500 | $1,500 | $1,500 | $1,500 | $1,500 | $1,500 | $1,500 | $1,500 | $1,500 |
| Lab technician | 0% | $0 | $2,000 | $2,000 | $2,000 | $2,000 | $2,000 | $2,000 | $2,000 | $2,000 | $2,000 | $2,000 | $2,000 |
| Total People | 0 | 3 | 4 | 4 | 4 | 4 | 4 | 4 | 4 | 4 | 4 | 4 | |
| Total Payroll | $0 | $5,500 | $7,000 | $7,000 | $7,000 | $7,000 | $7,000 | $7,000 | $7,000 | $7,000 | $7,000 | $7,000 | |
| General Assumptions | |||||||||||||
| Month 1 | Month 2 | Month 3 | Month 4 | Month 5 | Month 6 | Month 7 | Month 8 | Month 9 | Month 10 | Month 11 | Month 12 | ||
| Plan Month | 1 | 2 | 3 | 4 | 5 | 6 | 7 | 8 | 9 | 10 | 11 | 12 | |
| Current Interest Rate | 10.00% | 10.00% | 10.00% | 10.00% | 10.00% | 10.00% | 10.00% | 10.00% | 10.00% | 10.00% | 10.00% | 10.00% | |
| Long-term Interest Rate | 10.00% | 10.00% | 10.00% | 10.00% | 10.00% | 10.00% | 10.00% | 10.00% | 10.00% | 10.00% | 10.00% | 10.00% | |
| Tax Rate | 30.00% | 30.00% | 30.00% | 30.00% | 30.00% | 30.00% | 30.00% | 30.00% | 30.00% | 30.00% | 30.00% | 30.00% | |
| Other | 0 | 0 | 0 | 0 | 0 | 0 | 0 | 0 | 0 | 0 | 0 | 0 | |
| Pro Forma Profit and Loss | |||||||||||||
| Month 1 | Month 2 | Month 3 | Month 4 | Month 5 | Month 6 | Month 7 | Month 8 | Month 9 | Month 10 | Month 11 | Month 12 | ||
| Sales | $0 | $3,000 | $4,278 | $5,094 | $5,987 | $6,424 | $7,174 | $8,249 | $10,787 | $12,270 | $16,254 | $18,618 | |
| Direct Cost of Sales | $0 | $1,050 | $1,497 | $1,783 | $2,095 | $2,248 | $2,511 | $2,887 | $3,775 | $4,295 | $5,689 | $6,516 | |
| Other Costs of Sales | $0 | $0 | $0 | $0 | $0 | $0 | $0 | $0 | $0 | $0 | $0 | $0 | |
| Total Cost of Sales | $0 | $1,050 | $1,497 | $1,783 | $2,095 | $2,248 | $2,511 | $2,887 | $3,775 | $4,295 | $5,689 | $6,516 | |
| Gross Margin | $0 | $1,950 | $2,781 | $3,311 | $3,891 | $4,175 | $4,663 | $5,362 | $7,011 | $7,976 | $10,565 | $12,102 | |
| Gross Margin % | 0.00% | 65.00% | 65.00% | 65.00% | 65.00% | 65.00% | 65.00% | 65.00% | 65.00% | 65.00% | 65.00% | 65.00% | |
| Expenses | |||||||||||||
| Payroll | $0 | $5,500 | $7,000 | $7,000 | $7,000 | $7,000 | $7,000 | $7,000 | $7,000 | $7,000 | $7,000 | $7,000 | |
| Sales and Marketing and Other Expenses | $200 | $200 | $200 | $200 | $200 | $200 | $200 | $200 | $200 | $200 | $200 | $200 | |
| Depreciation | $1,217 | $1,217 | $1,217 | $1,217 | $1,217 | $1,217 | $1,217 | $1,217 | $1,217 | $1,217 | $1,217 | $1,217 | |
| Rent | $1,000 | $1,000 | $1,000 | $1,000 | $1,000 | $1,000 | $1,000 | $1,000 | $1,000 | $1,000 | $1,000 | $1,000 | |
| Utilities | $150 | $150 | $150 | $150 | $150 | $150 | $150 | $150 | $150 | $150 | $150 | $150 | |
| Insurance | $200 | $200 | $200 | $200 | $200 | $200 | $200 | $200 | $200 | $200 | $200 | $200 | |
| Payroll Taxes | 15% | $0 | $825 | $1,050 | $1,050 | $1,050 | $1,050 | $1,050 | $1,050 | $1,050 | $1,050 | $1,050 | $1,050 |
| Other | $0 | $0 | $0 | $0 | $0 | $0 | $0 | $0 | $0 | $0 | $0 | $0 | |
| Total Operating Expenses | $2,767 | $9,092 | $10,817 | $10,817 | $10,817 | $10,817 | $10,817 | $10,817 | $10,817 | $10,817 | $10,817 | $10,817 | |
| Profit Before Interest and Taxes | ($2,767) | ($7,142) | ($8,036) | ($7,506) | ($6,926) | ($6,642) | ($6,154) | ($5,455) | ($3,806) | ($2,842) | ($252) | $1,285 | |
| EBITDA | ($1,550) | ($5,925) | ($6,819) | ($6,289) | ($5,709) | ($5,425) | ($4,937) | ($4,238) | ($2,589) | ($1,625) | $965 | $2,502 | |
| Interest Expense | $1,408 | $1,400 | $1,392 | $1,383 | $1,375 | $1,367 | $1,358 | $1,350 | $1,342 | $1,333 | $1,325 | $1,317 | |
| Taxes Incurred | $0 | $0 | $0 | $0 | $0 | $0 | $0 | $0 | $0 | $0 | $0 | $0 | |
| Net Profit | ($4,175) | ($8,542) | ($9,428) | ($8,889) | ($8,301) | ($8,008) | ($7,512) | ($6,805) | ($5,147) | ($4,175) | ($1,577) | ($32) | |
| Net Profit/Sales | 0.00% | -284.73% | -220.38% | -174.50% | -138.65% | -124.67% | -104.72% | -82.50% | -47.72% | -34.02% | -9.70% | -0.17% | |
| Pro Forma Cash Flow | |||||||||||||
| Month 1 | Month 2 | Month 3 | Month 4 | Month 5 | Month 6 | Month 7 | Month 8 | Month 9 | Month 10 | Month 11 | Month 12 | ||
| Cash Received | |||||||||||||
| Cash from Operations | |||||||||||||
| Cash Sales | $0 | $750 | $1,070 | $1,274 | $1,497 | $1,606 | $1,793 | $2,062 | $2,697 | $3,068 | $4,064 | $4,655 | |
| Cash from Receivables | $0 | $0 | $75 | $2,282 | $3,229 | $3,843 | $4,501 | $4,836 | $5,407 | $6,250 | $8,127 | $9,302 | |
| Subtotal Cash from Operations | $0 | $750 | $1,145 | $3,555 | $4,726 | $5,449 | $6,294 | $6,899 | $8,104 | $9,318 | $12,191 | $13,957 | |
| Additional Cash Received | |||||||||||||
| Sales Tax, VAT, HST/GST Received | 0.00% | $0 | $0 | $0 | $0 | $0 | $0 | $0 | $0 | $0 | $0 | $0 | $0 |
| New Current Borrowing | $0 | $0 | $0 | $0 | $0 | $0 | $0 | $0 | $0 | $0 | $0 | $0 | |
| New Other Liabilities (interest-free) | $0 | $0 | $0 | $0 | $0 | $0 | $0 | $0 | $0 | $0 | $0 | $0 | |
| New Long-term Liabilities | $0 | $0 | $0 | $0 | $0 | $0 | $0 | $0 | $0 | $0 | $0 | $0 | |
| Sales of Other Current Assets | $0 | $0 | $0 | $0 | $0 | $0 | $0 | $0 | $0 | $0 | $0 | $0 | |
| Sales of Long-term Assets | $0 | $0 | $0 | $0 | $0 | $0 | $0 | $0 | $0 | $0 | $0 | $0 | |
| New Investment Received | $0 | $0 | $0 | $0 | $0 | $0 | $0 | $0 | $0 | $0 | $0 | $0 | |
| Subtotal Cash Received | $0 | $750 | $1,145 | $3,555 | $4,726 | $5,449 | $6,294 | $6,899 | $8,104 | $9,318 | $12,191 | $13,957 | |
| Expenditures | Month 1 | Month 2 | Month 3 | Month 4 | Month 5 | Month 6 | Month 7 | Month 8 | Month 9 | Month 10 | Month 11 | Month 12 | |
| Expenditures from Operations | |||||||||||||
| Cash Spending | $0 | $5,500 | $7,000 | $7,000 | $7,000 | $7,000 | $7,000 | $7,000 | $7,000 | $7,000 | $7,000 | $7,000 | |
| Bill Payments | $99 | $3,021 | $4,847 | $5,498 | $5,776 | $6,075 | $6,223 | $6,481 | $6,866 | $7,734 | $8,274 | $9,641 | |
| Subtotal Spent on Operations | $99 | $8,521 | $11,847 | $12,498 | $12,776 | $13,075 | $13,223 | $13,481 | $13,866 | $14,734 | $15,274 | $16,641 | |
| Additional Cash Spent | |||||||||||||
| Sales Tax, VAT, HST/GST Paid Out | $0 | $0 | $0 | $0 | $0 | $0 | $0 | $0 | $0 | $0 | $0 | $0 | |
| Principal Repayment of Current Borrowing | $0 | $0 | $0 | $0 | $0 | $0 | $0 | $0 | $0 | $0 | $0 | $0 | |
| Other Liabilities Principal Repayment | $0 | $0 | $0 | $0 | $0 | $0 | $0 | $0 | $0 | $0 | $0 | $0 | |
| Long-term Liabilities Principal Repayment | $1,000 | $1,000 | $1,000 | $1,000 | $1,000 | $1,000 | $1,000 | $1,000 | $1,000 | $1,000 | $1,000 | $1,000 | |
| Purchase Other Current Assets | $0 | $0 | $0 | $0 | $0 | $0 | $0 | $0 | $0 | $0 | $0 | $0 | |
| Purchase Long-term Assets | $0 | $0 | $0 | $0 | $0 | $0 | $0 | $0 | $0 | $0 | $0 | $0 | |
| Dividends | $0 | $0 | $0 | $0 | $0 | $0 | $0 | $0 | $0 | $0 | $0 | $0 | |
| Subtotal Cash Spent | $1,099 | $9,521 | $12,847 | $13,498 | $13,776 | $14,075 | $14,223 | $14,481 | $14,866 | $15,734 | $16,274 | $17,641 | |
| Net Cash Flow | ($1,099) | ($8,771) | ($11,703) | ($9,943) | ($9,051) | ($8,626) | ($7,929) | ($7,583) | ($6,763) | ($6,417) | ($4,083) | ($3,685) | |
| Cash Balance | $90,901 | $82,131 | $70,428 | $60,485 | $51,435 | $42,808 | $34,879 | $27,297 | $20,534 | $14,117 | $10,034 | $6,349 | |
| Pro Forma Balance Sheet | |||||||||||||
| Month 1 | Month 2 | Month 3 | Month 4 | Month 5 | Month 6 | Month 7 | Month 8 | Month 9 | Month 10 | Month 11 | Month 12 | ||
| Assets | Starting Balances | ||||||||||||
| Current Assets | |||||||||||||
| Cash | $92,000 | $90,901 | $82,131 | $70,428 | $60,485 | $51,435 | $42,808 | $34,879 | $27,297 | $20,534 | $14,117 | $10,034 | $6,349 |
| Accounts Receivable | $0 | $0 | $2,250 | $5,384 | $6,922 | $8,183 | $9,158 | $10,037 | $11,387 | $14,070 | $17,023 | $21,086 | $25,748 |
| Other Current Assets | $0 | $0 | $0 | $0 | $0 | $0 | $0 | $0 | $0 | $0 | $0 | $0 | $0 |
| Total Current Assets | $92,000 | $90,901 | $84,381 | $75,812 | $67,407 | $59,618 | $51,966 | $44,917 | $38,684 | $34,604 | $31,140 | $31,120 | $32,097 |
| Long-term Assets | |||||||||||||
| Long-term Assets | $73,000 | $73,000 | $73,000 | $73,000 | $73,000 | $73,000 | $73,000 | $73,000 | $73,000 | $73,000 | $73,000 | $73,000 | $73,000 |
| Accumulated Depreciation | $0 | $1,217 | $2,434 | $3,651 | $4,868 | $6,085 | $7,302 | $8,519 | $9,736 | $10,953 | $12,170 | $13,387 | $14,604 |
| Total Long-term Assets | $73,000 | $71,783 | $70,566 | $69,349 | $68,132 | $66,915 | $65,698 | $64,481 | $63,264 | $62,047 | $60,830 | $59,613 | $58,396 |
| Total Assets | $165,000 | $162,684 | $154,947 | $145,161 | $135,539 | $126,533 | $117,664 | $109,398 | $101,948 | $96,651 | $91,970 | $90,733 | $90,493 |
| Liabilities and Capital | Month 1 | Month 2 | Month 3 | Month 4 | Month 5 | Month 6 | Month 7 | Month 8 | Month 9 | Month 10 | Month 11 | Month 12 | |
| Current Liabilities | |||||||||||||
| Accounts Payable | $0 | $2,860 | $4,664 | $5,306 | $5,574 | $5,868 | $6,008 | $6,253 | $6,609 | $7,460 | $7,954 | $9,293 | $10,085 |
| Current Borrowing | $0 | $0 | $0 | $0 | $0 | $0 | $0 | $0 | $0 | $0 | $0 | $0 | $0 |
| Other Current Liabilities | $0 | $0 | $0 | $0 | $0 | $0 | $0 | $0 | $0 | $0 | $0 | $0 | $0 |
| Subtotal Current Liabilities | $0 | $2,860 | $4,664 | $5,306 | $5,574 | $5,868 | $6,008 | $6,253 | $6,609 | $7,460 | $7,954 | $9,293 | $10,085 |
| Long-term Liabilities | $170,000 | $169,000 | $168,000 | $167,000 | $166,000 | $165,000 | $164,000 | $163,000 | $162,000 | $161,000 | $160,000 | $159,000 | $158,000 |
| Total Liabilities | $170,000 | $171,860 | $172,664 | $172,306 | $171,574 | $170,868 | $170,008 | $169,253 | $168,609 | $168,460 | $167,954 | $168,293 | $168,085 |
| Paid-in Capital | $0 | $0 | $0 | $0 | $0 | $0 | $0 | $0 | $0 | $0 | $0 | $0 | $0 |
| Retained Earnings | ($5,000) | ($5,000) | ($5,000) | ($5,000) | ($5,000) | ($5,000) | ($5,000) | ($5,000) | ($5,000) | ($5,000) | ($5,000) | ($5,000) | ($5,000) |
| Earnings | $0 | ($4,175) | ($12,717) | ($22,145) | ($31,035) | ($39,335) | ($47,343) | ($54,856) | ($61,661) | ($66,808) | ($70,983) | ($72,560) | ($72,592) |
| Total Capital | ($5,000) | ($9,175) | ($17,717) | ($27,145) | ($36,035) | ($44,335) | ($52,343) | ($59,856) | ($66,661) | ($71,808) | ($75,983) | ($77,560) | ($77,592) |
| Total Liabilities and Capital | $165,000 | $162,684 | $154,947 | $145,161 | $135,539 | $126,533 | $117,664 | $109,398 | $101,948 | $96,651 | $91,970 | $90,733 | $90,493 |
| Net Worth | ($5,000) | ($9,175) | ($17,717) | ($27,145) | ($36,035) | ($44,335) | ($52,343) | ($59,856) | ($66,661) | ($71,808) | ($75,983) | ($77,560) | ($77,592) |


