
SmokeJumpers
Executive Summary
Popular culture is no longer regional. The advent of cable television, syndicated radio programs, and the Internet has created a world where a fashion statement in New York will be on the streets in a small midwestern town in a matter days. The speed of our telecommunication system has increased young customers’ expectations and demands for products that represent their own cultural statement.
This clothing store business plan details how SmokeJumpers will offer young customers the youth-oriented products and clothing that are popular in large urban areas but not available locally.
The target customer is “Generation Y,” age 11-18, who listens to alternative music, participates in youth sports like skateboarding and snowboarding, and looks toward alternative clothing trends in large urban areas for inspiration. SmokeJumpers will provide the distinctive clothing, shoes and products that are just ahead of the fashion curve.

Mission
The mission of SmokeJumpers is to offer distinctive youth-oriented fashion and products to our target customers.
Keys to Success
- Accessible store where you always find something new that you want.
- Excellent vendor relationship that will facilitate quick shipment of orders.
- Establish an effective strategy for advertising to our target customers.
- Create a store image that our target customers sees as both attractive and trendy.
Company Summary
SmokeJumpers will offer youth-oriented products and clothing that are popular in the large urban areas but not currently available locally. John Steward, owner of SmokeJumpers, will create a cost-effective operation that will quickly bring new alternative clothing and products to the customer.
Start-up Summary
The start-up costs of SmokeJumpers consists of inventory and store displays. SmokeJumpers has adequate investment and a short-term loan.
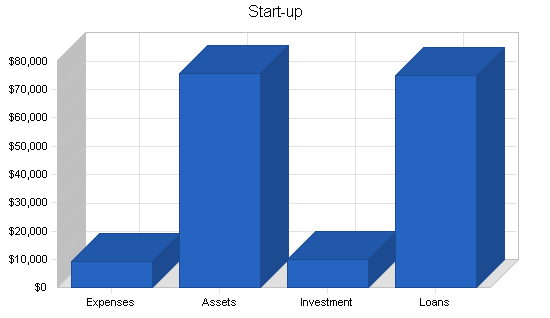
| Start-up | |
| Requirements | |
| Start-up Expenses | |
| Legal | $1,000 |
| Stationery etc. | $100 |
| Store Floor Setup | $5,000 |
| Insurance | $1,000 |
| Rent | $2,000 |
| Other | $0 |
| Total Start-up Expenses | $9,100 |
| Start-up Assets | |
| Cash Required | $40,000 |
| Start-up Inventory | $30,000 |
| Other Current Assets | $900 |
| Long-term Assets | $5,000 |
| Total Assets | $75,900 |
| Total Requirements | $85,000 |
| Start-up Funding | |
| Start-up Expenses to Fund | $9,100 |
| Start-up Assets to Fund | $75,900 |
| Total Funding Required | $85,000 |
| Assets | |
| Non-cash Assets from Start-up | $35,900 |
| Cash Requirements from Start-up | $40,000 |
| Additional Cash Raised | $0 |
| Cash Balance on Starting Date | $40,000 |
| Total Assets | $75,900 |
| Liabilities and Capital | |
| Liabilities | |
| Current Borrowing | $0 |
| Long-term Liabilities | $50,000 |
| Accounts Payable (Outstanding Bills) | $25,000 |
| Other Current Liabilities (interest-free) | $0 |
| Total Liabilities | $75,000 |
| Capital | |
| Planned Investment | |
| John Steward | $10,000 |
| Other | $0 |
| Additional Investment Requirement | $0 |
| Total Planned Investment | $10,000 |
| Loss at Start-up (Start-up Expenses) | ($9,100) |
| Total Capital | $900 |
| Total Capital and Liabilities | $75,900 |
| Total Funding | $85,000 |
Company Ownership
John Steward is the owner of SmokeJumpers.
Products
SmokeJumpers will offer young customers the following youth-oriented products and clothing:
- Shoes.
- Jackets.
- Sweaters.
- Shirts.
- Pants.
- Bags.
- Hats.
- T-shirts.
- Dresses and skirts.
- Shorts.
Market Analysis Summary
According to the U.S. Census Bureau the population of teens (age 12-17), in 1999 was 23.4 million, which represents 8.6% of the total U.S. population. Teenagers influence $324 billion in spending annually, have $151 billion in disposable income, spend $24 billion annually, and will spend $1.2 billion online by 2002. Teens spend an average of $82 per week on entertainment, fashion, food, and technology. These young people dubbed “Generation Y” dominate almost all facets of popular culture and are the fastest-growing demographic under age 65.
Specialty youth clothes and products is a billion dollar niche in the clothing industry. Over the past ten years, there has been a profound change in population dynamics in the U.S. The non-metropolitan population has been growing at the almost the same rate as the urban population. Evansville’s current population is 150,000 residents. The city is 250 miles from the closest urban center. Consequently, Evansville’s young people don’t live near a large urban center that offers the diversity in clothing products that the youth culture demands. This has created a small market niche for businesses to sell clothing and products. This is particularly true in communities with a major college located in the community, like Evansville.
Currently, only two regional malls offer access to the fashion and styles that young people want. Unfortunately, the focus of these mall stores is only on the mainstream of the youth market. Alternative clothing and products are rarely available outside urban areas. This is true because the companies that create the clothing and products are small and sell primarily through urban specialty shops.
It is SmokeJumpers’ plan to bring these new alternative fashion and products to its target customer groups.
Market Segmentation
SmokeJumpers will capitalize on the following characteristics of Generation Y:
- Subculture Affiliation: Though rebellious, teens also want to blend in and be accepted by peers. They seek a community of peers to welcome them, as well as help them stand out.
- Attitude: Teenagers wear attitude like a uniform to give definition to their identity. This extends to clothing, hair style and the type of music listened to in public. They also react to humor, silliness, and irreverence more easily than to other styles.
It is SmokeJumpers’ plan to create a business identity that will capitalize on the subculture affiliation and attitude of our target customers. SmokeJumpers will focus on three significant customer groups:
- Skateboarders: This group is a pivotal customer group for SmokeJumpers. Skateboarders are deeply influenced by urban culture, especially in music, foot gear, and clothing. Distinctive urban style is a important component of the skateboard culture.
- Alternateens: This group is important for the sustained growth of the business. They represent a wide range of young people who identify themselves as part of the alternative culture. The most critical members of this group for SmokeJumpers are the “weekend warriors” who dress the part only for parties and concerts. They represent the majority of the group and have the most money to spend on products.
- College Students: Evansville University has an enrollment of 12,000 students, of which 5,000 are 19 years of age or younger. In many ways, it is the college population that sustains the alternative culture in Evansville. SmokeJumpers will advertise in the student daily newspaper to bring this target customer group into the store.
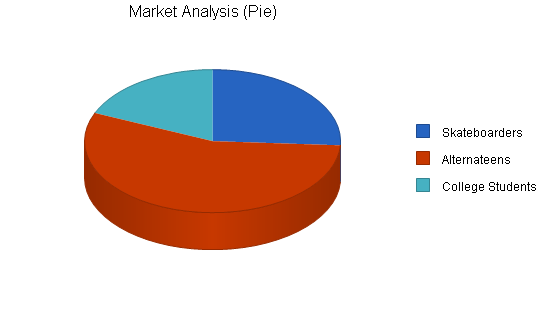
| Market Analysis | |||||||
| Year 1 | Year 2 | Year 3 | Year 4 | Year 5 | |||
| Potential Customers | Growth | CAGR | |||||
| Skateboarders | 15% | 7,000 | 8,050 | 9,258 | 10,647 | 12,244 | 15.00% |
| Alternateens | 17% | 15,000 | 17,550 | 20,534 | 24,025 | 28,109 | 17.00% |
| College Students | 10% | 5,000 | 5,500 | 6,050 | 6,655 | 7,321 | 10.00% |
| Total | 15.27% | 27,000 | 31,100 | 35,842 | 41,327 | 47,674 | 15.27% |
Strategy and Implementation Summary
SmokeJumpers will focus on becoming the coolest place in Evansville to shop for alternative clothes, shoes, and youth-oriented products.
Competitive Edge
SmokeJumpers’ competitive advantage is offering product lines that make a statement but won’t leave you broke. The major brands are expensive and not distinctive enough to satisfy the ever changing taste of our target customers. SmokeJumpers offers products that are just ahead of the curve and so affordable that our customers will return to the store often to check out what’s new.
Another competitive factor is that products for this age group are part of a lifestyle statement. SmokeJumpers is focused on serving the Evansville youth. We want to represent their style and life choices. We believe that we will create a loyal customer base that will see SmokeJumpers as part of their lives.
Sales Strategy
SmokeJumpers’ strategy will be two track.
- SmokeJumpers will advertise in the Evansville University daily student newspaper and the free Evansville Weekly, which is focused on SmokeJumpers target customer groups.
- SmokeJumpers will also plan three events to raise its visibility with target customers. We will assemble a group of boy and girl skateboarders and sponsor them with the SmokeJumpers logo. The skateboard competition will be followed by a street dance. SmokeJumpers will book a local popular alternative college band to play the event. We will find co-sponsors for the events that are also focused on the same target customers. At these events, SmokeJumpers will distribute stickers, caps, t-shirts, and promotional material offering 20% discount on purchases.
Sales Forecast
The following is the sales forecast for three years.


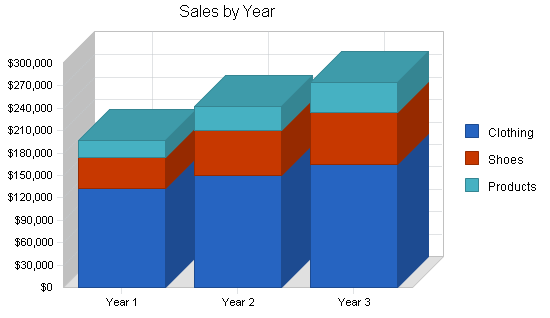
| Sales Forecast | |||
| Year 1 | Year 2 | Year 3 | |
| Sales | |||
| Clothing | $132,000 | $150,000 | $165,000 |
| Shoes | $42,350 | $60,000 | $70,000 |
| Products | $22,300 | $32,000 | $40,000 |
| Total Sales | $196,650 | $242,000 | $275,000 |
| Direct Cost of Sales | Year 1 | Year 2 | Year 3 |
| Clothing | $30,300 | $36,000 | $41,000 |
| Shoes | $13,450 | $16,000 | $19,000 |
| Products | $7,360 | $10,000 | $13,000 |
| Subtotal Direct Cost of Sales | $51,110 | $62,000 | $73,000 |
Management Summary
John Steward, owner of SmokeJumpers, will manage the daily operations of the store. John has five years of experience in the retail clothing industry. After graduation with a B.A. in English from State University, John started as a sales associate with Hoffman Clothing, the largest local clothing store in Evansville. Within three years, he was promoted to evening manager for the store’s Young Adult Section. John has been praised as an excellent manager who is particularly good with the youngest staff members. John is also a member of the popular alternative band, Infantile Syndrome. The combination of these two professional experiences make John uniquely qualified to understand the demands of his target customers.
Personnel Plan
SmokeJumpers will have a staff of four: a manager (John Steward) and three part-time cashie/clerks.
| Personnel Plan | |||
| Year 1 | Year 2 | Year 3 | |
| Manager | $30,000 | $34,000 | $38,000 |
| Half-time Cashiers/Clerks (3) | $24,000 | $28,000 | $32,000 |
| Total People | 4 | 4 | 4 |
| Total Payroll | $54,000 | $62,000 | $70,000 |
Financial Plan
The following is the financial plan for SmokeJumpers.
Break-even Analysis
The monthly break-even point is shown in the table and chart below.

| Break-even Analysis | |
| Monthly Revenue Break-even | $15,228 |
| Assumptions: | |
| Average Percent Variable Cost | 26% |
| Estimated Monthly Fixed Cost | $11,270 |
Projected Profit and Loss
The following table and chart details the projected profit and loss for three years.


| Pro Forma Profit and Loss | |||
| Year 1 | Year 2 | Year 3 | |
| Sales | $196,650 | $242,000 | $275,000 |
| Direct Cost of Sales | $51,110 | $62,000 | $73,000 |
| Other Production Expenses | $0 | $0 | $0 |
| Total Cost of Sales | $51,110 | $62,000 | $73,000 |
| Gross Margin | $145,540 | $180,000 | $202,000 |
| Gross Margin % | 74.01% | 74.38% | 73.45% |
| Expenses | |||
| Payroll | $54,000 | $62,000 | $70,000 |
| Sales and Marketing and Other Expenses | $30,000 | $40,000 | $50,000 |
| Depreciation | $7,140 | $7,140 | $7,140 |
| Leased Equipment | $0 | $0 | $0 |
| Utilities | $6,000 | $6,000 | $6,000 |
| Insurance | $6,000 | $6,000 | $6,000 |
| Rent | $24,000 | $24,000 | $24,000 |
| Payroll Taxes | $8,100 | $9,300 | $10,500 |
| Other | $0 | $0 | $0 |
| Total Operating Expenses | $135,240 | $154,440 | $173,640 |
| Profit Before Interest and Taxes | $10,300 | $25,560 | $28,360 |
| EBITDA | $17,440 | $32,700 | $35,500 |
| Interest Expense | $4,480 | $3,560 | $2,600 |
| Taxes Incurred | $1,746 | $6,600 | $7,728 |
| Net Profit | $4,074 | $15,400 | $18,032 |
| Net Profit/Sales | 2.07% | 6.36% | 6.56% |
Projected Cash Flow
The following table and chart presents the projected cash flow for three years.

| Pro Forma Cash Flow | |||
| Year 1 | Year 2 | Year 3 | |
| Cash Received | |||
| Cash from Operations | |||
| Cash Sales | $196,650 | $242,000 | $275,000 |
| Subtotal Cash from Operations | $196,650 | $242,000 | $275,000 |
| Additional Cash Received | |||
| Sales Tax, VAT, HST/GST Received | $0 | $0 | $0 |
| New Current Borrowing | $0 | $0 | $0 |
| New Other Liabilities (interest-free) | $0 | $0 | $0 |
| New Long-term Liabilities | $0 | $0 | $0 |
| Sales of Other Current Assets | $0 | $0 | $0 |
| Sales of Long-term Assets | $0 | $0 | $0 |
| New Investment Received | $0 | $0 | $0 |
| Subtotal Cash Received | $196,650 | $242,000 | $275,000 |
| Expenditures | Year 1 | Year 2 | Year 3 |
| Expenditures from Operations | |||
| Cash Spending | $54,000 | $62,000 | $70,000 |
| Bill Payments | $122,893 | $167,509 | $182,158 |
| Subtotal Spent on Operations | $176,893 | $229,509 | $252,158 |
| Additional Cash Spent | |||
| Sales Tax, VAT, HST/GST Paid Out | $0 | $0 | $0 |
| Principal Repayment of Current Borrowing | $0 | $0 | $0 |
| Other Liabilities Principal Repayment | $0 | $0 | $0 |
| Long-term Liabilities Principal Repayment | $9,600 | $9,600 | $9,600 |
| Purchase Other Current Assets | $0 | $0 | $0 |
| Purchase Long-term Assets | $0 | $0 | $0 |
| Dividends | $0 | $0 | $0 |
| Subtotal Cash Spent | $186,493 | $239,109 | $261,758 |
| Net Cash Flow | $10,157 | $2,891 | $13,242 |
| Cash Balance | $50,157 | $53,048 | $66,290 |
Projected Balance Sheet
The following table dislays the projected balance sheet for three years.
| Pro Forma Balance Sheet | |||
| Year 1 | Year 2 | Year 3 | |
| Assets | |||
| Current Assets | |||
| Cash | $50,157 | $53,048 | $66,290 |
| Inventory | $3,465 | $20,879 | $23,861 |
| Other Current Assets | $900 | $900 | $900 |
| Total Current Assets | $54,522 | $74,827 | $91,051 |
| Long-term Assets | |||
| Long-term Assets | $5,000 | $5,000 | $5,000 |
| Accumulated Depreciation | $7,140 | $14,280 | $21,420 |
| Total Long-term Assets | ($2,140) | ($9,280) | ($16,420) |
| Total Assets | $52,382 | $65,547 | $74,631 |
| Liabilities and Capital | Year 1 | Year 2 | Year 3 |
| Current Liabilities | |||
| Accounts Payable | $7,008 | $14,373 | $15,025 |
| Current Borrowing | $0 | $0 | $0 |
| Other Current Liabilities | $0 | $0 | $0 |
| Subtotal Current Liabilities | $7,008 | $14,373 | $15,025 |
| Long-term Liabilities | $40,400 | $30,800 | $21,200 |
| Total Liabilities | $47,408 | $45,173 | $36,225 |
| Paid-in Capital | $10,000 | $10,000 | $10,000 |
| Retained Earnings | ($9,100) | ($5,026) | $10,374 |
| Earnings | $4,074 | $15,400 | $18,032 |
| Total Capital | $4,974 | $20,374 | $38,406 |
| Total Liabilities and Capital | $52,382 | $65,547 | $74,631 |
| Net Worth | $4,974 | $20,374 | $38,406 |
Business Ratios
Business ratios for the years of this plan are shown below. Industry profile ratios based on the Standard Industrial Classification (SIC) code 5999, Miscellaneous Retail Stores, are shown for comparison.
| Ratio Analysis | ||||
| Year 1 | Year 2 | Year 3 | Industry Profile | |
| Sales Growth | n.a. | 23.06% | 13.64% | 6.30% |
| Percent of Total Assets | ||||
| Inventory | 6.61% | 31.85% | 31.97% | 39.30% |
| Other Current Assets | 1.72% | 1.37% | 1.21% | 23.90% |
| Total Current Assets | 104.09% | 114.16% | 122.00% | 80.10% |
| Long-term Assets | -4.09% | -14.16% | -22.00% | 19.90% |
| Total Assets | 100.00% | 100.00% | 100.00% | 100.00% |
| Current Liabilities | 13.38% | 21.93% | 20.13% | 46.00% |
| Long-term Liabilities | 77.13% | 46.99% | 28.41% | 14.00% |
| Total Liabilities | 90.50% | 68.92% | 48.54% | 60.00% |
| Net Worth | 9.50% | 31.08% | 51.46% | 40.00% |
| Percent of Sales | ||||
| Sales | 100.00% | 100.00% | 100.00% | 100.00% |
| Gross Margin | 74.01% | 74.38% | 73.45% | 34.10% |
| Selling, General & Administrative Expenses | 71.94% | 68.02% | 66.90% | 19.80% |
| Advertising Expenses | 15.26% | 16.53% | 18.18% | 2.60% |
| Profit Before Interest and Taxes | 5.24% | 10.56% | 10.31% | 1.10% |
| Main Ratios | ||||
| Current | 7.78 | 5.21 | 6.06 | 1.77 |
| Quick | 7.29 | 3.75 | 4.47 | 0.67 |
| Total Debt to Total Assets | 90.50% | 68.92% | 48.54% | 60.00% |
| Pre-tax Return on Net Worth | 117.01% | 107.98% | 67.07% | 2.60% |
| Pre-tax Return on Assets | 11.11% | 33.56% | 34.52% | 6.50% |
| Additional Ratios | Year 1 | Year 2 | Year 3 | |
| Net Profit Margin | 2.07% | 6.36% | 6.56% | n.a |
| Return on Equity | 81.91% | 75.59% | 46.95% | n.a |
| Activity Ratios | ||||
| Inventory Turnover | 3.60 | 5.09 | 3.26 | n.a |
| Accounts Payable Turnover | 14.97 | 12.17 | 12.17 | n.a |
| Payment Days | 34 | 22 | 29 | n.a |
| Total Asset Turnover | 3.75 | 3.69 | 3.68 | n.a |
| Debt Ratios | ||||
| Debt to Net Worth | 9.53 | 2.22 | 0.94 | n.a |
| Current Liab. to Liab. | 0.15 | 0.32 | 0.41 | n.a |
| Liquidity Ratios | ||||
| Net Working Capital | $47,514 | $60,454 | $76,026 | n.a |
| Interest Coverage | 2.30 | 7.18 | 10.91 | n.a |
| Additional Ratios | ||||
| Assets to Sales | 0.27 | 0.27 | 0.27 | n.a |
| Current Debt/Total Assets | 13% | 22% | 20% | n.a |
| Acid Test | 7.29 | 3.75 | 4.47 | n.a |
| Sales/Net Worth | 39.54 | 11.88 | 7.16 | n.a |
| Dividend Payout | 0.00 | 0.00 | 0.00 | n.a |
Appendix
| Sales Forecast | |||||||||||||
| Month 1 | Month 2 | Month 3 | Month 4 | Month 5 | Month 6 | Month 7 | Month 8 | Month 9 | Month 10 | Month 11 | Month 12 | ||
| Sales | |||||||||||||
| Clothing | 0% | $3,000 | $5,000 | $6,000 | $8,000 | $11,000 | $14,000 | $14,000 | $15,000 | $17,000 | $19,000 | $11,000 | $9,000 |
| Shoes | 0% | $800 | $1,500 | $2,050 | $3,000 | $4,000 | $4,000 | $4,000 | $5,000 | $6,000 | $6,000 | $3,000 | $3,000 |
| Products | 0% | $300 | $700 | $1,300 | $1,500 | $2,000 | $2,000 | $2,000 | $3,000 | $3,000 | $4,000 | $1,000 | $1,500 |
| Total Sales | $4,100 | $7,200 | $9,350 | $12,500 | $17,000 | $20,000 | $20,000 | $23,000 | $26,000 | $29,000 | $15,000 | $13,500 | |
| Direct Cost of Sales | Month 1 | Month 2 | Month 3 | Month 4 | Month 5 | Month 6 | Month 7 | Month 8 | Month 9 | Month 10 | Month 11 | Month 12 | |
| Clothing | $800 | $1,000 | $1,300 | $1,600 | $2,300 | $3,000 | $3,000 | $3,200 | $3,900 | $4,200 | $4,000 | $2,000 | |
| Shoes | $250 | $400 | $700 | $900 | $1,400 | $1,400 | $1,400 | $1,600 | $1,900 | $1,900 | $800 | $800 | |
| Products | $80 | $130 | $400 | $600 | $800 | $800 | $800 | $1,000 | $1,000 | $1,200 | $200 | $350 | |
| Subtotal Direct Cost of Sales | $1,130 | $1,530 | $2,400 | $3,100 | $4,500 | $5,200 | $5,200 | $5,800 | $6,800 | $7,300 | $5,000 | $3,150 | |
| Personnel Plan | |||||||||||||
| Month 1 | Month 2 | Month 3 | Month 4 | Month 5 | Month 6 | Month 7 | Month 8 | Month 9 | Month 10 | Month 11 | Month 12 | ||
| Manager | 0% | $2,500 | $2,500 | $2,500 | $2,500 | $2,500 | $2,500 | $2,500 | $2,500 | $2,500 | $2,500 | $2,500 | $2,500 |
| Half-time Cashiers/Clerks (3) | 0% | $2,000 | $2,000 | $2,000 | $2,000 | $2,000 | $2,000 | $2,000 | $2,000 | $2,000 | $2,000 | $2,000 | $2,000 |
| Total People | 4 | 4 | 4 | 4 | 4 | 4 | 4 | 4 | 4 | 4 | 4 | 4 | |
| Total Payroll | $4,500 | $4,500 | $4,500 | $4,500 | $4,500 | $4,500 | $4,500 | $4,500 | $4,500 | $4,500 | $4,500 | $4,500 | |
| General Assumptions | |||||||||||||
| Month 1 | Month 2 | Month 3 | Month 4 | Month 5 | Month 6 | Month 7 | Month 8 | Month 9 | Month 10 | Month 11 | Month 12 | ||
| Plan Month | 1 | 2 | 3 | 4 | 5 | 6 | 7 | 8 | 9 | 10 | 11 | 12 | |
| Current Interest Rate | 10.00% | 10.00% | 10.00% | 10.00% | 10.00% | 10.00% | 10.00% | 10.00% | 10.00% | 10.00% | 10.00% | 10.00% | |
| Long-term Interest Rate | 10.00% | 10.00% | 10.00% | 10.00% | 10.00% | 10.00% | 10.00% | 10.00% | 10.00% | 10.00% | 10.00% | 10.00% | |
| Tax Rate | 30.00% | 30.00% | 30.00% | 30.00% | 30.00% | 30.00% | 30.00% | 30.00% | 30.00% | 30.00% | 30.00% | 30.00% | |
| Other | 0 | 0 | 0 | 0 | 0 | 0 | 0 | 0 | 0 | 0 | 0 | 0 | |
| Pro Forma Profit and Loss | |||||||||||||
| Month 1 | Month 2 | Month 3 | Month 4 | Month 5 | Month 6 | Month 7 | Month 8 | Month 9 | Month 10 | Month 11 | Month 12 | ||
| Sales | $4,100 | $7,200 | $9,350 | $12,500 | $17,000 | $20,000 | $20,000 | $23,000 | $26,000 | $29,000 | $15,000 | $13,500 | |
| Direct Cost of Sales | $1,130 | $1,530 | $2,400 | $3,100 | $4,500 | $5,200 | $5,200 | $5,800 | $6,800 | $7,300 | $5,000 | $3,150 | |
| Other Production Expenses | $0 | $0 | $0 | $0 | $0 | $0 | $0 | $0 | $0 | $0 | $0 | $0 | |
| Total Cost of Sales | $1,130 | $1,530 | $2,400 | $3,100 | $4,500 | $5,200 | $5,200 | $5,800 | $6,800 | $7,300 | $5,000 | $3,150 | |
| Gross Margin | $2,970 | $5,670 | $6,950 | $9,400 | $12,500 | $14,800 | $14,800 | $17,200 | $19,200 | $21,700 | $10,000 | $10,350 | |
| Gross Margin % | 72.44% | 78.75% | 74.33% | 75.20% | 73.53% | 74.00% | 74.00% | 74.78% | 73.85% | 74.83% | 66.67% | 76.67% | |
| Expenses | |||||||||||||
| Payroll | $4,500 | $4,500 | $4,500 | $4,500 | $4,500 | $4,500 | $4,500 | $4,500 | $4,500 | $4,500 | $4,500 | $4,500 | |
| Sales and Marketing and Other Expenses | $2,500 | $2,500 | $2,500 | $2,500 | $2,500 | $2,500 | $2,500 | $2,500 | $2,500 | $2,500 | $2,500 | $2,500 | |
| Depreciation | $595 | $595 | $595 | $595 | $595 | $595 | $595 | $595 | $595 | $595 | $595 | $595 | |
| Leased Equipment | $0 | $0 | $0 | $0 | $0 | $0 | $0 | $0 | $0 | $0 | $0 | $0 | |
| Utilities | $500 | $500 | $500 | $500 | $500 | $500 | $500 | $500 | $500 | $500 | $500 | $500 | |
| Insurance | $500 | $500 | $500 | $500 | $500 | $500 | $500 | $500 | $500 | $500 | $500 | $500 | |
| Rent | $2,000 | $2,000 | $2,000 | $2,000 | $2,000 | $2,000 | $2,000 | $2,000 | $2,000 | $2,000 | $2,000 | $2,000 | |
| Payroll Taxes | 15% | $675 | $675 | $675 | $675 | $675 | $675 | $675 | $675 | $675 | $675 | $675 | $675 |
| Other | $0 | $0 | $0 | $0 | $0 | $0 | $0 | $0 | $0 | $0 | $0 | $0 | |
| Total Operating Expenses | $11,270 | $11,270 | $11,270 | $11,270 | $11,270 | $11,270 | $11,270 | $11,270 | $11,270 | $11,270 | $11,270 | $11,270 | |
| Profit Before Interest and Taxes | ($8,300) | ($5,600) | ($4,320) | ($1,870) | $1,230 | $3,530 | $3,530 | $5,930 | $7,930 | $10,430 | ($1,270) | ($920) | |
| EBITDA | ($7,705) | ($5,005) | ($3,725) | ($1,275) | $1,825 | $4,125 | $4,125 | $6,525 | $8,525 | $11,025 | ($675) | ($325) | |
| Interest Expense | $410 | $403 | $397 | $390 | $383 | $377 | $370 | $363 | $357 | $350 | $343 | $337 | |
| Taxes Incurred | ($2,613) | ($1,801) | ($1,415) | ($678) | $254 | $946 | $948 | $1,670 | $2,272 | $3,024 | ($484) | ($377) | |
| Net Profit | ($6,097) | ($4,202) | ($3,302) | ($1,582) | $593 | $2,207 | $2,212 | $3,897 | $5,301 | $7,056 | ($1,129) | ($880) | |
| Net Profit/Sales | -148.71% | -58.37% | -35.31% | -12.66% | 3.49% | 11.04% | 11.06% | 16.94% | 20.39% | 24.33% | -7.53% | -6.52% | |
| Pro Forma Cash Flow | |||||||||||||
| Month 1 | Month 2 | Month 3 | Month 4 | Month 5 | Month 6 | Month 7 | Month 8 | Month 9 | Month 10 | Month 11 | Month 12 | ||
| Cash Received | |||||||||||||
| Cash from Operations | |||||||||||||
| Cash Sales | $4,100 | $7,200 | $9,350 | $12,500 | $17,000 | $20,000 | $20,000 | $23,000 | $26,000 | $29,000 | $15,000 | $13,500 | |
| Subtotal Cash from Operations | $4,100 | $7,200 | $9,350 | $12,500 | $17,000 | $20,000 | $20,000 | $23,000 | $26,000 | $29,000 | $15,000 | $13,500 | |
| Additional Cash Received | |||||||||||||
| Sales Tax, VAT, HST/GST Received | 0.00% | $0 | $0 | $0 | $0 | $0 | $0 | $0 | $0 | $0 | $0 | $0 | $0 |
| New Current Borrowing | $0 | $0 | $0 | $0 | $0 | $0 | $0 | $0 | $0 | $0 | $0 | $0 | |
| New Other Liabilities (interest-free) | $0 | $0 | $0 | $0 | $0 | $0 | $0 | $0 | $0 | $0 | $0 | $0 | |
| New Long-term Liabilities | $0 | $0 | $0 | $0 | $0 | $0 | $0 | $0 | $0 | $0 | $0 | $0 | |
| Sales of Other Current Assets | $0 | $0 | $0 | $0 | $0 | $0 | $0 | $0 | $0 | $0 | $0 | $0 | |
| Sales of Long-term Assets | $0 | $0 | $0 | $0 | $0 | $0 | $0 | $0 | $0 | $0 | $0 | $0 | |
| New Investment Received | $0 | $0 | $0 | $0 | $0 | $0 | $0 | $0 | $0 | $0 | $0 | $0 | |
| Subtotal Cash Received | $4,100 | $7,200 | $9,350 | $12,500 | $17,000 | $20,000 | $20,000 | $23,000 | $26,000 | $29,000 | $15,000 | $13,500 | |
| Expenditures | Month 1 | Month 2 | Month 3 | Month 4 | Month 5 | Month 6 | Month 7 | Month 8 | Month 9 | Month 10 | Month 11 | Month 12 | |
| Expenditures from Operations | |||||||||||||
| Cash Spending | $4,500 | $4,500 | $4,500 | $4,500 | $4,500 | $4,500 | $4,500 | $4,500 | $4,500 | $4,500 | $4,500 | $4,500 | |
| Bill Payments | $25,132 | $3,999 | $4,790 | $5,181 | $5,918 | $6,835 | $7,498 | $7,692 | $13,557 | $16,727 | $17,103 | $8,463 | |
| Subtotal Spent on Operations | $29,632 | $8,499 | $9,290 | $9,681 | $10,418 | $11,335 | $11,998 | $12,192 | $18,057 | $21,227 | $21,603 | $12,963 | |
| Additional Cash Spent | |||||||||||||
| Sales Tax, VAT, HST/GST Paid Out | $0 | $0 | $0 | $0 | $0 | $0 | $0 | $0 | $0 | $0 | $0 | $0 | |
| Principal Repayment of Current Borrowing | $0 | $0 | $0 | $0 | $0 | $0 | $0 | $0 | $0 | $0 | $0 | $0 | |
| Other Liabilities Principal Repayment | $0 | $0 | $0 | $0 | $0 | $0 | $0 | $0 | $0 | $0 | $0 | $0 | |
| Long-term Liabilities Principal Repayment | $800 | $800 | $800 | $800 | $800 | $800 | $800 | $800 | $800 | $800 | $800 | $800 | |
| Purchase Other Current Assets | $0 | $0 | $0 | $0 | $0 | $0 | $0 | $0 | $0 | $0 | $0 | $0 | |
| Purchase Long-term Assets | $0 | $0 | $0 | $0 | $0 | $0 | $0 | $0 | $0 | $0 | $0 | $0 | |
| Dividends | $0 | $0 | $0 | $0 | $0 | $0 | $0 | $0 | $0 | $0 | $0 | $0 | |
| Subtotal Cash Spent | $30,432 | $9,299 | $10,090 | $10,481 | $11,218 | $12,135 | $12,798 | $12,992 | $18,857 | $22,027 | $22,403 | $13,763 | |
| Net Cash Flow | ($26,332) | ($2,099) | ($740) | $2,019 | $5,782 | $7,865 | $7,202 | $10,008 | $7,143 | $6,973 | ($7,403) | ($263) | |
| Cash Balance | $13,668 | $11,569 | $10,829 | $12,848 | $18,630 | $26,495 | $33,697 | $43,706 | $50,849 | $57,822 | $50,420 | $50,157 | |
| Pro Forma Balance Sheet | |||||||||||||
| Month 1 | Month 2 | Month 3 | Month 4 | Month 5 | Month 6 | Month 7 | Month 8 | Month 9 | Month 10 | Month 11 | Month 12 | ||
| Assets | Starting Balances | ||||||||||||
| Current Assets | |||||||||||||
| Cash | $40,000 | $13,668 | $11,569 | $10,829 | $12,848 | $18,630 | $26,495 | $33,697 | $43,706 | $50,849 | $57,822 | $50,420 | $50,157 |
| Inventory | $30,000 | $28,870 | $27,340 | $24,940 | $21,840 | $17,340 | $12,140 | $6,940 | $6,380 | $7,480 | $8,030 | $5,500 | $3,465 |
| Other Current Assets | $900 | $900 | $900 | $900 | $900 | $900 | $900 | $900 | $900 | $900 | $900 | $900 | $900 |
| Total Current Assets | $70,900 | $43,438 | $39,809 | $36,669 | $35,588 | $36,870 | $39,535 | $41,537 | $50,986 | $59,229 | $66,752 | $56,820 | $54,522 |
| Long-term Assets | |||||||||||||
| Long-term Assets | $5,000 | $5,000 | $5,000 | $5,000 | $5,000 | $5,000 | $5,000 | $5,000 | $5,000 | $5,000 | $5,000 | $5,000 | $5,000 |
| Accumulated Depreciation | $0 | $595 | $1,190 | $1,785 | $2,380 | $2,975 | $3,570 | $4,165 | $4,760 | $5,355 | $5,950 | $6,545 | $7,140 |
| Total Long-term Assets | $5,000 | $4,405 | $3,810 | $3,215 | $2,620 | $2,025 | $1,430 | $835 | $240 | ($355) | ($950) | ($1,545) | ($2,140) |
| Total Assets | $75,900 | $47,843 | $43,619 | $39,884 | $38,208 | $38,895 | $40,965 | $42,372 | $51,226 | $58,874 | $65,802 | $55,275 | $52,382 |
| Liabilities and Capital | Month 1 | Month 2 | Month 3 | Month 4 | Month 5 | Month 6 | Month 7 | Month 8 | Month 9 | Month 10 | Month 11 | Month 12 | |
| Current Liabilities | |||||||||||||
| Accounts Payable | $25,000 | $3,840 | $4,618 | $4,985 | $5,691 | $6,585 | $7,248 | $7,243 | $13,000 | $16,147 | $16,819 | $8,221 | $7,008 |
| Current Borrowing | $0 | $0 | $0 | $0 | $0 | $0 | $0 | $0 | $0 | $0 | $0 | $0 | $0 |
| Other Current Liabilities | $0 | $0 | $0 | $0 | $0 | $0 | $0 | $0 | $0 | $0 | $0 | $0 | $0 |
| Subtotal Current Liabilities | $25,000 | $3,840 | $4,618 | $4,985 | $5,691 | $6,585 | $7,248 | $7,243 | $13,000 | $16,147 | $16,819 | $8,221 | $7,008 |
| Long-term Liabilities | $50,000 | $49,200 | $48,400 | $47,600 | $46,800 | $46,000 | $45,200 | $44,400 | $43,600 | $42,800 | $42,000 | $41,200 | $40,400 |
| Total Liabilities | $75,000 | $53,040 | $53,018 | $52,585 | $52,491 | $52,585 | $52,448 | $51,643 | $56,600 | $58,947 | $58,819 | $49,421 | $47,408 |
| Paid-in Capital | $10,000 | $10,000 | $10,000 | $10,000 | $10,000 | $10,000 | $10,000 | $10,000 | $10,000 | $10,000 | $10,000 | $10,000 | $10,000 |
| Retained Earnings | ($9,100) | ($9,100) | ($9,100) | ($9,100) | ($9,100) | ($9,100) | ($9,100) | ($9,100) | ($9,100) | ($9,100) | ($9,100) | ($9,100) | ($9,100) |
| Earnings | $0 | ($6,097) | ($10,299) | ($13,601) | ($15,183) | ($14,590) | ($12,383) | ($10,171) | ($6,274) | ($973) | $6,083 | $4,954 | $4,074 |
| Total Capital | $900 | ($5,197) | ($9,399) | ($12,701) | ($14,283) | ($13,690) | ($11,483) | ($9,271) | ($5,374) | ($73) | $6,983 | $5,854 | $4,974 |
| Total Liabilities and Capital | $75,900 | $47,843 | $43,619 | $39,884 | $38,208 | $38,895 | $40,965 | $42,372 | $51,226 | $58,874 | $65,802 | $55,275 | $52,382 |
| Net Worth | $900 | ($5,197) | ($9,399) | ($12,701) | ($14,283) | ($13,690) | ($11,483) | ($9,271) | ($5,374) | ($73) | $6,983 | $5,854 | $4,974 |

