
City Dojo
Executive Summary
Since 1964 City Dojo (a karate school) has been a presence in its community. The dojo, owned and operated by the Shihan (head instructor) since 1975 has seen many changes at both city level and in the Martial Arts industry.
It is estimated that over five million Americans are currently involved in some type of Martial Arts training and while the boom years of the 1960’s has past, a steady flow of new students continue to explore the industry.
The location of City Dojo and its surrounding area (a market of over 250,000 potential members) has traditionally been a hot bed for Martial Arts training. Competition is keen. The dojo is at a turning point in its existence; expansion or closure. Currently the City Dojo is operated on a part-time basis (for the love of the art) offering little, if any income for its owner. The following business plan (the dojo’s first) was developed as a vehicle to identify potential. What was found is that there is tremendous opportunity in the Martial Arts marketplace and that the dojo is in a solid position not only to exist, but thrive in the Martial Arts industry.
The following plan will show how the dojo can increase from its current break-even point of 65 members to 200 members (80% of capacity) in three years. Sales growth, based on an expanded membership would increase from $65,000 in 2001, to $198,000 by year-end 2004. The business plan suggests the dojo can generate considerable cashflow, if the business is operated on a full-time basis, offering its owner and any investor a healthy income.
In order to accomplish this growth, the dojo requires a $20,000 loan to be repaid over eight years, secured by the owner’s collateral in the form of a house.

1.1 Objectives
- Remodel and upgrade dojo by year-end 2002 including a new computer, new training mat, new store-front and visitor area, dressing room upgrade and repairs to sauna.
- Increase paid membership to 200 by year-end 2004 (equivalent to 80% of dojo capacity).
- Reduce membership turnover by 30% by year-end 2004 (measured by number of students taking belt testing from white to blue).
- Develop a cashflow that allows for an investment build-up to support future expansion.
1.2 Mission
City Dojo was established to provide a place where one can learn the art of karate, have fun in the experience, make a commitment to that learning and to use the knowledge as a “stepping stone” to an improved self, family and community. Students will leave the dojo, with an experience that will last a lifetime.
1.3 Keys to Success
- Create a unique, modern, clean and safe dojo environment.
- Establishment, implementation and tracking of a budget and business plan.
- Building a solid Board of Advisors base for both karate training and business issues of the dojo.
Company Summary
City Dojo is one of the oldest karate schools in the Los Angeles County area and has been in existence since 1964. It serves a large area offering group and individual classes in the art of karate and self-defense. The dojo is located in the center of an outlining community near Los Angeles on a major business street with a storefront and ample parking in the rear.
2.1 Company Ownership
City Dojo was established in 1964. In 1975 the Shihan took over the operation and incorporated. The corporation status was dissolved in 1995 and since then the dojo has been a sole proprietorship of owner and Shihan. In the plan, the business will be changing from a sole proprietorship to a limited liability company with the Shihan as principal.
2.2 Company History
City Dojo was first established in 1964 during the Martial Arts boom (the Bruce Lee years). At its height the dojo had an overflow of 300 students (early 1980’s). With the advent of the California Northridge Earthquake (early 1990’s), increased competition, soft economic market and personal family matters of the owner, membership declined but has held steady at 60-70 over the past three years. It is felt that the dojo has a full facility capacity of 250 members.
Over the last three years the owner has operated the dojo more as a hobby then a business, on a part-time basis. Much of his income was derived from sources outside the dojo. The dojo (his first love) provided additional income on a limited basis. The attached table reflects the current position of the dojo over the past three years.

| Past Performance | |||
| 1999 | 2000 | 2001 | |
| Sales | $59,110 | $64,300 | $65,100 |
| Gross Margin | $42,184 | $49,113 | $47,095 |
| Gross Margin % | 71.37% | 76.38% | 72.34% |
| Operating Expenses | $40,960 | $44,980 | $46,300 |
| Balance Sheet | |||
| 1999 | 2000 | 2001 | |
| Current Assets | |||
| Cash | $1,000 | $1,500 | $1,500 |
| Other Current Assets | $0 | $0 | $0 |
| Total Current Assets | $1,000 | $1,500 | $1,500 |
| Long-term Assets | |||
| Long-term Assets | $25,000 | $35,000 | $40,000 |
| Accumulated Depreciation | $0 | $0 | $0 |
| Total Long-term Assets | $25,000 | $35,000 | $40,000 |
| Total Assets | $26,000 | $36,500 | $41,500 |
| Current Liabilities | |||
| Accounts Payable | $2,500 | $3,500 | $4,500 |
| Current Borrowing | $2,500 | $14,000 | $15,000 |
| Other Current Liabilities (interest free) | $0 | $0 | $0 |
| Total Current Liabilities | $5,000 | $17,500 | $19,500 |
| Long-term Liabilities | $5,000 | $14,000 | $15,000 |
| Total Liabilities | $10,000 | $31,500 | $34,500 |
| Paid-in Capital | $0 | $0 | $0 |
| Retained Earnings | $14,000 | $0 | $3,000 |
| Earnings | $2,000 | $5,000 | $4,000 |
| Total Capital | $16,000 | $5,000 | $7,000 |
| Total Capital and Liabilities | $26,000 | $36,500 | $41,500 |
| Other Inputs | |||
| Payment Days | 0 | 0 | 0 |
2.3 Company Locations and Facilities
The dojo is located in the heart of a small city near Los Angeles. It is a 3,000 square foot facility with a 1,800 square foot training area, 300 square foot viewing area (lobby) with a receptionist desk, large men’s and women’s dressing areas, showers and a sauna. There are two offices in the dojo, one used for storage, the other for the main office.
The building faces a major street and has considerable foot and drive by traffic. There is some parking on the street and considerable free parking in the rear of the building, with a back entrance to the dojo. The facility had a long-term lease (25 years) which has three more years to go. A 10 year extension is available, but the current $750 monthly rental will go up with that extension.
Services
The dojo is a school where one can train in the art of traditional karate. Similar to a health or fitness club the dojo relies on membership to survive. Products (services) offered are: training in karate, self-defense, aerobics and weapons training.
3.1 Service Description
Services currently provided are:
- An open training facility for members during non-class hours.
- Morning and evening classes, taught by experienced black-belt instructors.
- Private lessons for individuals and groups.
- Outside seminars on self-defense.
- Children’s ninja night (dojo sleep-over) offered once a quarter.
3.2 Competitive Comparison
Martial Arts, specifically karate instruction is a very competitive field. Various styles such as karate, judo, kung-fu, kenpo, tae-kwan-do, etc., all offer the same basic “traditional” Martial Arts training, self-defense, building self-confidence and providing exercise to varying degrees. While we promote our dojo’s style, we fully understand that style is a matter of choice and while style type may offer expertise in kicking, hand to hand, throws, etc., no “one” style can lay claim to being truly better than another. With this in mind, product (service) differentiation as a matter of Martial Arts style is not the key to success, rather we feel that promotion of a clean, modern, desirable facility, with knowledgeable staff that can work with students, at a reasonable price is what sets dojos apart.
3.3 Sales Literature
Currently the City Dojo has very limited sales literature. There is a color brochure identifying the Shihan’s (head instructors) background, history of the dojo and information on the dojo association it belongs. There is a one page monthly schedule of events published and available to students at the dojo and there is a nice but “limited” website presence.

3.4 Fulfillment
Trained black belt instructors are our #1 resource. These instructors are well versed in the training of karate and are selected by the Shihan for their karate knowledge and ability to work with students. Instructors are not paid, rather they are members of the inner circle of the dojo, a club of top students (sensei). Instructors are given free membership and access to the dojo and receive payment for private lessons they perform on a contract basis. Instructor materials (gi, belts, weapons) are provided free for their participation in training of students. Currently there are five members of this inner circle of trainers.
Also, under the watchful eye of the Shihan there are several green and brown belts who have shown interest in training. As they move up to black belt status they will be given the opportunity to join the inner circle.
3.5 Technology
We want to maintain a “traditional” sense to the dojo, however we realize that technology will help us better meet our business needs. With this in mind, we are going to upgrade our software and computer system. Included in this upgrade will be two new computers, linked to allow sharing of data. Windows 2000 will be used along with Microsoft Office products.
Currently, the dojo is using a database software product designed especially for Martial Arts schools (Dojo Master) which is utilized for membership data and billing. This software has not been fully utilized for marketing and upon review we are finding that there exists a gold mine of data that will be emphasize in future marketing efforts. For example: the database has names, numbers, ages, belt status, and last testing date of over 250 past members of the dojo dating back to 1999.
3.6 Future Services
The business plan is to get City Dojo up to 80% of capacity and run it as a business, not a hobby. The goal is to establish a “benchmark” school. Once established (2-3 years) we will copy the business model format and move it to other dojo’s in need of similar “makeovers.” Our studies show that over 30% of the independent dojo’s are barely making it because they, like our dojo, have owners who are skilled martial artists, love to teach martial arts, but lack a solid business planning, business savvy or business drive to run a successful dojo.
Market Analysis Summary
There has been considerable outside research and marketing of “Sports” in America, however we find that several categories of sport were seriously overlooked in most analysis. Martial Arts is one of those sports. While basic figures are provided for Martial Arts by the U.S. Census, and other major research firms, most of the available data has been obtained through other sources, such as independent studies and published articles.
Our demographic research has shown opportunity exists in our marketplace and while the market appears saturated, it became clear as we dug deeper that our field is so poorly defined, marketed and organized that we have a tremendous opportunity for growth and expansion. Information has been an eye opener and has led us to believe that our position as a potential leader in our market, and eventually the industry, is not an impossible task.
4.1 Market Segmentation
Extrapolating data from three national sources relating to sports in general and Martial Arts specifically, it is estimated that 10% of the U.S. population have participated in some form of Martial Arts training during their lifetime.
It is estimated that 2 to 4% of the U.S. population are currently active in some form of Martial Arts training (the variation in numbers is a result of some surveys using Tai Chi, Kickboxing and Yoga as a Martial Art form, and some include school programs, where others do not).
City Dojo is located in a city with a population of 133,936 (2000 census). The population broken by gender is 48.4% male and 51.6% female; broken by race; 43.7% White, 28.9% Hispanic (Latino), 12.7% African American and 11.1% Asian. The average age in the city is 34.5.
Results from a national survey on Martial Art schools indicated on average, kids ages 4-14 account for 70-80% of the individuals participating in Martial Art training. In a survey completed at the dojo, membership was as follows: ages 4-14 (53%), 15-29 (12%), 30-49 (28%) and 50+ (7%).
Research into our market has shown the following:
1. The dojo is located in the heart of the City, 55% of our membership came from the three zip codes listed below, all nearby within the city limits (data obtained from dojo records, the California State Dept. of Finance and U.S. Census):
- ZIP AAAAA surrounding the dojo has an average age of 35.1 and family income of $30,100.
- ZIP BBBBB northwest of the dojo has an average age of 33.5 and family income of $18,691.
- ZIP CCCCC west of the dojo has an average age of 33.5 and family income of $23,552.
2. 35% of our membership came from 9 other local zip codes (up to 3.5 miles from the dojo) which increases our potential market to 350,000. The majority in this group come from a higher income base. For example; of the 9 ZIP codes, the 3 shown below reflect the highest family income.
- ZIP DDDDD has an average age of 45.3 and a family income of $60,119.
- ZIP EEEEE has an average age of 42.6 and a family income of $71,808.
- ZIP FFFFF has an average age of 31.6 and a family income of $61,815.
3. The final 10% of our membership live outside the city (up to 5 miles from the dojo). The average age and salary in these areas vary greatly but lean towards the middle class market. Including this area would increase our potential market to over 600,000.
For purposes of this plan, we are going to address the city (pop. 133,936, average age 34.5) and surrounding cities within three miles of our dojo. This accounts for 90% of our current membership.
4.1.1 The “Real” Market
The “Real” market figures are based on research to determine if our noted territory, and the surrounding area is saturated. There are 43 dojos in an area with 350,000 potential members. Dropping those individuals under age 4 and over age 75 the number of potential members drop to 301,000.
Based on research provided by major research firms (available on the Internet) and the U.S. Census, up to 10% of the U.S. population has participated in Martial Arts of some type but only 2 to 4% are currently active in Martial Arts training.
Using this statistic we have determined that our potential market of 301,000 would include 12,000 active Martial Arts students (301,000 x .04). This number of active students (12,000) divided by the number of Martial Arts schools indicate, on average each dojo has 280 student members.
In this industry it is generally accepted that based on an average size dojo you need at-least 100 students to make money, 300 students creates capacity issues.
Using these numbers, we are confident that the market is not saturated, our dojo can easily meet our 200 student goal and there is considerable room for growth.

| Market Analysis | |||||||
| 2002 | 2003 | 2004 | 2005 | 2006 | |||
| Potential Customers | Growth | CAGR | |||||
| Children 4-14 | 2% | 40,100 | 40,822 | 41,557 | 42,305 | 43,066 | 1.80% |
| 15-29 | 2% | 47,500 | 48,355 | 49,225 | 50,111 | 51,013 | 1.80% |
| 30-49 | 3% | 160,350 | 165,161 | 170,116 | 175,219 | 180,476 | 3.00% |
| 50-75 | 1% | 53,050 | 53,581 | 54,117 | 54,658 | 55,205 | 1.00% |
| Total | 2.31% | 301,000 | 307,919 | 315,015 | 322,293 | 329,760 | 2.31% |
4.2 Target Market Segment Strategy
Our target market has been broken into three age segments, all within the city limits and surrounding area. The strategy is based on outside research, confirmed by our own internal survey: parents want their children to learn karate to build confidence and to learn self-defense, adults take karate for exercise and self-defense, and seniors take karate for social aspects and exercise.
While not specifically addressed, we will be placing emphasis on the Hispanic (Latino) market where we are already a leader. We are also going to address those ZIP codes in higher income brackets within our market, but not specifically in this plan.
Our target market breakdown is as follows:
- Parents of kids ages 4-14: This market, while the smallest of potential clients, offers the most potential for new members. This group accounts for 50% of our current membership of which 67% are male and 33% female. The male/female breakdown corresponds with national survey results. However, our key is to grow our youth share to 60% of total membership, more in-line with national figure. This group includes those individuals who think karate is “cool” and enjoy physical challenge. In addition, parents desire their children to gain self-confidence and discipline, karate is one method of achieving that goal.
- Adults 30-49: This market offers the largest base of potential students and accounts for 28% of current membership. We expect to maintain the 28% figure. Targeting this group will be to offer an alterative to health clubs and/or fitness centers. In addition, this group “controls” our number one market, their kids.
- Adults over 50: This is our unknown market. This group only accounts for 7% of our current membership. It is felt that our traditional karate services may be too rigorous and may not meet their “social” and “exercise” needs. We are however approaching this market in a different manner, which will be explained later in this plan.
4.2.1 Market Needs
A needs analysis was taken of current members. This analysis was compared with a national survey, reflecting similar results. Our marketing efforts will be to address the needs of these groups in the order given:
- Kids 4-14 (as outlined by both the kids and their parents): self-confidence, fun, exercise, discipline, self-defense and socialization.
- Ages 30-49: exercise, self-defense, stress reduction and weight control.
- Ages 50+: exercise, stress reduction and socialization.
4.2.2 Market Trends
In the mid-1960’s there was a boom in Martial Arts studios (dojos) partially brought on by the success of Bruce Lee movies and the TV show Kung Fu. In the mid-1980’s, as interest in Martial Arts waned there was move towards offering children’s programs. In the mid-1990’s it was estimated that 5 to 10 million Americans (2-4% of the U.S. population) are active in some form of Martial Arts training.
Recent trends such as the popularity of the movie “Crouching Tiger, Hidden Dragon” not-so surprisingly caused a mini-surge in the number of new applicants. In addition, Martial Arts for kids has shown a trend towards more activities and less “traditional” training. It has been noted that today’s kids (brought up in the fast paced video age) have a lower level of patience, want to be involved in “movie” type karate styles (ie; Matrix, Shanghai Noon, Karate Kid and Power Rangers) and are more demanding of their time.
Another trend is that larger health/fitness organizations are moving into the Martial Arts field and a general consolidation is occuring. Companies such as Bally Total Fitness, 24 Hour Fitness and Gold’s Gym are offering kick-boxing and other forms of group “soft” Martial Arts training such as Tai Chi or Yoga.
Finally, there is a push in the health/fitness industry to attract the over 50 crowd. Fitness clubs have a difficult time applying their muscle building, fast-paced fitness programs into this market. However, the over 50 group is expected to be marketed to more aggressively as fitness/health clubs realize the potential of the “baby boomers” and the fact that baby boomers have both the time and money to pursue outside recreational activities.
4.2.3 Market Growth
The U.S. Census (2000) shows our city, over the past 10 years has been growing at an average annual rate of 1.8% (2.5% this last year). The central location of the city and proximity to Los Angeles is creating a boom in adults age 30 to 50 with young children, who can afford the ever increasing cost of homes in the area.
A national survey recently taken two years ago indicated there were approximately six million Americans actively involved in Martial Arts training. The survey indicated that a 14% growth rate was expected in the upcoming years as Americans moved towards a more healthy lifestyle. This data was in part supported by data obtained from other sources. We have noted that this trend was occuring until the September 11, 2001 disaster. Data after the disaster is not yet available, but it has impacted the industry, whether that impact is permanent or temporary has yet to be determined.
Within our described market, over the past decade, the Asian community, the smallest in number, at 11% of the population has shown the fastest growth at 40%, this is followed by the Hispanic (Latino) community, representing 28.9% of the population, showing a substantial 26.5% increase. The African-American community representing 12.7% of the population has decreased 25% over the last ten years and the White community which represents 43.7% of the total population has declined 13%. This trend towards a higher Hispanic (Latino) market mixes well into our future plans.
Two things were noted in our “over 50” market based on a study from the local newspaper, with data provided from the U.S. Census: the fastest growing market in the city (3%) are those in their 40’s to 50’s however, the market for individuals over 65 is flat and maybe actually shrinking. This could be be a result of the high cost of living in the area, causing many seniors on retirement income to move to more affordable locations.
The senior market, while showing little growth has considerable potential. The senior market has not been tapped in the Martial Arts industry (only 7% of our membership). The Health Club Trend Report (providing data to American Sports Data, Inc) recently ranked seniors as the third-largest population in health clubs today at 22%. These older adults enjoy the social aspects of membership and, have the time and income to participate. This group is involved in mostly “softer” exercise routines, including recumbent cycling, yoga/tai chi, and pool activities. The report goes further to state this group has “not” been aggressively marketed, yet has increased 131% over the past decade.
4.3 Service Business Analysis
The business of running a dojo is similar to that of running a health/fitness club, membership is everything. A dojo is a Japanese word defined as, “a training hall where one can practice some sort of physical endeavor.” Martial Arts falls under the SIC (Standard Industrial Code) 7999 – Amusement and Recreational Services. Under this heading we find groupings from Astrologers to Card Rooms, from Carnival Operations to Yoga. In other words the code is too broad to provide solid analysis benefit, but it will be addressed in our comparative ratios analysis at the end of this plan.
To give some perspective, we have noted that Martial Arts, as an industry, according to the U.S. Census has the same approximate number of participants as:
- Table tennis;
- Badminton;
- Scuba diving;
- Mountain biking.
Martial Arts is a “pulverized” industry consisting primarily of thousands of small independent dojos (schools), most belong to one of hundreds of loosely organized Martial Arts Associations (usually divided by style type). There is no one organization which could be called a leader in the industry, however the International Karate Association, American Tae kwan do Association, American Karate Association and U.S. Martial Arts Association are some of the largest in the United States.
Two other industries should be considered in any competitive analysis. The health and fitness club industry (Bally Total Fitness, Gold’s Gym, Bodies in Motion, 24 Hour Fitness) and the non-profits (YMCA, YWCA and local schools) are in competition for the same group of potential customers.
4.3.1 Competition and Buying Patterns
The nature of the business of a dojo is to offer a facility with Martial Arts training. Membership is everything and turnover (attrition) in the industry is high. Several reports place the average turnover of a dojo at 40 to 60%. Selection of a dojo by a potential member is, in-part done by the style of Martial Art (karate, judo, kung-fu or kick-boxing) the member wishes to participate. However, selection of a dojo by a new student is more basic in nature.
A recent local survey (supported by national survey results) show that dojo selection is based on the following (most popular first):
- Friends/family attending;
- Location;
- Cost;
- Facility environment;
- Class schedule (times);
- Friendliness of instructors (personal attention);
- Class size.
Potential members are most aware of a dojo’s physical existence because:
- Friends and family (65%);
- Drive/walk by storefront (23%);
- Yellow Page/media advertising (12%).
4.3.2 Main Competitors
We have identified our city and its surrounding area as the boundaries for the business plan. This covers approximately 36 square miles and 350,000 potential members. Within this boundary there are 43 Martial Arts programs and 23 health and fitness clubs. We have narrowed the scope of “direct” competition to four “like” dojos in our immediate area and two health/fitness clubs.
Numerous grade and high schools and two local colleges provide physical education classes nearby. However they have limited Martial Arts programs and it is felt they are more of a potential partner, then competitor.
4.3.3 Competing Dojos and Health Clubs
Four dojos have been identified as being the most competitive with our location. All have a physical facility (dojo), all offer traditional Martial Arts training (different styles), all offer competitive pricing and are open Monday thru Saturday (closed Sunday). In addition, each dojo Shihan (head instructor) is well versed in his/her field and well respected in the community.
Three health/fitness clubs have been identified as being the most competitive with our location. They compete primarily for the single 18 to 40 market, but are moving toward offerings for the younger and older age groups which is something we must watch carefully. All have national advertising programs and have significant Yellow Page presence.
Strategy and Implementation Summary
Our overall strategy and implementation plan is based on the fact that City Dojo has never had an “on paper” business or marketing plan. Over the past five years the dojo has not advertised its services outside internal efforts and still has been able to support a low but consistent flow of new members.
The dojo will focus its efforts on a broad market, in a very competitive field. Considerable research was done to establish the fact that there is opportunity in three areas: the youth market ages 4 to 14, the adult market ages 30 to 49, and the senior market ages 50+.
A special note should be taken that a large potential market is not being addressed. The ages 15 to 29 market is considered to volatile and competitive (health/fitness clubs, school activities, etc.) for our services at this time. While we certainly accept membership at this age, we do not plan to actively market this group.
5.1 Competitive Edge
Strengths:
- Dojo established for 38 years (since 1964).
- Dojo location and ample lighted parking.
- Shihan very knowledgeable (6th degree black belt) and an internationally recognized trainer.
- Shihan and Sensei have strong desire and patience to teach.
- Shihan and most Sen sai speak Spanish.
- Competitive pricing and hours of operation.
- Solid untapped database from which to market.
- Over 300 Black Belts graduates since inception.
Weaknesses:
- Shihan’s business savvy.
- Dojo facility needs remodeling.
- Student attrition.
- Website not competitive.
- No advertising or marketing plan.
- No budget.
- Do not offer Tai Chi (alternative “soft” Martial Arts) as most competitors do.
5.2 Sales Strategy
The overall strategy is to increase membership to 200 by year-end 2004, which is 80% of the dojo capacity and an aggressive three year growth of 307%. Through marketing efforts we will make our potential customers aware of our dojo. From this awareness we will increase the number of potential members that walk in our front door.
These new potential members will be met by either the Shihan or a well-trained sales associate/receptionist who will have all sales materials, promotions and a computer for data entry. The sales associate will be empowered to offer our promotions, however if the potential member is interested in joining, an instructor and/or the Shihan will be made available for immediate consultation.
5.2.1 Sales Forecast
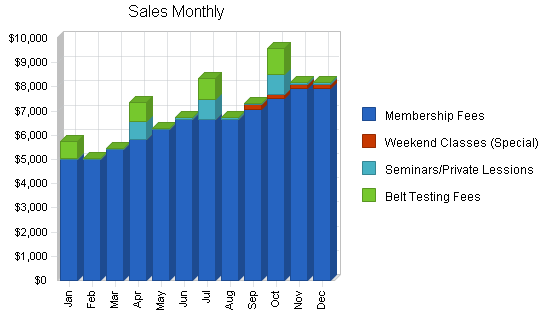
The following chart and table reflect our aggressive, but obtainable sales forecast. Membership is projected to grow at a steady pace, leveling off during summer months, our slower time of year. Membership costs are expected to decrease as we better control student turnover.
The special classes include rent of our facilities ($200 a month) to contract instructors who are experts in Tai Chi or Yoga. This class time will consist of one-two hour class per week (four a month) on Saturday and/or Sunday when the dojo has been traditionally closed. Facility rental is projected conservatively for one group in 2002, two in 2003 and three by 2004.
Seminars are projected based on historic demand for the Shihan’s services. Belt testing is held quarterly and fees traditionally track membership.
| Sales Forecast | |||
| 2002 | 2003 | 2004 | |
| Sales | |||
| Membership Fees | $77,918 | $136,250 | $178,333 |
| Weekend Classes (Special) | $800 | $4,800 | $7,200 |
| Seminars/Private Lessions | $2,785 | $3,600 | $5,100 |
| Belt Testing Fees | $3,432 | $5,794 | $7,819 |
| Total Sales | $84,935 | $150,444 | $198,452 |
| Direct Cost of Sales | 2002 | 2003 | 2004 |
| Membership Fees | $16,997 | $21,250 | $20,863 |
| Weekend Classes (Special) | $600 | $800 | $1,000 |
| Seminars/Private Lessions | $240 | $300 | $400 |
| Belt Testing Fees | $490 | $660 | $930 |
| Subtotal Direct Cost of Sales | $18,327 | $23,010 | $23,193 |
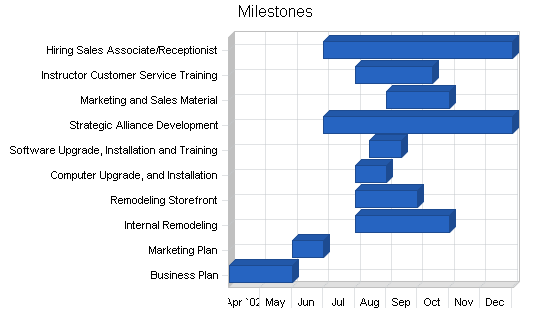
5.3 Milestones
The milestones shown in the chart below reflect the major changes that we anticipate for the dojo in 2002. The goals are very aggressive for a business the size of the dojo, however the commitment by those individuals assigned is solid and goals established will be met.
| Milestones | |||||
| Milestone | Start Date | End Date | Budget | Manager | Department |
| Business Plan | 4/1/2002 | 6/1/2002 | $200 | ABC | Investor |
| Marketing Plan | 6/1/2002 | 7/1/2002 | $200 | ABC | Investor |
| Internal Remodeling | 8/1/2002 | 11/1/2002 | $9,000 | ABC | Owner |
| Remodeling Storefront | 8/1/2002 | 10/1/2002 | $1,000 | ABC | Owner |
| Computer Upgrade, and Installation | 8/1/2002 | 9/1/2002 | $3,000 | ABC | Investor |
| Software Upgrade, Installation and Training | 8/15/2002 | 9/15/2002 | $1,000 | ABC | Consultant |
| Strategic Alliance Development | 7/1/2002 | 1/1/2003 | $0 | ABC | Owner |
| Marketing and Sales Material | 9/1/2002 | 11/1/2002 | $500 | ABC | Investor |
| Instructor Customer Service Training | 8/1/2002 | 10/15/2002 | $500 | ABC | Instructor |
| Hiring Sales Associate/Receptionist | 7/1/2002 | 1/1/2003 | $2,500 | ABC | Owner |
| Totals | $17,900 | ||||
5.4 Marketing Strategy
In our Marketing Strategy we realize our target is very broad, kids 4 to 14 and adults 30 to 49. To address this market we must understand that our dojo is our “showplace” and in marketing efforts we want potential members to judge our “book by its cover.”
- Our first strategy will be to remodel the dojo into an “exciting,” “fun,” “traditional” place where our members will, “want to train, not have to train.”
- Secondly, an internal strategy, we want to address our attrition ratio with training of the instructors.
- Third, we will utilize “paper” media for advertising our facility to our market.
- Finally, we must address a strategy to market our newly remodeled facility for rental to others for classes on weekends when the dojo has been traditionally closed.
5.4.1 Promotion Strategy
Based on buying pattern research, we determined “word of mouth” was by far the most successful means of promoting our dojo, followed by the “storefront” and finally “advertising.” With this in mind we have established the following promotional strategies:
Our members (students) must like who we are and what we do, in order for us to succeed.
- To assist in promotion, we will offer an incentive to current members who bring in new members.
We want potential members to judge our “book by its cover.”
- Our storefront (external and internal) will be redesigned to sell itself. People will want to go in just to see what a dojo looks like.
- We will be holding an annual for charity “kata” tournament at the dojo with a “significant” purse. Proceeds will go to a local charity, in hope of gaining news play.
- Shihan will continue to offer free karate (self-defense) seminars to local grade schools and retirement communities.
- Our Web page will reflect our new image.
For the first time in five years we will have a significant advertising budget.
- The Yellow Pages, the #1 source of new recruitment in media. We will purchase “competitive” ad space.
- City Weekly, the local “entertainment and news” paper shows promise and we will be experiment placing and tracking ads.
5.4.2 Marketing Programs
In our Marketing Strategy our primary market will be kids 4 to 14 and adults over 30 to 49. A separate market for senior adults (50+) will be addressed separately.
To address our largest market we must understand that our dojo is our “showplace” and in our marketing efforts we want potential customers to judge our “book by its cover.”
- Our most important marketing program is to remodel the dojo into an “exciting,” “fun,” “traditional” place where our members will, “want to train, not have to train.” Emphasis will be placed on a kid friendly environment, that adults can enjoy too. The Shihan will coordinate the effort, dojo design will be a composite of suggestions from Shihan (master instructor) and Sensei (instructors) with a touch of Feng Shui. A budget of $10,000 has been established for this project which will begin August 1, 2002. Our marketing research indicates a “fantastic” looking dojo will bring in more students at all market levels. Increased membership will tell the story.
- Another key marketing program is to introduce simple methods of training to our instructors to reinforce students, “want to train, not have to train” concepts. A Sensei (teacher by trade) will be responsible or putting together this program, with a budget of $500 for special classroom (w/dinner) training of the instructor team at a pleasant facility. This program is intended to reduce high level of membership attrition currently at 40% and the goal is to implement the program by October 15, 2002.
- Our final program is to advertise in the Yellow Pages and Weekly newspaper. Shihan will head up this program. A budget of $5,000 has been established. Both programs will be tracked, but the Weekly newspaper will offer more clearly defined (short term) success to specific advertising promotions and plans can be adjusted accordingly.
The other market that we will address is the rental of our facility to others, for classes on weekends when the dojo has been traditionally closed. Emphasis on this Marketing Strategy will be to bring in outside contract instructors and allow them access to our newly remodeled facility. Our goal is to have 3 – two hour classes each week at our facility on Saturday/Sunday by year-end 2004, primarily for those over 50 years old. This strategy will help us maximize our dojo earning potential and open the doors for the 50+ market.
- We will create a very professional brochure on what our facility has to offer. Shihan will head up this program, with a budget of $500 (available in Nov. 2002).
- Second, we will direct mail inquiries to “soft” Martial Arts (yoga and tai chi) instructors concerning possible agreements of offering their classes in our facilities. Emphasis will be to allow us to open the doors for those who want to teach but don’t want the ongoing expense or worry of opening their own studio. Shihan will head this program. Initially there is no budget.
5.4.3 Positioning Statement
For adults in the city who want to learn and/or have their children learn the art of karate and to build self-confidence, we offer competitive pricing, convenient hours, and quality instruction, under the leadership of a 6th degree black belt, and internationally recognized instructor. Unlike our competition, we offer the most modern of facilities, in a convenient location with ample parking, and programs that are entertaining, adventuresome, with a hint of tradition.
5.4.4 Pricing Strategy
We must offer our services at a pricing structure that will both meet our financial needs and the needs of our members. Our current pricing structure of $1,000 annual membership is competitive for schools that own their own facility. We will keep this fee but offer promotional discounts to current members for bringing in new students and/or assisting in improvements to the dojo. We have failed in the past to offer consistent promotional pricing strategies of which we will address.
There are as many introductory promotional pricing packages as there are dojos. All the programs are designed to draw or introduce the potential member to the dojo without requiring them to sign a long-term contract. All offer the same basic package which includes anywhere from 1-3 months training, 1-3 private classes with gi (uniform), and prices varying from $29.00 to $99.00.
Our pricing strategy is to offer a very short introductory package of two personal training sessions and a gi for $29. If the potential member wants to continue, we will offer a six month introductory package at $299. After six months, if the potential member wants to continue we will offer the annual contract at $1,000 (with discounts for payment upfront). Billing options monthly or quarterly will be offered.
In addition, we will be working to identify other pricing structures which address families and lower income students.
5.5 Strategic Alliances
City Dojo’s Shihan is well known and has considerable experience in the local market. We are going to use this experience and build on our current “loosely” defined strategic alliances.
- There are a number of Asian and Mexican food establishments surrounding the dojo. We will contact select establishments for an agreed brochure trade, with emphasis on a positive well designed showcase that will benefit both parties with possible discounts made available.
- Another alliance is to work with the local Community College to attempt to make available a class that will allow physical education credit. The goal is to establish a relationship with the school by January 2003, for Spring classes 2003. We also will try to offer classes through the schools adult education program.
Management Summary
Shihan has been the owner of the dojo since 1975. He currently has a contract bookkeeper and no employees. The dojo is self running. The Shihan oversees operations and provides the majority of instruction, however he has a inner circle of five black belt instructors who handle training assignments when the Shihan is not available.
6.1 Personnel Plan
While currently the dojo has no employees, in August 2002, the Shihan expects to hire a part-time sales associate/receptionist to handle the expected increase in new membership.
The dojo has a loosely organized Board of Advisors for instructional issues of which we are formalizing. This group is made up of of five key black belt instructors (Sensei).
In addition, the dojo is establishing another Board of Advisors for business issues, this team will consist of a five member team each with experience in: general business (insurance), accounting, small business, legal issues and human resources.
| Personnel Plan | |||
| 2002 | 2003 | 2004 | |
| Owner (Shihan) | $9,500 | $40,000 | $60,000 |
| Sales Associate/Receptionist | $2,500 | $12,000 | $12,000 |
| Total People | 2 | 2 | 2 |
| Total Payroll | $12,000 | $52,000 | $72,000 |
6.2 Management Team Gaps
The dojo itself is a small business. However, it is putting together a quality management team (Board of Advisors) to assist in business matters. Gaps in legal, tax, marketing and personnel will be covered by the Board of Advisor team. Our weakest area is in the technical (computer) field, however we are identifying several candidates who could be solid additions to the Board of Advisors for the dojo in this expertise.
Financial Plan
The dojo financial plan is simple. We want to become a profitable business for the owner and any investors. We are moving from a part-time to full-time business and expect our financials to reflect that change. Our growth is predicated on introducing a newly remodeled dojo and a marketing and promotional strategy for the first time. Our goal of 200 members by year-end 2004 is very obtainable and if this goal is met we will have a very profitable business. Our long-term goal is to have enough cash on-hand and a solid credit history to pursue our ultimate goal of expansion.
7.1 Important Assumptions
It was necessary to make certain broad-based assumptions in planning for the future. The financial assumptions are listed below in the table. In addition, we have made several other important assumptions:
- The economy will grow at a steady pace, without a major recession.
- There will be no major change in the Martial Arts industry other then those discussed in trends.
- The State will not have impact legislation on the unregulated Martial Arts industry.
| General Assumptions | |||
| 2002 | 2003 | 2004 | |
| Plan Month | 1 | 2 | 3 |
| Current Interest Rate | 12.00% | 12.00% | 12.00% |
| Long-term Interest Rate | 9.00% | 9.00% | 9.00% |
| Tax Rate | 25.42% | 25.00% | 25.42% |
| Other | 0 | 0 | 0 |
7.2 Key Financial Indicators
The following financial chart shows past and projected three years for the dojo. In the past there was no real marketing effort or business plan. With the introduction of this new business plan we have high expectations for growth. In 2002, we expect to increase membership from 60 to 95, resulting in an increase in sales of 30%. In 2003, we expect full impact of our 2002 plans to take affect and anticipate membership to increase from 95 to 165, resulting in an increase in sales of 77%. In 2004 we expect to meet our goal of 200 members and realize an increase in sales of 31%.
At some point in the future we will make adjustments to our business plan to explore alternatives (as addressed in future services) and will begin to work on reducing overall expenses.

7.3 Projected Profit and Loss
Monthly profit for the first year varies considerably as we aggressively seek improvements and begin marketing our business. However, as year two of the plan approaches, our moves in year one should begin to take hold. Bottom-line profits shown in the chart are deceiving as a significant increase in salary to the owner is reflected (as the dojo changes from a part-time to full-time business). We expect our efforts to control attrition to start affecting our cost of sales, which in-turn will improve our gross margin.
Legal fees in 2002 reflect our change in legal ownership, from a sole proprietorship to a limited liability company. Payroll increases in 2003 and 2004 reflect our change from a part-time business to full-time.


| Pro Forma Profit and Loss | |||
| 2002 | 2003 | 2004 | |
| Sales | $84,935 | $150,444 | $198,452 |
| Direct Cost of Sales | $18,327 | $23,010 | $23,193 |
| Other | $0 | $1,000 | $1,000 |
| Total Cost of Sales | $18,327 | $24,010 | $24,193 |
| Gross Margin | $66,608 | $126,434 | $174,259 |
| Gross Margin % | 78.42% | 84.04% | 87.81% |
| Expenses | |||
| Payroll | $12,000 | $52,000 | $72,000 |
| Sales and Marketing and Other Expenses | $19,404 | $22,100 | $25,500 |
| Depreciation | $0 | $0 | $0 |
| Leased Equipment | $4,800 | $5,000 | $5,000 |
| Utilities | $4,844 | $5,000 | $5,500 |
| Telephone | $3,605 | $4,000 | $4,500 |
| Insurance | $4,260 | $4,800 | $4,800 |
| Rent | $9,000 | $9,000 | $9,000 |
| Payroll Taxes | $1,800 | $7,800 | $10,800 |
| Other | $0 | $0 | $0 |
| Total Operating Expenses | $59,713 | $109,700 | $137,100 |
| Profit Before Interest and Taxes | $6,895 | $16,734 | $37,159 |
| EBITDA | $6,895 | $16,734 | $37,159 |
| Interest Expense | $3,683 | $4,199 | $3,560 |
| Taxes Incurred | $768 | $3,134 | $8,540 |
| Net Profit | $2,444 | $9,401 | $25,059 |
| Net Profit/Sales | 2.88% | 6.25% | 12.63% |
7.4 Break-even Analysis
The following table and chart show our break-even point for the next year.

| Break-even Analysis | |
| Monthly Revenue Break-even | $6,345 |
| Assumptions: | |
| Average Percent Variable Cost | 22% |
| Estimated Monthly Fixed Cost | $4,976 |
7.5 Projected Cash Flow
Like profit, our first year monthly cash flow varies considerably. Current cash flow is expected to meet our needs, however we are anticipating a significant increase in cash flow due to a long-term loan ($20,000) in August 2002 to address our immediate remodeling and marketing efforts. This money (planned loan, capital investment) will immediately be put to use and place the dojo into a better cash position in-case something unexpected occurs. In the following years, excess cash will be used to finance our more aggressive future services plans.

| Pro Forma Cash Flow | |||
| 2002 | 2003 | 2004 | |
| Cash Received | |||
| Cash from Operations | |||
| Cash Sales | $84,935 | $150,444 | $198,452 |
| Subtotal Cash from Operations | $84,935 | $150,444 | $198,452 |
| Additional Cash Received | |||
| Sales Tax, VAT, HST/GST Received | $0 | $0 | $0 |
| New Current Borrowing | $0 | $0 | $0 |
| New Other Liabilities (interest-free) | $0 | $0 | $0 |
| New Long-term Liabilities | $20,000 | $0 | $0 |
| Sales of Other Current Assets | $0 | $0 | $0 |
| Sales of Long-term Assets | $0 | $0 | $0 |
| New Investment Received | $0 | $0 | $0 |
| Subtotal Cash Received | $104,935 | $150,444 | $198,452 |
| Expenditures | 2002 | 2003 | 2004 |
| Expenditures from Operations | |||
| Cash Spending | $12,000 | $52,000 | $72,000 |
| Bill Payments | $69,112 | $87,603 | $100,378 |
| Subtotal Spent on Operations | $81,112 | $139,603 | $172,378 |
| Additional Cash Spent | |||
| Sales Tax, VAT, HST/GST Paid Out | $0 | $0 | $0 |
| Principal Repayment of Current Borrowing | $3,252 | $3,252 | $3,252 |
| Other Liabilities Principal Repayment | $0 | $0 | $0 |
| Long-term Liabilities Principal Repayment | $460 | $2,760 | $2,760 |
| Purchase Other Current Assets | $0 | $0 | $0 |
| Purchase Long-term Assets | $15,000 | $0 | $0 |
| Dividends | $0 | $0 | $0 |
| Subtotal Cash Spent | $99,824 | $145,615 | $178,390 |
| Net Cash Flow | $5,111 | $4,829 | $20,062 |
| Cash Balance | $6,611 | $11,439 | $31,502 |
7.6 Projected Balance Sheet
The balance sheet in the following table reflect considerable first year activity as we implement the business plan. Long-term liabilities double in the first year as we borrow for improvements and plan implementation, however this liability is workable and in subsequent years remain under control. Net worth increases in 2003 and 2004 based on anticipated increases in sales.
| Pro Forma Balance Sheet | |||
| 2002 | 2003 | 2004 | |
| Assets | |||
| Current Assets | |||
| Cash | $6,611 | $11,439 | $31,502 |
| Other Current Assets | $0 | $0 | $0 |
| Total Current Assets | $6,611 | $11,439 | $31,502 |
| Long-term Assets | |||
| Long-term Assets | $55,000 | $55,000 | $55,000 |
| Accumulated Depreciation | $0 | $0 | $0 |
| Total Long-term Assets | $55,000 | $55,000 | $55,000 |
| Total Assets | $61,611 | $66,439 | $86,502 |
| Liabilities and Capital | 2002 | 2003 | 2004 |
| Current Liabilities | |||
| Accounts Payable | $5,879 | $7,319 | $8,334 |
| Current Borrowing | $11,748 | $8,496 | $5,244 |
| Other Current Liabilities | $0 | $0 | $0 |
| Subtotal Current Liabilities | $17,627 | $15,815 | $13,578 |
| Long-term Liabilities | $34,540 | $31,780 | $29,020 |
| Total Liabilities | $52,167 | $47,595 | $42,598 |
| Paid-in Capital | $0 | $0 | $0 |
| Retained Earnings | $7,000 | $9,444 | $18,845 |
| Earnings | $2,444 | $9,401 | $25,059 |
| Total Capital | $9,444 | $18,845 | $43,904 |
| Total Liabilities and Capital | $61,611 | $66,439 | $86,502 |
| Net Worth | $9,444 | $18,845 | $43,904 |
7.7 Business Ratios
As indicated in our “Service Business Analysis” the Martial Arts industry is not properly reflected in the SIC Code provided (7999). However, with this said, we have made some preliminary business ratio comparisons using the SIC (2000 figures). The results are very favorable.
| Ratio Analysis | ||||
| 2002 | 2003 | 2004 | Industry Profile | |
| Sales Growth | 30.47% | 77.13% | 31.91% | 5.73% |
| Percent of Total Assets | ||||
| Other Current Assets | 0.00% | 0.00% | 0.00% | 33.26% |
| Total Current Assets | 10.73% | 17.22% | 36.42% | 43.21% |
| Long-term Assets | 89.27% | 82.78% | 63.58% | 56.79% |
| Total Assets | 100.00% | 100.00% | 100.00% | 100.00% |
| Current Liabilities | 28.61% | 23.80% | 15.70% | 21.91% |
| Long-term Liabilities | 56.06% | 47.83% | 33.55% | 28.81% |
| Total Liabilities | 84.67% | 71.64% | 49.25% | 50.72% |
| Net Worth | 15.33% | 28.36% | 50.75% | 49.28% |
| Percent of Sales | ||||
| Sales | 100.00% | 100.00% | 100.00% | 100.00% |
| Gross Margin | 78.42% | 84.04% | 87.81% | 100.00% |
| Selling, General & Administrative Expenses | 75.58% | 77.77% | 75.10% | 76.43% |
| Advertising Expenses | 6.24% | 4.92% | 4.28% | 2.77% |
| Profit Before Interest and Taxes | 8.12% | 11.12% | 18.72% | 1.89% |
| Main Ratios | ||||
| Current | 0.38 | 0.72 | 2.32 | 1.18 |
| Quick | 0.38 | 0.72 | 2.32 | 0.80 |
| Total Debt to Total Assets | 84.67% | 71.64% | 49.25% | 61.12% |
| Pre-tax Return on Net Worth | 34.01% | 66.52% | 76.53% | 1.76% |
| Pre-tax Return on Assets | 5.21% | 18.87% | 38.84% | 4.52% |
| Additional Ratios | 2002 | 2003 | 2004 | |
| Net Profit Margin | 2.88% | 6.25% | 12.63% | n.a |
| Return on Equity | 25.88% | 49.89% | 57.08% | n.a |
| Activity Ratios | ||||
| Accounts Payable Turnover | 11.99 | 12.17 | 12.17 | n.a |
| Payment Days | 29 | 27 | 28 | n.a |
| Total Asset Turnover | 1.38 | 2.26 | 2.29 | n.a |
| Debt Ratios | ||||
| Debt to Net Worth | 5.52 | 2.53 | 0.97 | n.a |
| Current Liab. to Liab. | 0.34 | 0.33 | 0.32 | n.a |
| Liquidity Ratios | ||||
| Net Working Capital | ($11,016) | ($4,375) | $17,924 | n.a |
| Interest Coverage | 1.87 | 3.99 | 10.44 | n.a |
| Additional Ratios | ||||
| Assets to Sales | 0.73 | 0.44 | 0.44 | n.a |
| Current Debt/Total Assets | 29% | 24% | 16% | n.a |
| Acid Test | 0.38 | 0.72 | 2.32 | n.a |
| Sales/Net Worth | 8.99 | 7.98 | 4.52 | n.a |
| Dividend Payout | 0.00 | 0.00 | 0.00 | n.a |
Appendix
| Sales Forecast | |||||||||||||
| Jan | Feb | Mar | Apr | May | Jun | Jul | Aug | Sep | Oct | Nov | Dec | ||
| Sales | |||||||||||||
| Membership Fees | 0% | $5,000 | $5,000 | $5,417 | $5,833 | $6,250 | $6,667 | $6,667 | $6,667 | $7,083 | $7,500 | $7,917 | $7,917 |
| Weekend Classes (Special) | 0% | $0 | $0 | $0 | $0 | $0 | $0 | $0 | $0 | $200 | $200 | $200 | $200 |
| Seminars/Private Lessions | 0% | $50 | $35 | $50 | $750 | $50 | $50 | $800 | $50 | $50 | $800 | $50 | $50 |
| Belt Testing Fees | 0% | $675 | $0 | $0 | $788 | $0 | $0 | $900 | $0 | $0 | $1,069 | $0 | $0 |
| Total Sales | $5,725 | $5,035 | $5,467 | $7,371 | $6,300 | $6,717 | $8,367 | $6,717 | $7,333 | $9,569 | $8,167 | $8,167 | |
| Direct Cost of Sales | Jan | Feb | Mar | Apr | May | Jun | Jul | Aug | Sep | Oct | Nov | Dec | |
| Membership Fees | $1,300 | $1,300 | $1,383 | $1,467 | $1,550 | $1,633 | $1,300 | $1,300 | $1,363 | $1,425 | $1,488 | $1,488 | |
| Weekend Classes (Special) | $50 | $50 | $50 | $50 | $50 | $50 | $50 | $50 | $50 | $50 | $50 | $50 | |
| Seminars/Private Lessions | $10 | $10 | $10 | $50 | $10 | $10 | $50 | $10 | $10 | $50 | $10 | $10 | |
| Belt Testing Fees | $110 | $0 | $0 | $110 | $0 | $0 | $120 | $0 | $0 | $150 | $0 | $0 | |
| Subtotal Direct Cost of Sales | $1,470 | $1,360 | $1,443 | $1,677 | $1,610 | $1,693 | $1,520 | $1,360 | $1,423 | $1,675 | $1,548 | $1,548 | |
| Personnel Plan | |||||||||||||
| Jan | Feb | Mar | Apr | May | Jun | Jul | Aug | Sep | Oct | Nov | Dec | ||
| Owner (Shihan) | 0% | $500 | $500 | $500 | $500 | $500 | $1,000 | $1,000 | $1,000 | $1,000 | $1,000 | $1,000 | $1,000 |
| Sales Associate/Receptionist | 0% | $0 | $0 | $0 | $0 | $0 | $0 | $0 | $500 | $500 | $500 | $500 | $500 |
| Total People | 1 | 1 | 1 | 1 | 1 | 1 | 1 | 2 | 2 | 2 | 2 | 2 | |
| Total Payroll | $500 | $500 | $500 | $500 | $500 | $1,000 | $1,000 | $1,500 | $1,500 | $1,500 | $1,500 | $1,500 | |
| General Assumptions | |||||||||||||
| Jan | Feb | Mar | Apr | May | Jun | Jul | Aug | Sep | Oct | Nov | Dec | ||
| Plan Month | 1 | 2 | 3 | 4 | 5 | 6 | 7 | 8 | 9 | 10 | 11 | 12 | |
| Current Interest Rate | 12.00% | 12.00% | 12.00% | 12.00% | 12.00% | 12.00% | 12.00% | 12.00% | 12.00% | 12.00% | 12.00% | 12.00% | |
| Long-term Interest Rate | 9.00% | 9.00% | 9.00% | 9.00% | 9.00% | 9.00% | 9.00% | 9.00% | 9.00% | 9.00% | 9.00% | 9.00% | |
| Tax Rate | 30.00% | 25.00% | 25.00% | 25.00% | 25.00% | 25.00% | 25.00% | 25.00% | 25.00% | 25.00% | 25.00% | 25.00% | |
| Other | 0 | 0 | 0 | 0 | 0 | 0 | 0 | 0 | 0 | 0 | 0 | 0 | |
| Pro Forma Profit and Loss | |||||||||||||
| Jan | Feb | Mar | Apr | May | Jun | Jul | Aug | Sep | Oct | Nov | Dec | ||
| Sales | $5,725 | $5,035 | $5,467 | $7,371 | $6,300 | $6,717 | $8,367 | $6,717 | $7,333 | $9,569 | $8,167 | $8,167 | |
| Direct Cost of Sales | $1,470 | $1,360 | $1,443 | $1,677 | $1,610 | $1,693 | $1,520 | $1,360 | $1,423 | $1,675 | $1,548 | $1,548 | |
| Other | $0 | $0 | $0 | $0 | $0 | $0 | $0 | $0 | $0 | $0 | $0 | $0 | |
| Total Cost of Sales | $1,470 | $1,360 | $1,443 | $1,677 | $1,610 | $1,693 | $1,520 | $1,360 | $1,423 | $1,675 | $1,548 | $1,548 | |
| Gross Margin | $4,255 | $3,675 | $4,024 | $5,694 | $4,690 | $5,024 | $6,847 | $5,357 | $5,910 | $7,894 | $6,619 | $6,619 | |
| Gross Margin % | 74.32% | 72.99% | 73.61% | 77.25% | 74.44% | 74.80% | 81.83% | 79.75% | 80.59% | 82.50% | 81.05% | 81.05% | |
| Expenses | |||||||||||||
| Payroll | $500 | $500 | $500 | $500 | $500 | $1,000 | $1,000 | $1,500 | $1,500 | $1,500 | $1,500 | $1,500 | |
| Sales and Marketing and Other Expenses | $1,747 | $987 | $1,387 | $1,187 | $1,087 | $1,187 | $4,087 | $2,187 | $1,187 | $1,587 | $1,387 | $1,387 | |
| Depreciation | $0 | $0 | $0 | $0 | $0 | $0 | $0 | $0 | $0 | $0 | $0 | $0 | |
| Leased Equipment | . | $400 | $400 | $400 | $400 | $400 | $400 | $400 | $400 | $400 | $400 | $400 | $400 |
| Utilities | $610 | $510 | $320 | $320 | $320 | $380 | $400 | $480 | $300 | $300 | $404 | $500 | |
| Telephone | $303 | $303 | $299 | $300 | $300 | $300 | $300 | $300 | $300 | $300 | $300 | $300 | |
| Insurance | $310 | $310 | $310 | $310 | $310 | $310 | $400 | $400 | $400 | $400 | $400 | $400 | |
| Rent | $750 | $750 | $750 | $750 | $750 | $750 | $750 | $750 | $750 | $750 | $750 | $750 | |
| Payroll Taxes | 15% | $75 | $75 | $75 | $75 | $75 | $150 | $150 | $225 | $225 | $225 | $225 | $225 |
| Other | $0 | $0 | $0 | $0 | $0 | $0 | $0 | $0 | $0 | $0 | $0 | $0 | |
| Total Operating Expenses | $4,695 | $3,835 | $4,041 | $3,842 | $3,742 | $4,477 | $7,487 | $6,242 | $5,062 | $5,462 | $5,366 | $5,462 | |
| Profit Before Interest and Taxes | ($440) | ($160) | ($17) | $1,852 | $948 | $547 | ($640) | ($885) | $848 | $2,432 | $1,253 | $1,157 | |
| EBITDA | ($440) | ($160) | ($17) | $1,852 | $948 | $547 | ($640) | ($885) | $848 | $2,432 | $1,253 | $1,157 | |
| Interest Expense | $260 | $257 | $254 | $252 | $249 | $246 | $244 | $391 | $388 | $385 | $381 | $377 | |
| Taxes Incurred | ($210) | ($104) | ($68) | $400 | $175 | $75 | ($221) | ($319) | $115 | $512 | $218 | $195 | |
| Net Profit | ($490) | ($313) | ($204) | $1,200 | $524 | $226 | ($663) | ($957) | $345 | $1,535 | $654 | $585 | |
| Net Profit/Sales | -8.56% | -6.21% | -3.72% | 16.28% | 8.32% | 3.36% | -7.92% | -14.25% | 4.70% | 16.04% | 8.01% | 7.17% | |
| Pro Forma Cash Flow | |||||||||||||
| Jan | Feb | Mar | Apr | May | Jun | Jul | Aug | Sep | Oct | Nov | Dec | ||
| Cash Received | |||||||||||||
| Cash from Operations | |||||||||||||
| Cash Sales | $5,725 | $5,035 | $5,467 | $7,371 | $6,300 | $6,717 | $8,367 | $6,717 | $7,333 | $9,569 | $8,167 | $8,167 | |
| Subtotal Cash from Operations | $5,725 | $5,035 | $5,467 | $7,371 | $6,300 | $6,717 | $8,367 | $6,717 | $7,333 | $9,569 | $8,167 | $8,167 | |
| Additional Cash Received | |||||||||||||
| Sales Tax, VAT, HST/GST Received | 0.00% | $0 | $0 | $0 | $0 | $0 | $0 | $0 | $0 | $0 | $0 | $0 | $0 |
| New Current Borrowing | $0 | $0 | $0 | $0 | $0 | $0 | $0 | $0 | $0 | $0 | $0 | $0 | |
| New Other Liabilities (interest-free) | $0 | $0 | $0 | $0 | $0 | $0 | $0 | $0 | $0 | $0 | $0 | $0 | |
| New Long-term Liabilities | $0 | $0 | $0 | $0 | $0 | $0 | $0 | $20,000 | $0 | $0 | $0 | $0 | |
| Sales of Other Current Assets | $0 | $0 | $0 | $0 | $0 | $0 | $0 | $0 | $0 | $0 | $0 | $0 | |
| Sales of Long-term Assets | $0 | $0 | $0 | $0 | $0 | $0 | $0 | $0 | $0 | $0 | $0 | $0 | |
| New Investment Received | $0 | $0 | $0 | $0 | $0 | $0 | $0 | $0 | $0 | $0 | $0 | $0 | |
| Subtotal Cash Received | $5,725 | $5,035 | $5,467 | $7,371 | $6,300 | $6,717 | $8,367 | $26,717 | $7,333 | $9,569 | $8,167 | $8,167 | |
| Expenditures | Jan | Feb | Mar | Apr | May | Jun | Jul | Aug | Sep | Oct | Nov | Dec | |
| Expenditures from Operations | |||||||||||||
| Cash Spending | $500 | $500 | $500 | $500 | $500 | $1,000 | $1,000 | $1,500 | $1,500 | $1,500 | $1,500 | $1,500 | |
| Bill Payments | $4,690 | $5,686 | $4,859 | $5,187 | $5,658 | $5,283 | $5,576 | $7,968 | $6,151 | $5,523 | $6,517 | $6,015 | |
| Subtotal Spent on Operations | $5,190 | $6,186 | $5,359 | $5,687 | $6,158 | $6,283 | $6,576 | $9,468 | $7,651 | $7,023 | $8,017 | $7,515 | |
| Additional Cash Spent | |||||||||||||
| Sales Tax, VAT, HST/GST Paid Out | $0 | $0 | $0 | $0 | $0 | $0 | $0 | $0 | $0 | $0 | $0 | $0 | |
| Principal Repayment of Current Borrowing | $271 | $271 | $271 | $271 | $271 | $271 | $271 | $271 | $271 | $271 | $271 | $271 | |
| Other Liabilities Principal Repayment | $0 | $0 | $0 | $0 | $0 | $0 | $0 | $0 | $0 | $0 | $0 | $0 | |
| Long-term Liabilities Principal Repayment | $0 | $0 | $0 | $0 | $0 | $0 | $0 | $0 | $0 | $0 | $230 | $230 | |
| Purchase Other Current Assets | $0 | $0 | $0 | $0 | $0 | $0 | $0 | $0 | $0 | $0 | $0 | $0 | |
| Purchase Long-term Assets | $0 | $0 | $0 | $0 | $0 | $0 | $0 | $5,000 | $5,000 | $5,000 | $0 | $0 | |
| Dividends | $0 | $0 | $0 | $0 | $0 | $0 | $0 | $0 | $0 | $0 | $0 | $0 | |
| Subtotal Cash Spent | $5,461 | $6,457 | $5,630 | $5,958 | $6,429 | $6,554 | $6,847 | $14,739 | $12,922 | $12,294 | $8,518 | $8,016 | |
| Net Cash Flow | $264 | ($1,422) | ($163) | $1,413 | ($129) | $163 | $1,520 | $11,978 | ($5,589) | ($2,725) | ($351) | $151 | |
| Cash Balance | $1,764 | $342 | $179 | $1,592 | $1,463 | $1,626 | $3,146 | $15,124 | $9,535 | $6,811 | $6,460 | $6,611 | |
| Pro Forma Balance Sheet | |||||||||||||
| Jan | Feb | Mar | Apr | May | Jun | Jul | Aug | Sep | Oct | Nov | Dec | ||
| Assets | Starting Balances | ||||||||||||
| Current Assets | |||||||||||||
| Cash | $1,500 | $1,764 | $342 | $179 | $1,592 | $1,463 | $1,626 | $3,146 | $15,124 | $9,535 | $6,811 | $6,460 | $6,611 |
| Other Current Assets | $0 | $0 | $0 | $0 | $0 | $0 | $0 | $0 | $0 | $0 | $0 | $0 | $0 |
| Total Current Assets | $1,500 | $1,764 | $342 | $179 | $1,592 | $1,463 | $1,626 | $3,146 | $15,124 | $9,535 | $6,811 | $6,460 | $6,611 |
| Long-term Assets | |||||||||||||
| Long-term Assets | $40,000 | $40,000 | $40,000 | $40,000 | $40,000 | $40,000 | $40,000 | $40,000 | $45,000 | $50,000 | $55,000 | $55,000 | $55,000 |
| Accumulated Depreciation | $0 | $0 | $0 | $0 | $0 | $0 | $0 | $0 | $0 | $0 | $0 | $0 | $0 |
| Total Long-term Assets | $40,000 | $40,000 | $40,000 | $40,000 | $40,000 | $40,000 | $40,000 | $40,000 | $45,000 | $50,000 | $55,000 | $55,000 | $55,000 |
| Total Assets | $41,500 | $41,764 | $40,342 | $40,179 | $41,592 | $41,463 | $41,626 | $43,146 | $60,124 | $59,535 | $61,811 | $61,460 | $61,611 |
| Liabilities and Capital | Jan | Feb | Mar | Apr | May | Jun | Jul | Aug | Sep | Oct | Nov | Dec | |
| Current Liabilities | |||||||||||||
| Accounts Payable | $4,500 | $5,524 | $4,686 | $4,998 | $5,482 | $5,100 | $5,308 | $7,762 | $5,968 | $5,305 | $6,316 | $5,813 | $5,879 |
| Current Borrowing | $15,000 | $14,729 | $14,458 | $14,187 | $13,916 | $13,645 | $13,374 | $13,103 | $12,832 | $12,561 | $12,290 | $12,019 | $11,748 |
| Other Current Liabilities | $0 | $0 | $0 | $0 | $0 | $0 | $0 | $0 | $0 | $0 | $0 | $0 | $0 |
| Subtotal Current Liabilities | $19,500 | $20,253 | $19,144 | $19,185 | $19,398 | $18,745 | $18,682 | $20,865 | $18,800 | $17,866 | $18,606 | $17,832 | $17,627 |
| Long-term Liabilities | $15,000 | $15,000 | $15,000 | $15,000 | $15,000 | $15,000 | $15,000 | $15,000 | $35,000 | $35,000 | $35,000 | $34,770 | $34,540 |
| Total Liabilities | $34,500 | $35,253 | $34,144 | $34,185 | $34,398 | $33,745 | $33,682 | $35,865 | $53,800 | $52,866 | $53,606 | $52,602 | $52,167 |
| Paid-in Capital | $0 | $0 | $0 | $0 | $0 | $0 | $0 | $0 | $0 | $0 | $0 | $0 | $0 |
| Retained Earnings | $3,000 | $7,000 | $7,000 | $7,000 | $7,000 | $7,000 | $7,000 | $7,000 | $7,000 | $7,000 | $7,000 | $7,000 | $7,000 |
| Earnings | $4,000 | ($490) | ($803) | ($1,006) | $194 | $718 | $944 | $281 | ($676) | ($331) | $1,204 | $1,858 | $2,444 |
| Total Capital | $7,000 | $6,510 | $6,197 | $5,994 | $7,194 | $7,718 | $7,944 | $7,281 | $6,324 | $6,669 | $8,204 | $8,858 | $9,444 |
| Total Liabilities and Capital | $41,500 | $41,764 | $40,342 | $40,179 | $41,592 | $41,463 | $41,626 | $43,146 | $60,124 | $59,535 | $61,811 | $61,460 | $61,611 |
| Net Worth | $7,000 | $6,510 | $6,197 | $5,994 | $7,194 | $7,718 | $7,944 | $7,281 | $6,324 | $6,669 | $8,204 | $8,858 | $9,444 |

