
The Pasta House Co.
Executive Summary
This business plan for The Pasta House Co. – Fenton (PHC) reflects the opportunity to purchase the assets and leasehold improvements of the restaurant currently operating as JD Drews. The current owner is interested in selling the operations, as the store is not doing the volume he thought it would and he would like to get out of this location and the debt service he has incurred. My goal is to submit this business plan to his bank in the event he is unable to make loan or rent payments and defaults on the loan. We will be a position to take over the SBA loan, and with additional funds added, convert this location to a profitable Pasta House Co. franchise restaurant.
The location is only 1/4 of a mile away from Gravois Bluff’s, the largest land moving project to put in a major shopping complex in the state of Missouri. The rent is half the retail shops in Gravois Bluff’s, yet the location offers the same opportunity for sales. The recently completed highway 141 offers hundreds of thousands of local residents, shoppers from outside the area, and travelers that use this new highway. With this high concentration of customers there are no Italian restaurants in Fenton and a tremendous need for an upscale family restaurant that offers items for both the children and adults.
This turnkey operation seats 170 customers and is the perfect size for a PHC family operation. With the current leasehold improvements and quality kitchen equipment it would take very little to upgrade this operation to the legendary PHC winning formula. The growth in numbers of high income families in the Fenton area is projected at over 30%. There is a need for a family fine dining restaurant in the Fenton area. PHC would be the perfect neighborhood restaurant in the perfect neighborhood.
The Pasta House Co. in Fenton will be the second location for Dennis Boldt, who has operated a successful franchise unit in High Ridge, Missouri for 20 years. The Pasta House Co. based out of St. Louis, and now has over 34 successful company and franchise locations in the United States and Mexico.
PHC Fenton will have a prime location, great food, a proven concept, super franchise support, no competition, a senior management and crew, a fantastic neighborhood marketing program, a huge catering base to build on, personalized service in a warm Italian imported grocery store atmosphere, and the support of the community resulting in a highly profitable PHC restaurant in Fenton.
1.1 Mission
The Pasta House Co. mission is to be a full service, family Italian restaurant offering affordable, high quality Italian cuisine inspired by authentic family recipes. Our goal is to provide our customers with an entire dining experience that exceed’s their expectations on every visit. We do this by recommending add-on items that will enhance their dining experience. Our restaurant is clean and the quality is always high.
We value the people who work for us. Quality employees make quality food, keep the restaurant cleaner, give better service, and stay employed longer because they like working at The Pasta House Co. We have found that friendly managers hire friendly crew people and friendly crew people attract customers.
1.2 Objectives
The objective is to purchase the current assets and leasehold improvements of the JD Drews restaurant and convert the existing restaurant to a profitable and successful Pasta House Co. franchise unit. I plan to duplicate the successful formula used at The Pasta House Co., High Ridge location, that I have owned and operated for over 20 years. Using the same strategies and having an in-depth management crew to back me up will ensure outstanding results at this new fast-growing location. My objectives are as follows:
- Provide the highest quality Pasta House Co. food and service that the community has been receiving for over 20 years at the High Ridge location.
- Create an atmosphere where each person can work as a team member, with clear goals and high standards that profit everyone.
- Combine the corporate marketing strategies with my own to build volume quickly.
- First year sales to hit between $1.5 and $2 million with 10% growth in first few years.
- High Gross margins.
- Maintain food and labor costs consistent with High Ridge.
- Maintain and expand my outstanding reputation.
- Remain a neighborhood family restaurant.
- Be the first fine dining Italian Restaurant in Fenton (the fastest growing community in Missouri).
1.3 Keys to Success
- The Pasta House Co. name and reputation is well known in the St. Louis area. The food served is voted a St. Louis favorite every year.
- The products we serve are of the highest quality. We combine this quality with great service and atmosphere. We then add menu items that appeal to all ages of the family as well as single adults.
- Current management staff and crew has a great deal of experience.
- Location, Location, Location! Some people have named the intersection of Hwy 30 and 141 “The Golden Circle”. Fenton is the fastest growing community in the entire state of Missouri!
- This shopping center location is three years old. Every spot in the center is filled and the main anchor is a Dierbergs grocery store, the highest quality grocery chain in the area.
- This location offers private rooms on a reservation basis. I have developed the bulk food and catering large parties concept at my other location and plan to promote it with the party rooms.
- A frequent diner program and birthday club will be available to promote repeat customers as well as a tool to track sales.
- Management that treats every employee equally. We create an atmosphere where employee’s love coming to work and can earn good money.
- Great employees make for a great restaurant.
Company Summary
The Pasta House Co. in High Ridge has been very successfully serving the High Ridge and Fenton area for 20 years. We have sponsored 25 little league ball teams, donated to thousands of events, worked with schools and churches in Fenton to better the community, catered thousands of events in the area, and hired and worked with hundreds of young people, adults, and their families. Topic 5.3.1, Sales Forecast shows our tremendous yearly sales growth rate over the last 20 years. This year is on track to be another record year.
Our “Frequent Diner Program” is in place at High Ridge with over 6,000 customers who frequent the churches. This loyalty program rewards customers with a $25.00 Gift Certificate when they spend $250.00, as well as a Birthday and Anniversary cards to celebrate a meal with us. The program has been a huge success for the past three years, rewarding customers and insuring future repeat business. Ask anyone who lives in Fenton and you will find we have developed quite a reputation in the community.
The Pasta House Co. was founded in 1974, and they have built it to 34 locations in Missouri, Illinois, Kentucky, Mexico, and The Dominican Republic.

The Fenton restaurant will reflect the intimate charm of an Italian Grocery Store with framed Italian prints and Italian American pop art. Both the menu and ambiance will appeal to an upscale customer as well as the entire family.
Below are the current PHC company owned locations:
- 15601 Manchester Rd., Ellisville, MO. 63011
- 8213 Delmar, University City, MO 63124
- 300 Crestwood Plaza, Crestwood, MO 63126
- 11202 West Florissant Rd., Florissant, MO 63033
- 280 Northwest Plaza, St. Ann, MO 63043
- 6214 South Lindbergh, St. Louis, MO 63123
- 14 St. Louis Galleria, Richmond Heights, MO 63117
Below are the PHC franchise owned locations:
- 1245 East Main, Carbondale, IL. 62901
- 1020 Lincoln Ave., Jacksonville, IL. 62650
- 12 Chesterfield Mall, Chesterfield, MO 63017
- 12445 Dorsett Rd., Maryland Heights, MO 63043
- 6570 North Illinois St., Fairview Heights, IL 62208
- 180 East Center Dr., Alton, IL 62002
- 1623 Big Bill Road, Arnold, MO 63010
- 9012 Gravois Rd., St. Louis, MO 63123
- 3985 South Service Road, St. Peters, MO 63376
- 4517 Highway 30, High Ridge, MO 63049
- 309 North Euclid, St. Louis, MO 63108
- Concourse D. 10701 Lambert Int’l Airport, St. Louis, Mo
- 700 N. Ballas Rd., St. Louis, MO 63141
- 2800 Southwest Plaza Drive, Springfield, IL 62704
- 300 South 44th St., Mt. Vernon, IL 62864
- 205 Kentucky Oaks Mall, Paducah, KY 42001
- 4204 Highway 54, Osage Beach, MO 65065
- 155 West Park Mall, Cape Giradeau, MO 63701
- 931 Valley Creek Dr., Farmington, MO 63640
- 1100 Knipp St., Columbia, MO 65203
- 318 East Washington, Belleville, IL 62221
- 4109 S. National, Springfield, MO 65804
- Ens Naco, Santa Domingo, R.D. Dominican Republic
- St. Louis University Campus
Franchise restaurants are independent franchisees of The Pasta House Company Franchises, Inc. The above franchise restaurants are each independently owned and operated.
2.1 Company Ownership
The existing Pasta House Co. franchise in High Ridge is owned and operated by Dennis and Janice Boldt, with Dennis acting as President. It was established in 1983 under Delex Corporation DBA/The Pasta House Co. in Gravois Village Center, High Ridge, Missouri.
The proposed Fenton franchise would be also owned and operated by Dennis and Janice Boldt, with Dennis acting as President and Janice as Secretary/Treasurer. The new location will operate under the name Delex Corp. (second location)DBA/ The Pasta House Co. Fenton.
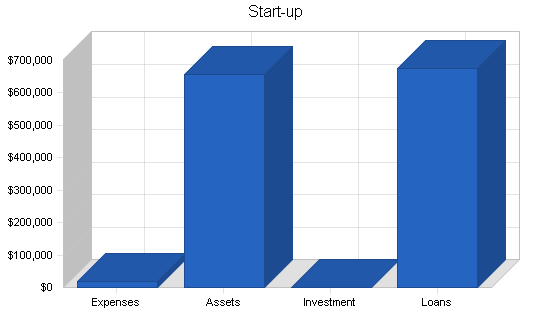
2.2 Start-up Summary
The JD Drews facility would come with all equipment, food, liquor, leasehold improvements, employees, and management staff.
We would assume the current SBA loan of $325,000, and start-up expense of $350,000. With cash input of interest-free loans from three different parties totaling $75,000, the loan balance using an SBA secured loan would be $600,000 at 9.5% interest over a 15 year term.
As assets to secure the loan we would put up Delex Corp. dba The Pasta House Co. 4517 Gravois Village Center in High Ridge, and our home if needed.
A starting bank account of $90,000 will be used, only if needed, for unexpected costs associated with the start up.
Start-up equipment list would include the following items: (quality used equipment will be purchase whenever possible to control costs, and then, only if equipment is in like-new condition)
- Twenty quart Hobart mixer
- Steam kettle
- Refrigerated 4 drawer system
- Refrigerated 2 drawer system
- Pizza box refrigerated stand alone box
- Dessert display case
- Eight-burner commercial gas stove
- Commercial Parmesan cheese grinder
- Meat slicer
- Flip top refrigerated 6-foot saute’ box
- Stand up Freezer
- Kitchen and dining room smallwares
- Less trade-in or sale of used equipment not needed in the current operations.
| Start-up | |
| Requirements | |
| Start-up Expenses | |
| Expensed Items | $0 |
| Smallwares | $3,000 |
| Liquor License | $400 |
| Crew and Manger Training at High Ridge | $10,000 |
| Advertising | $1,000 |
| Insurance Deposits | $3,000 |
| Other Expensed Items | $0 |
| Total Start-up Expenses | $17,400 |
| Start-up Assets | |
| Cash Required | $90,000 |
| Start-up Inventory | $10,000 |
| Other Current Assets | $10,000 |
| Long-term Assets | $547,600 |
| Total Assets | $657,600 |
| Total Requirements | $675,000 |
| Start-up Funding | |
| Start-up Expenses to Fund | $17,400 |
| Start-up Assets to Fund | $657,600 |
| Total Funding Required | $675,000 |
| Assets | |
| Non-cash Assets from Start-up | $567,600 |
| Cash Requirements from Start-up | $90,000 |
| Additional Cash Raised | $0 |
| Cash Balance on Starting Date | $90,000 |
| Total Assets | $657,600 |
| Liabilities and Capital | |
| Liabilities | |
| Current Borrowing | $0 |
| Long-term Liabilities | $600,000 |
| Accounts Payable (Outstanding Bills) | $0 |
| Other Current Liabilities (interest-free) | $75,000 |
| Total Liabilities | $675,000 |
| Capital | |
| Planned Investment | |
| Owner | $0 |
| Investor | $0 |
| Additional Investment Requirement | $0 |
| Total Planned Investment | $0 |
| Loss at Start-up (Start-up Expenses) | ($17,400) |
| Total Capital | ($17,400) |
| Total Capital and Liabilities | $657,600 |
| Total Funding | $675,000 |
Services
The Pasta House menu offers around 30 pasta varieties and 15 specialty chicken, veal, and seafood entries, along with an assortment of appetizers, sandwiches and salads, including the famous “special salad” served in unlimited refills. It serves an interesting variety of wines, cocktails, and desserts to complement each meal. A sample menu is appended to this business plan.
Working with the freshest ingredients, imported pasta, and top quality cuts of meat, The Pasta House Co. owes a great deal of its successful menu to its purveyors such as Middendorf Meats, Joe Fazio’s Bakery, DiMare’s Specialty Foods, Louisa Foods, Allen Foods, Paramount Liquor, Grey Eagle Distributors, Lohr Distributors, and Coca-Cola.
The menu also offers several “Mangia Bene” items that provide the same generous portions and quality flavors as the regular menu, but with low-fat, low-calorie, low-cholesterol benefits.
A fun children’s menu for ages 12 and under features “Mr. Meatball,”a cartoon character who suggests favorites like spaghetti and meatball pizza, and toasted ravioli in portions just right for smaller appetites.
In an effort to provide dining patrons with new tastes in Italian cuisine, The Pasta House Co. works on an ongoing basis to improve existing dishes and to develop new menu items that appeal to today’s increasing number of consumers who insist on consistently high-quality, good tasting Italian fare with authentic “old country” flavor.
As a full service fine dining menu we offer a full array of mixed drinks, beers and wines. With a full bar area The Pasta House Co. offers a place where young adults, families, and singles to enjoy a drink while waiting for a to-go, waiting for a table, or a friendly place to meet and talk before dinner. We are a family array business and have never been known as a “Bar”. There will be no “Late-night Drinking Crowd” as this is not part of our customer base.
Market Analysis Summary
The Fenton area has 48 restaurants which include:
- 18 Fast Food/Pizza/Sub Restaurants
- 11 Sports bars/Up Scale Burger Restaurants
- 2 Barbecue Restaurants
- 6 Chinese Restaurants
- 5 Banquet/Catering Operations
- 4 Breakfast/Lunch Restaurants
- 1 Upscale Full Service Restaurant (O’Charles opened 2002)
Source: 1998/2003 Market Statistics Estimates, Scan/US, Inc. (800)272-2687
The need for another fine dining family restaurant in the Fenton
The marketing plan is to provide a fine dining, full service, family restaurant, where the entire family can enjoy a great meal, at a reasonable price. The Pasta House Co. restaurant is the perfect neighborhood restaurant, where adults and children can always find their favorite dish, and receive consistent quality and great service.
With the addition of the new Gravois Bluff’s shopping complex less than 1/4 of a mile away, this addition will bring more customers and families from all over St. Louis to shop and eat in the area. The market customers for The Pasta House Co. would develop from:
- Local Neighborhood Marketing Program
- Customer Frequent Diner Loyalty Program
- Suggestive Selling Program to increase average check
- Birthday and Anniversary marketing mailings
- Market saturation and community outreach programs
- PHC High Ridge successfully serving customer in the community for over 20 years
- PHC is known in St. Louis since 1974
- High shopping in the area
- Tremendous growth in upper level family income
4.1 Market Segmentation
The market analysis table shows that within a three mile circle 98% are families. This is our customer base which we cater to.
The table below shows the tremendous growth of the Fenton area. Please take note the greater increase in income levels the greater the projected growth levels. The chart shows the potential upper income families who enjoy eating out.
One Mile Ring of Intersection Hwy 141 at Hwy 30, Fenton, Missouri:
| Households by Income | 1998 | 2003 | Change | Percent |
| $40,000 – $49,999 | 4,778 | 4,297 | -481 | -10.1% |
| $50,000 – $$59,000 | 4,922 | 4,776 | -146 | -3.0% |
| $60,000 – $74,999 | 5,711 | 6,404 | 693 | +12.1% |
| $75,000 – $99,999 | 7,275 | 7,941 | 666 | +9.2% |
| $100,000 – $124,999 | 4,341 | 5,471 | 1,130 | +26.0% |
| $125,000 – $149,999 | 2,175 | 2,865 | 690 | +31.7% |
| $150,000 – AND UP | 2,397 | 3,856 | 1,459 | +60.9% |
Source: 1998/2003 Market Statistics Estimates, Scan/US, Inc. (800)272-2687

| Market Analysis | |||||||
| Year 1 | Year 2 | Year 3 | Year 4 | Year 5 | |||
| Potential Customers | Growth | CAGR | |||||
| Population in Families | 5% | 113,793 | 119,710 | 125,935 | 132,484 | 139,373 | 5.20% |
| Population in Non-families | 5% | 13,698 | 14,410 | 15,159 | 15,947 | 16,776 | 5.20% |
| Population in Group Quarters | 5% | 1,348 | 1,415 | 1,486 | 1,560 | 1,638 | 4.99% |
| Total | 5.20% | 128,839 | 135,535 | 142,580 | 149,991 | 157,787 | 5.20% |
4.2 Target Market Segment Strategy
Our focus is the upper income level families living and shopping in the area. The Pasta House Co. will focus on the income level of at least $60,000 and above, and the 98% families living and shopping in the area.
We focus on these specific groups because these are the types of people who frequent The Pasta House Co. They are the ones that are willing to spend their money on good dining and service at a value price.
4.3 Service Business Analysis
In the St. Louis market the competition for the upper level income business has been intense. national chains that were not here 10 years ago have poured into St. Louis. The number of new restaurants has increased dramatically over the last several years and should continue to expand, all with the intent of capturing a portion of the upper level market. Below is a list of new and expanding restaurants in St. Louis:
- Macaroni Grill
- Dave & Buster’s
- Hard Rock Cafe
- Hooters
- Lone Star Steak House
- Max & Erma’s
- Outback Steak House
- Ruby Tuesday
- St. Louis Bread Company
- Bandana
- Chevy’s
- Friday’s
- O’Macaroni
- Olive Garden
- California Pizza Kitchen
- Tippins (out of business December 2002)
- Chili’s
- Crazy Fish (Closed July 2003)
- Red Robin (Opened July 2002)
- The Cheese Cake Factory (Opened November 2002)
- Smoky Bones (Opened January 2003)
- P. F. Chang’s (Opened December 2002)
In the year 2002 McDonald’s no longer held the title as having the most locations in the United States. There are now more Subway restaurants in the U.S. than McDonald’s. Many of the above restaurant chains will find the St. Louis area a very competitive market. The restaurants that are still standing several years from now will be the ones who provided customers with the best product, at the best price and consistently exceeded their customers expectations. The Pasta House Co. will be a major player in St. Louis no matter what players are still around.
4.3.1 Competition and Buying Patterns
PHC High Ridge: Owned and Operated by Dennis Boldt for 20 years. (Sister Store to Fenton)
Located only four miles away this Pasta House Co. location is in Jefferson County and seems to be outside the normal traffic patterns of the customers who live in the Fenton area. Increases in business have shown a steady growth and should continue. We have found that over 90% of our customers come from west, south and east of the store. Because the store is located in Jefferson County, most customers who live in Fenton do not travel west towards rural Jefferson County. With our Frequent Diner customer base we estimate a loss in business from the customers who would go to the new location would be about 5% of sales. This would be only a short lived loss as the entire area is growing at an tremendous rate.
O’Charles: Opened in 2002, Located 1/4 of a mile away in the new Gravois Bluffs Shopping Center
O’Charles has a better location with a free standing building in the new Gravois Bluff’s Shopping Center. They offer a full service fine dining family atmosphere. This national chain offers a complete menu of items, including a children’s menu. The inside of the restaurant is very nice, with fine woods and a warm atmosphere. Local community involvent is limited. They seem to market towards adults more than children. Given the choice, kids will choose Pasta House every time. Un-tested long term growth and management abilities.
Red Robin: Opened in 2002, Located 1/4 of a mile away in the new Gravois Bluffs Shopping Center
Red Robin is an up-scale burger restaurant with a big name and big look inside. It took over two years to open this store because of franchise problems. Food items are served in plastic baskets, this concept is more of an up-scale fast food establishment than a fine dining concept. Limited adult menu, lots of noise, high priced drinks, no local marketing, and lack of a long-term track record in St. Louis all limit this restaurant as real competition.
Smoky Bones: To Open in 2003 in the Gravois Bluffs Shopping Center
This is a new concept restaurant and is backed by the Red Lobster Corporation. Not a lot is known about this restaurant expect they have a big name behind them and a great free standing location. Limited menu, no local marketing, and lack of a long-term track record also limit this restaurant as real competition.
Strategy and Implementation Summary
Every customer who has eaten at a Pasta House Co. is a potential customer. The better we run this Pasta House location the more business we will do. Customers will know that they can get better quality PHC food at this location. They will know that the service is better, and the people are better. The look of the new location will be fresh and clean. The area needs a fine dining family restaurant. The area needs an big name local operation with a home-grown name like The Pasta House Co.
5.1 Competitive Edge
This is what gives us the competitive edge to insure a profitable home-grown expansion:
- Proven Pasta House Co. concept since 1974
- Proven track record of PHC High Ridge serving the area for over 20 years
- Best home-grown training in the industry
- Senior PHC High Ridge management and crew to open with
- Local marketing in all age ranges
- Known costs with purchase of an turnkey restaurant
- Current staff and management from JD Drew’s
- Close and strong support of PHC President and Senior Management
- Strong food and supply vendors with very high quality products
- On-going support from PHC Corporation
5.2 Marketing Strategy
We at The Pasta House Co., including all management, crew personnel, supervisors, vendors, design people, family and friends, and new hires will put forth 100% effort to insure a profitable opening and on-going operations.
A fine tuned advertising campaign and new store opening has been developed by The Pasta House Co. president Kim Tucci. Construction is handled by Joe Fresta who has built and opened over 31 location.
5.3 Sales Strategy
The sales strategy is to sign up as many frequent diner customers as possible at the new location as well as High Ridge. Using the Frequent Diner Program in place a High Ridge for three years, we plan to further cement the loyal customers in the area. We will honor 6,000 club members with points at both locations.
We plan on taking advantage of The Pasta House Co. market saturation in St. Louis. We will build and expand on that customer base by exceeding customers expectations. This will bring back old customers and bring in new customers to the Fenton location.
We plan on up-selling customers with our current suggestive selling program. From the hostess to the waiters and waitress our staff has successfully increased the average check for add-on sales from 5% of the average check three years ago to over 13%. This insures an increase in profit without having to depend on an increase in customer counts or price increases.
5.3.1 Sales Forecast
A sales forecast of 5.0% increase in volume over the current High Ridge location is based on the following:
- Increased visibility and known area of St. Louis. Everyone knows where Fenton is, and few know where High Ridge is located.
- Increased traffic flow with the intersection of Highways 141 and 30, with over double the traffic in the area.
- Increased customers staying in the area to shop. Two major shopping centers compared to a 20 year old strip center.
- Increased retail employee business.
- 26% larger space inside, with 30% more customer seating.
- Outside seating area during the spring through fall seasons increases the seating by 60% over HR.
- Brand new PHC look inside.
- Private rooms available, to cater private parties.
- Closer to the eight hotels in the area.
- Better location closer to St. Louis, where the action is.
Below is a list of the sales volume showing the sales increase in The Pasta House Co. High Ridge from 1984 to 2002:
| 2003 | est $1,633,349 |
| 2002 | $1,575,900 |
| 2001 | $1,555,866 |
| 2000 | $1,521,927 |
| 1999 | $1,354,347 |
| 1998 | $1,232,094 |
| 1997 | $1,160,898 |
| 1996 | $1,140,184 |
| 1995 | $1,167,583 |
| 1994 | $1,094,791 |
| 1993 | $1,061,775 |
| 1992 | $988,664 |
| 1991 | $912,302 |
| 1990 | $840,152 |
| 1989 | $817,058 |
| 1988 | $780,510 |
| 1987 | $714,808 |
| 1986 | $703,269 |
| 1985 | $685,232 |
| 1984 | $651,897 |
| Sales Forecast | |||
| Year 1 | Year 2 | Year 3 | |
| Sales | |||
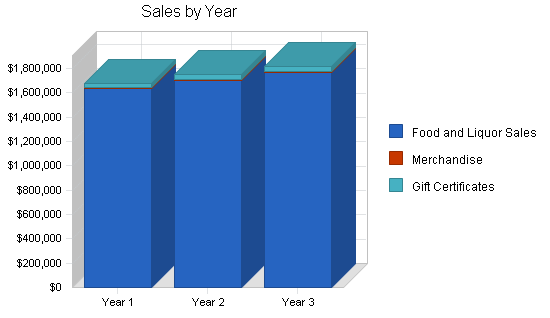
| Food and Liquor Sales | $1,638,070 | $1,703,593 | $1,771,737 |
| Merchandise | $5,478 | $5,533 | $5,588 |
| Gift Certificates | $37,700 | $38,831 | $39,996 |
| Total Sales | $1,681,248 | $1,747,957 | $1,817,321 |
| Direct Cost of Sales | Year 1 | Year 2 | Year 3 |
| Sales + Merchandise at 25.7% | $421,053 | $429,474 | $438,064 |
| Other | $0 | $0 | $0 |
| Subtotal Direct Cost of Sales | $421,053 | $429,474 | $438,064 |
5.4 Milestones
I have full confidence in all of the managers, designers, and PHC people who will make this a huge success.
DENNIS BOLDT
- SBA loan and Business Plan
- Bank Account
- Franchise Purchase
- Legal and review of Lease
- Equipment Purchase
- Sign Purchases and install
- Software POS system install
- Corporation set up, Insurance, Deposits, Liquor License
- PHC Design Work with Joe Fresta of The Pasta House Co.
- Oversee entire transformation and operations of the group
VINCE LARATTA
- Crew and manager hiring and training
- New equipment installed
- Food & liquor purchases delivery and stocking
- Crew and manager scheduling
- Maintenance and repairs
- Advertising
JAN BOLDT/CAROLYN FINCH AND COMPANY (team of 6 designers from Tulsa, OK)
- PHC design work walls and floors design with Joe Fresta of PHC
- Shelving and displays in place
- Design of dining room look
- Record keeping of purchases and budget
- Permits, liquor licenses, start up requirements paperwork
Joe Fresta, Vice President of The Pasta House Co.
- PHC design work and construction work
- Oversee display of dining room
- Oversee kitchen equipment purchase and layout
- Advise owner when needed

| Milestones | |||||
| Milestone | Start Date | End Date | Budget | Manager | Department |
| Purchase of PHC Franchise | 3/1/2003 | 3/3/2003 | $50,000 | Dennis | Owner |
| Kitchen Equipment Purchase | 1/1/2003 | 1/15/2003 | $16,000 | Dennis & Vince | GM |
| Set up Bank Account | 1/1/2003 | 1/2/2003 | $90,000 | Dennis | Owner |
| Purchase of Smallwares | 1/1/2003 | 1/5/2003 | $3,000 | Vince | Web |
| Signs Purchase | 1/17/2003 | 1/22/2003 | $10,000 | Dennis | Owner |
| Product Displays | 2/25/2003 | 2/28/2003 | $2,000 | PHC Corp Office | Corporate Office |
| Apply Liquor Licence ETC | 1/6/2003 | 1/9/2003 | $400 | Dennis | Owner |
| Corporation Start-up Fees | 1/4/2003 | 1/10/2003 | $1,500 | Dennis | Owner |
| Attorney’s Fees Paid | 2/1/2003 | 2/26/2003 | $5,000 | Dennis | Owner |
| Set up Insurance & Deposits | 2/19/2003 | 2/22/2003 | $3,000 | Dennis | Owner |
| First Month Rent Deposit | 3/1/2003 | 3/1/2003 | $9,500 | Dennis | Owner |
| Set up Office/ Computer | 3/10/2003 | 3/14/2003 | $1,300 | Vince | GM |
| Install Kitchen Equipment | 3/2/2003 | 3/7/2003 | $2,000 | Denise | MGT |
| Food & Liquor in Place | 3/9/2003 | 3/13/2003 | $300 | Denise | MGT |
| Food and Liquor Ordered | 3/8/2003 | 3/8/2003 | $7,000 | Denise | MGT |
| Advertizing Opening | 2/20/2003 | 2/20/2003 | $1,000 | Vince | GM |
| Crew Training MGRs at HR | 1/10/2003 | 4/15/2003 | $10,000 | Janet | HIGH RIDGE PHC |
| Pay and Install Software POS System | 3/1/2003 | 3/5/2003 | $6,500 | Dennis | Owner |
| Construction PHC | 3/1/2003 | 3/5/2003 | $23,000 | Joe Fresta | VP PASTA HOUSE |
| Walls and Floors by Finch Inc. | 3/6/2003 | 3/9/2003 | $8,000 | Jan & Carolyn | DESIGN TEAM |
| Opening Night Trial Run | 3/15/2003 | 3/15/2003 | $500 | All | ENTIRE TEAM |
| Totals | $250,000 | ||||
Web Plan Summary
The Pasta House Co. corporation has a website at www.pastahouse.com. In the year 2004 we plan on setting up a website for PHC High Ridge and PHC Fenton that will be linked to the corporate website. Using their format our site will include information about our local franchise units, however we plan on expanding the marketing of using a website by customers and the crew.
In this age of communication more and more customers look to a website for information and assistance in purchasing products. We will be part of that great communication tool used by everyone everyday.
6.1 Website Marketing Strategy
Marketing in an Internet retail business depends on recognition for expertise. It starts with our existing store front customer base, informing them of our Internet presence and encouraging their word-of-mouth recommendations to others. As linked to www.pastahouse.com corporate website our local customer can come to our site for a more local flavor and personal assistance for their needs.
We will develop and maintain a database of our 6,000 loyalty Frequent Diner customers. From there the website will serve the following needs of our customer base.
- Provide local information about our PHC locations to the local community
- New customers can sign up for our frequent diner/birthday programs
- Customers can check their Frequent Diner points online
- Catering information and contacts provided
- Provide references and pictures of successful catering jobs
- With a special password, crew can check their schedule on a moment’s notice
- Purchase Gift Certificates from our stores
- Purchase the new Gift Cards
- Purchase retail items on line and have them shipped as gifts
- Gift Basket information (Gift Baskets are sold at High Ridge and Fenton location only)
- Employment information online
- Company wide promotions and new store openings
- Promotional coupons online
- Provide new food items in the restaurant
- General information on other events in the area
6.2 Development Requirements
Because corporate PHC has a website, I plan on working very closely with their Web designer. Each year the best websites are posted at www.techtv.com. Using this source will enable me to enhance our website to a simple but very effective tool to increase sales at the retail level. Development of the site will change based on our customers needs now and in the future as new ideas come forward for using this communication tool.
Management Summary
The management team to run the day-to-day operations and shifts at the new location will include Dennis Boldt, Vince Laratta, Denise Shaw, an additional dining room manager, and a kitchen manager, both to be named closer to the opening date. The High Ridge managers will include, Dennis Boldt, Janet Boxx, two new managers and a kitchen manager to be named later.
People are the single most important element in our operations
We value the managers and staff as the single most important element in running a quality operation; the managers need to be all on the same page of operations. We have found that friendly strong managers make friendly strong crew people. From that crew comes the next generation of managers and a quality operation. The customers can see it in the quality of the food, how clean the store is and how friendly and fast they are served. In the past 19 years we have had eight crew people go on to become managers at other Pasta House locations and other restaurants. We also have a deep bench to select our management team from. The current JD Drews store also has managers that I have been told are doing a fine job. We will consider them as manager candidates and make decisions based on the best interests of the restaurant. Below is our management game plan:
FENTON MANAGEMENT STAFF
DENNIS BOLDT, PRESIDENT/OWNER OPERATOR
- Owner Operator of The Pasta House Co. franchise located in High Ridge since 1983
- Duties: strategic development, back-office administration, financial analysis, internal control, taxes and accounting records, payroll, daily operations, quality control, advertising, food costs, labor costs, liquor cost, oversee management controls, maintenance and repairs, and building the business profits.
VINCE LARATTA, GENERAL MANAGER
- General Manager of The Pasta House Co. High Ridge for 15 years. Before that Vince worked as a waiter at several Pasta House locations.
- Duties: daily operations, new management development, scheduling, ordering, food, labor, and liquor controls, quality controls, maintenance/repairs, crew training, employment, crew’s hourly wages, pay increases, and overall store operations.
DENICE SHAW, DINING ROOM MANAGER/KITCHEN MANAGER
- Kitchen Manager of The Pasta House Co. High Ridge for 4 years Denise has recently completed training, been promoted to Dining Room manager and has been running shifts for the past year. On her fifth year as a manager Denise has a real talent for dealing with all aspects of the business.
- Duties: daily operations, ordering, inventory, quality controls, kitchen procedures, labor and food costs controls, scheduling, new hires, crew moral, and overall kitchen operations. Denise will use her experience to train and oversee the new kitchen manager coming on board.
HIGH RIDGE MANAGEMENT STAFF
DENNIS BOLDT, OWNER OPERATOR/PRESIDENT
- Dennis will work 2-3 shifts per week as the manager on duty at High Ridge until management staff can be trained and cover the shifts.
JANET BOXX, GENERAL manager PHC HIGH RIDGE
- Kitchen crew person, kitchen manager, Dining Room manager, and general manager for The Pasta House Co. for 13 years. Janet has done a fine job at PHC High Ridge as a manager for the past eight years. One of Janet’s strengths is her ability to deal with people. Because of Janet and her people skills we have lost very few crew people to other locations.
- Duties: daily operations, scheduling, ordering, food, labor, and liquor controls, quality controls, crew training, employment, and overall store operations.
POSSIBLE EMPLOYEES TO PROMOTE TO MANAGEMENT (not in any order)
Al Fillenwarth, waiter PHC High Ridge 16 years. Al has his Masters Degree in accounting and is recognized as a leader among the crew.
Ryan Mulligan, lead cook for High Ridge for six years. Presently working with the State of Missouri and wants to get back into the restaurant business as a kitchen manager.
Janet Koth, manager for High Ridge for 10 years is presently going to school part time and working at another restaurant. Janet was a fine manager for me for four years before she and her sister opened their own kitchen in central Missouri.
Sara Armstrong, PHC High Ridge kitchen employee for three years, Sara went on to work at several other restaurants and is currently the kitchen manager of another restaurant. Sara has 10 years of kitchen experience and would be considered for the kitchen manager position if she is interested.
Anna Minney, PHC employee for 16 years, has worked as our secretary at High Ridge for the past five years. Anna has the respect of the crew as a manager and knows all aspects of the operation.
Steve Bewig, PHC lead cook at High Ridge has excellent cooking skills and would make a fine kitchen manager.
Bill Hobbs, current manager JD Drews
- Bill has been the dining room manager for JD Drews for the past three years and has worked with the owner for the past seven years. Bill comes highly recommended as a manager.
Ron Caputa, dining room manager JD Drews
Ron has been the dining room manager for the past three years and comes highly dining room from the current owner.
As we get closer to opening the management personnel will firm up with the above candidates and others the may come into the picture. We will not promote a person who is not right for the position. Shifts will be covered with current candidates staff at both locations until the right person can be promoted. The entire candidates staff must act as a solid team.
7.1 Personnel Plan
Management fixed costs at the Fenton location are as follows:
- Dennis Boldt @ $30,000
- Vince Laratta @ $60,000
- Denise Shaw @$39,000
- Dining Room Manager @ $32,000
- Kitchen Manager @ $25,000
- Total Management Costs $186,000
Management Team at High Ridge
- Dennis Boldt
- Janet Boxx
- Dining Room Manager
- Dining Room Manager
- Kitchen Manager
Kitchen labor at both locations would be 11.3% of sales.
Dining Room labor at both locations would be 6.1% of sales.
Payroll taxes 10% of sales.
| Personnel Plan | |||
| Year 1 | Year 2 | Year 3 | |
| Management Salaries based on $186,000 | $186,000 | $228,968 | $235,837 |
| Kitchen Labor at 11.3% of Sales | $185,604 | $198,211 | $204,157 |
| Dining Room Labor at 6.1% of Sales | $99,834 | $101,601 | $104,649 |
| Total People | 65 | 67 | 70 |
| Total Payroll | $471,438 | $528,780 | $544,643 |
Financial Plan
- Growth will be moderate, cash flows steady.
- Sales increase at a steady rate of 4% per year.
- Costs will increase at a rate of 1% to 2% per year.
- The company will invest residual profits into financial markets and not company expansion (unless absolutely necessary).
- General maintenance and repairs will be kept up to maintain a solid operation.
- Future cash investments will use NPV projections to achieve maximum return with limited risk.
8.1 Important Assumptions
The financial plan depends on important assumptions, most of which are shown in the following table as annual figures. The key underlying assumptions are:
- We assume JD Drews will be unable to make their note payment or lease payment and will have to default on their loans.
- We assume that we will take over the SBA note payment and acquire all of the assets and leasehold improvements.
- We assume the equipment is in good working order.
- We assume this will happen in the next three to six months.
- We assume a slow-growth economy, without major recession.
- We assume that there are no unforseen changes in the expectancy in the popularity of our candidates.
- We assume access to loans and financing are sufficient to maintain and fulfill our financial plan as shown in the tables.
- We assume the landlord will have no problem allowing us to take over the current lease.
- We assume The Pasta House Co. will approve our leasehold improvements and budget.
| General Assumptions | |||
| Year 1 | Year 2 | Year 3 | |
| Plan Month | 1 | 2 | 3 |
| Current Interest Rate | 5.50% | 5.50% | 5.50% |
| Long-term Interest Rate | 9.50% | 9.50% | 9.50% |
| Tax Rate | 22.03% | 21.30% | 22.03% |
| Other | 0 | 0 | 0 |
8.2 Projected Profit and Loss
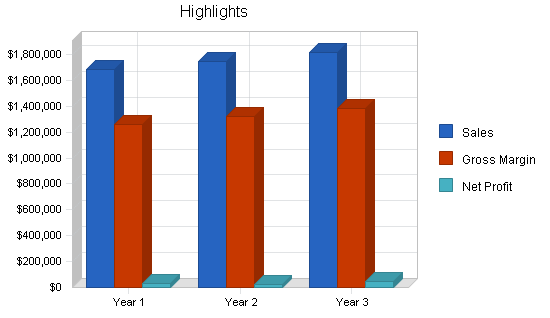
The most important assumption in the Projected Profit and Loss statement is the gross margin. Although it doesn’t jump drastically in the first year, over time the restaurant will develop its customer base and reputation and the growth will pick up more rapidly towards the fourth and fifth years of business.
Month-by-month assumptions for profit and loss are included in the appendix.


| Pro Forma Profit and Loss | |||
| Year 1 | Year 2 | Year 3 | |
| Sales | $1,681,248 | $1,747,957 | $1,817,321 |
| Direct Cost of Sales | $421,053 | $429,474 | $438,064 |
| Other Costs of Goods | $0 | $0 | $0 |
| Total Cost of Sales | $421,053 | $429,474 | $438,064 |
| Gross Margin | $1,260,195 | $1,318,483 | $1,379,257 |
| Gross Margin % | 74.96% | 75.43% | 75.90% |
| Expenses | |||
| Payroll | $471,438 | $528,780 | $544,643 |
| Sales and Marketing Promotions | $0 | $0 | $0 |
| Depreciation | $66,144 | $66,144 | $66,144 |
| Credit Card Discounts | $21,692 | $21,930 | $22,172 |
| Royality & Advertising Fees | $104,142 | $105,288 | $106,446 |
| Rent Fixed Rate with Cam | $112,200 | $113,434 | $114,682 |
| Utilities 2.4% of Sales | $40,350 | $40,794 | $41,243 |
| Insurance | $35,304 | $35,692 | $36,085 |
| Paper Costs | $30,262 | $32,881 | $36,169 |
| Coupons | $158,555 | $160,299 | $162,062 |
| Trash Disposal | $1,500 | $1,517 | $1,533 |
| Uniforms | $3,000 | $3,033 | $3,066 |
| Telephone | $3,000 | $3,033 | $3,066 |
| Maintaince & Repairs | $13,500 | $13,649 | $13,799 |
| Smallwares | $1,500 | $1,517 | $1,533 |
| Outside Services | $3,000 | $3,033 | $3,066 |
| Cleaning & Dishwashing | $11,769 | $11,898 | $12,029 |
| Menus & Guest Checks | $1,200 | $1,213 | $1,227 |
| Linen & Laundry | $1,500 | $1,517 | $1,533 |
| Music & Entertainment | $1,500 | $1,517 | $1,533 |
| Advertising | $1,500 | $1,517 | $1,533 |
| Over/Short | ($180) | ($182) | ($184) |
| Professional Fees | $4,500 | $4,550 | $4,600 |
| Taxes & Licenses | $1,980 | $2,002 | $2,024 |
| Bank Charges | $936 | $946 | $957 |
| Pest Control | $1,500 | $1,517 | $1,533 |
| Payroll Taxes | $70,716 | $79,317 | $81,696 |
| Office Expense | $3,900 | $0 | $0 |
| Other | $2,100 | $2,123 | $2,146 |
| Total Operating Expenses | $1,168,508 | $1,238,956 | $1,266,337 |
| Profit Before Interest and Taxes | $91,687 | $79,527 | $112,920 |
| EBITDA | $157,831 | $145,671 | $179,064 |
| Interest Expense | $56,050 | $53,200 | $50,667 |
| Taxes Incurred | $7,868 | $5,607 | $13,711 |
| Net Profit | $27,769 | $20,719 | $48,542 |
| Net Profit/Sales | 1.65% | 1.19% | 2.67% |
8.3 Projected Cash Flow
The cash flow depends on assumptions for inventory turnover, payment days, and accounts receivable management. Our projected same-day collections is critical, and is reasonable and customary in the restaurant industry. We do not expect to need significant additional support even when we reach the less profitable months, as they are expected. The first six months of PHC openings have shown huge sales volumes. We expect this volume, however our projections do not reflect this high volume. We have done this in the event there is normal sales during the first six months.
Month-by-month assumptions for projected cash flow are included in the appendix.

| Pro Forma Cash Flow | |||
| Year 1 | Year 2 | Year 3 | |
| Cash Received | |||
| Cash from Operations | |||
| Cash Sales | $1,681,248 | $1,747,957 | $1,817,321 |
| Subtotal Cash from Operations | $1,681,248 | $1,747,957 | $1,817,321 |
| Additional Cash Received | |||
| Sales Tax, VAT, HST/GST Received | $0 | $0 | $0 |
| New Current Borrowing | $0 | $0 | $0 |
| New Other Liabilities (interest-free) | $0 | $0 | $0 |
| New Long-term Liabilities | $0 | $0 | $0 |
| Sales of Other Current Assets | $0 | $0 | $0 |
| Sales of Long-term Assets | $0 | $0 | $0 |
| New Investment Received | $0 | $0 | $0 |
| Subtotal Cash Received | $1,681,248 | $1,747,957 | $1,817,321 |
| Expenditures | Year 1 | Year 2 | Year 3 |
| Expenditures from Operations | |||
| Cash Spending | $471,438 | $528,780 | $544,643 |
| Bill Payments | $1,053,685 | $1,135,251 | $1,157,087 |
| Subtotal Spent on Operations | $1,525,123 | $1,664,031 | $1,701,730 |
| Additional Cash Spent | |||
| Sales Tax, VAT, HST/GST Paid Out | $0 | $0 | $0 |
| Principal Repayment of Current Borrowing | $0 | $0 | $0 |
| Other Liabilities Principal Repayment | $7,500 | $7,500 | $7,500 |
| Long-term Liabilities Principal Repayment | $26,664 | $26,664 | $26,664 |
| Purchase Other Current Assets | $0 | $0 | $0 |
| Purchase Long-term Assets | $0 | $0 | $0 |
| Dividends | $0 | $0 | $0 |
| Subtotal Cash Spent | $1,559,287 | $1,698,195 | $1,735,894 |
| Net Cash Flow | $121,961 | $49,761 | $81,426 |
| Cash Balance | $211,961 | $261,723 | $343,149 |
8.4 Projected Balance Sheet
The projected Balance Sheet is quite solid. We do not anticipate difficulty meeting our debt obligations providing that we achieve our specific goals.
| Pro Forma Balance Sheet | |||
| Year 1 | Year 2 | Year 3 | |
| Assets | |||
| Current Assets | |||
| Cash | $211,961 | $261,723 | $343,149 |
| Inventory | $39,382 | $44,187 | $45,071 |
| Other Current Assets | $10,000 | $10,000 | $10,000 |
| Total Current Assets | $261,344 | $315,909 | $398,219 |
| Long-term Assets | |||
| Long-term Assets | $547,600 | $547,600 | $547,600 |
| Accumulated Depreciation | $66,144 | $132,288 | $198,432 |
| Total Long-term Assets | $481,456 | $415,312 | $349,168 |
| Total Assets | $742,800 | $731,221 | $747,387 |
| Liabilities and Capital | Year 1 | Year 2 | Year 3 |
| Current Liabilities | |||
| Accounts Payable | $91,595 | $93,462 | $95,250 |
| Current Borrowing | $0 | $0 | $0 |
| Other Current Liabilities | $67,500 | $60,000 | $52,500 |
| Subtotal Current Liabilities | $159,095 | $153,462 | $147,750 |
| Long-term Liabilities | $573,336 | $546,672 | $520,008 |
| Total Liabilities | $732,431 | $700,134 | $667,758 |
| Paid-in Capital | $0 | $0 | $0 |
| Retained Earnings | ($17,400) | $10,369 | $31,088 |
| Earnings | $27,769 | $20,719 | $48,542 |
| Total Capital | $10,369 | $31,088 | $79,629 |
| Total Liabilities and Capital | $742,800 | $731,221 | $747,387 |
| Net Worth | $10,369 | $31,088 | $79,629 |
8.5 Business Ratios
We expect our net profit margin, and gross margin to increase steadily over the three-years. Our net working capital will increase by year three, proving that we have the cash flows to remain a going concern. The following table shows these important financial ratios. Industry profile ratios based on the Standard Industrial Classification (SIC) code 5812.0108, Italian restaurant, are shown for comparison.
| Ratio Analysis | ||||
| Year 1 | Year 2 | Year 3 | Industry Profile | |
| Sales Growth | 0.00% | 3.97% | 3.97% | 6.96% |
| Percent of Total Assets | ||||
| Inventory | 5.30% | 6.04% | 6.03% | 3.90% |
| Other Current Assets | 1.35% | 1.37% | 1.34% | 28.39% |
| Total Current Assets | 35.18% | 43.20% | 53.28% | 37.68% |
| Long-term Assets | 64.82% | 56.80% | 46.72% | 62.32% |
| Total Assets | 100.00% | 100.00% | 100.00% | 100.00% |
| Current Liabilities | 21.42% | 20.99% | 19.77% | 19.17% |
| Long-term Liabilities | 77.19% | 74.76% | 69.58% | 29.21% |
| Total Liabilities | 98.60% | 95.75% | 89.35% | 48.38% |
| Net Worth | 1.40% | 4.25% | 10.65% | 51.62% |
| Percent of Sales | ||||
| Sales | 100.00% | 100.00% | 100.00% | 100.00% |
| Gross Margin | 74.96% | 75.43% | 75.90% | 59.31% |
| Selling, General & Administrative Expenses | 72.17% | 73.20% | 72.15% | 39.09% |
| Advertising Expenses | 0.00% | 0.00% | 0.00% | 2.75% |
| Profit Before Interest and Taxes | 5.45% | 4.55% | 6.21% | 1.59% |
| Main Ratios | ||||
| Current | 1.64 | 2.06 | 2.70 | 1.26 |
| Quick | 1.40 | 1.77 | 2.39 | 0.87 |
| Total Debt to Total Assets | 98.60% | 95.75% | 89.35% | 54.38% |
| Pre-tax Return on Net Worth | 343.69% | 84.68% | 78.18% | 3.27% |
| Pre-tax Return on Assets | 4.80% | 3.60% | 8.33% | 7.17% |
| Additional Ratios | Year 1 | Year 2 | Year 3 | |
| Net Profit Margin | 1.65% | 1.19% | 2.67% | n.a |
| Return on Equity | 267.81% | 66.65% | 60.96% | n.a |
| Activity Ratios | ||||
| Inventory Turnover | 10.91 | 10.28 | 9.82 | n.a |
| Accounts Payable Turnover | 12.50 | 12.17 | 12.17 | n.a |
| Payment Days | 27 | 30 | 30 | n.a |
| Total Asset Turnover | 2.26 | 2.39 | 2.43 | n.a |
| Debt Ratios | ||||
| Debt to Net Worth | 70.64 | 22.52 | 8.39 | n.a |
| Current Liab. to Liab. | 0.22 | 0.22 | 0.22 | n.a |
| Liquidity Ratios | ||||
| Net Working Capital | $102,249 | $162,448 | $250,469 | n.a |
| Interest Coverage | 1.64 | 1.49 | 2.23 | n.a |
| Additional Ratios | ||||
| Assets to Sales | 0.44 | 0.42 | 0.41 | n.a |
| Current Debt/Total Assets | 21% | 21% | 20% | n.a |
| Acid Test | 1.40 | 1.77 | 2.39 | n.a |
| Sales/Net Worth | 162.14 | 56.23 | 22.82 | n.a |
| Dividend Payout | 0.00 | 0.00 | 0.00 | n.a |
Appendix
| Sales Forecast | |||||||||||||
| Month 1 | Month 2 | Month 3 | Month 4 | Month 5 | Month 6 | Month 7 | Month 8 | Month 9 | Month 10 | Month 11 | Month 12 | ||
| Sales | |||||||||||||
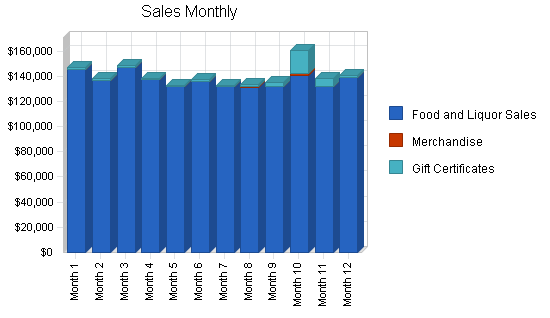
| Food and Liquor Sales | 0% | $145,423 | $136,320 | $146,746 | $137,040 | $131,500 | $135,784 | $131,500 | $131,445 | $131,500 | $140,241 | $131,500 | $139,071 |
| Merchandise | 0% | $201 | $492 | $287 | $157 | $69 | $177 | $230 | $750 | $750 | $1,578 | $550 | $237 |
| Gift Certificates | 0% | $1,200 | $1,100 | $1,500 | $900 | $1,050 | $1,300 | $950 | $1,500 | $2,400 | $18,500 | $6,000 | $1,300 |
| Total Sales | $146,824 | $137,912 | $148,533 | $138,097 | $132,619 | $137,261 | $132,680 | $133,695 | $134,650 | $160,319 | $138,050 | $140,608 | |
| Direct Cost of Sales | Month 1 | Month 2 | Month 3 | Month 4 | Month 5 | Month 6 | Month 7 | Month 8 | Month 9 | Month 10 | Month 11 | Month 12 | |
| Sales + Merchandise at 25.7% | $37,425 | $35,160 | $37,787 | $34,488 | $33,795 | $34,941 | $33,795 | $33,974 | $33,644 | $36,447 | $33,795 | $35,802 | |
| Other | $0 | $0 | $0 | $0 | $0 | $0 | $0 | $0 | $0 | $0 | $0 | $0 | |
| Subtotal Direct Cost of Sales | $37,425 | $35,160 | $37,787 | $34,488 | $33,795 | $34,941 | $33,795 | $33,974 | $33,644 | $36,447 | $33,795 | $35,802 | |
| Personnel Plan | |||||||||||||
| Month 1 | Month 2 | Month 3 | Month 4 | Month 5 | Month 6 | Month 7 | Month 8 | Month 9 | Month 10 | Month 11 | Month 12 | ||
| Management Salaries based on $186,000 | 0% | $15,500 | $15,500 | $15,500 | $15,500 | $15,500 | $15,500 | $15,500 | $15,500 | $15,500 | $15,500 | $15,500 | $15,500 |
| Kitchen Labor at 11.3% of Sales | 0% | $16,591 | $15,459 | $16,614 | $15,503 | $14,859 | $15,363 | $14,859 | $14,938 | $14,793 | $16,025 | $14,859 | $15,741 |
| Dining Room Labor at 6.1% of Sales | 0% | $8,870 | $8,315 | $8,951 | $8,359 | $8,021 | $8,282 | $8,021 | $8,018 | $7,939 | $8,554 | $8,021 | $8,483 |
| Total People | 65 | 65 | 65 | 65 | 65 | 65 | 65 | 65 | 65 | 65 | 65 | 65 | |
| Total Payroll | $40,961 | $39,274 | $41,065 | $39,362 | $38,380 | $39,145 | $38,380 | $38,456 | $38,232 | $40,079 | $38,380 | $39,724 | |
| General Assumptions | |||||||||||||
| Month 1 | Month 2 | Month 3 | Month 4 | Month 5 | Month 6 | Month 7 | Month 8 | Month 9 | Month 10 | Month 11 | Month 12 | ||
| Plan Month | 1 | 2 | 3 | 4 | 5 | 6 | 7 | 8 | 9 | 10 | 11 | 12 | |
| Current Interest Rate | 5.50% | 5.50% | 5.50% | 5.50% | 5.50% | 5.50% | 5.50% | 5.50% | 5.50% | 5.50% | 5.50% | 5.50% | |
| Long-term Interest Rate | 9.50% | 9.50% | 9.50% | 9.50% | 9.50% | 9.50% | 9.50% | 9.50% | 9.50% | 9.50% | 9.50% | 9.50% | |
| Tax Rate | 30.00% | 21.30% | 21.30% | 21.30% | 21.30% | 21.30% | 21.30% | 21.30% | 21.30% | 21.30% | 21.30% | 21.30% | |
| Other | 0 | 0 | 0 | 0 | 0 | 0 | 0 | 0 | 0 | 0 | 0 | 0 | |
| Pro Forma Profit and Loss | |||||||||||||
| Month 1 | Month 2 | Month 3 | Month 4 | Month 5 | Month 6 | Month 7 | Month 8 | Month 9 | Month 10 | Month 11 | Month 12 | ||
| Sales | $146,824 | $137,912 | $148,533 | $138,097 | $132,619 | $137,261 | $132,680 | $133,695 | $134,650 | $160,319 | $138,050 | $140,608 | |
| Direct Cost of Sales | $37,425 | $35,160 | $37,787 | $34,488 | $33,795 | $34,941 | $33,795 | $33,974 | $33,644 | $36,447 | $33,795 | $35,802 | |
| Other Costs of Goods | $0 | $0 | $0 | $0 | $0 | $0 | $0 | $0 | $0 | $0 | $0 | $0 | |
| Total Cost of Sales | $37,425 | $35,160 | $37,787 | $34,488 | $33,795 | $34,941 | $33,795 | $33,974 | $33,644 | $36,447 | $33,795 | $35,802 | |
| Gross Margin | $109,399 | $102,752 | $110,746 | $103,609 | $98,824 | $102,320 | $98,885 | $99,721 | $101,006 | $123,872 | $104,255 | $104,806 | |
| Gross Margin % | 74.51% | 74.51% | 74.56% | 75.03% | 74.52% | 74.54% | 74.53% | 74.59% | 75.01% | 77.27% | 75.52% | 74.54% | |
| Expenses | |||||||||||||
| Payroll | $40,961 | $39,274 | $41,065 | $39,362 | $38,380 | $39,145 | $38,380 | $38,456 | $38,232 | $40,079 | $38,380 | $39,724 | |
| Sales and Marketing Promotions | $0 | $0 | $0 | $0 | $0 | $0 | $0 | $0 | $0 | $0 | $0 | $0 | |
| Depreciation | $5,512 | $5,512 | $5,512 | $5,512 | $5,512 | $5,512 | $5,512 | $5,512 | $5,512 | $5,512 | $5,512 | $5,512 | |
| Credit Card Discounts | $2,056 | $2,056 | $1,931 | $2,079 | $1,933 | $1,857 | $1,922 | $1,858 | $1,872 | $1,885 | $2,244 | $0 | |
| Royality & Advertising Fees | $9,293 | $8,708 | $9,435 | $8,829 | $8,094 | $8,686 | $8,218 | $8,546 | $7,426 | $10,272 | $7,723 | $8,912 | |
| Rent Fixed Rate with Cam | $9,350 | $9,350 | $9,350 | $9,350 | $9,350 | $9,350 | $9,350 | $9,350 | $9,350 | $9,350 | $9,350 | $9,350 | |
| Utilities 2.4% of Sales | $3,524 | $3,310 | $3,565 | $3,314 | $3,183 | $3,294 | $3,184 | $3,209 | $3,232 | $3,848 | $3,313 | $3,375 | |
| Insurance | $2,942 | $2,942 | $2,942 | $2,942 | $2,942 | $2,942 | $2,942 | $2,942 | $2,942 | $2,942 | $2,942 | $2,942 | |
| Paper Costs | $2,643 | $2,482 | $2,674 | $2,486 | $2,387 | $2,471 | $2,388 | $2,407 | $2,424 | $2,886 | $2,485 | $2,531 | |
| Coupons | $14,178 | $14,178 | $14,307 | $13,361 | $12,354 | $13,238 | $12,480 | $12,815 | $12,690 | $13,673 | $11,722 | $13,559 | |
| Trash Disposal | $125 | $125 | $125 | $125 | $125 | $125 | $125 | $125 | $125 | $125 | $125 | $125 | |
| Uniforms | $250 | $250 | $250 | $250 | $250 | $250 | $250 | $250 | $250 | $250 | $250 | $250 | |
| Telephone | $250 | $250 | $250 | $250 | $250 | $250 | $250 | $250 | $250 | $250 | $250 | $250 | |
| Maintaince & Repairs | $1,125 | $1,125 | $1,125 | $1,125 | $1,125 | $1,125 | $1,125 | $1,125 | $1,125 | $1,125 | $1,125 | $1,125 | |
| Smallwares | $125 | $125 | $125 | $125 | $125 | $125 | $125 | $125 | $125 | $125 | $125 | $125 | |
| Outside Services | $250 | $250 | $250 | $250 | $250 | $250 | $250 | $250 | $250 | $250 | $250 | $250 | |
| Cleaning & Dishwashing | $1,028 | $965 | $1,040 | $967 | $928 | $961 | $929 | $936 | $943 | $1,122 | $966 | $984 | |
| Menus & Guest Checks | $100 | $100 | $100 | $100 | $100 | $100 | $100 | $100 | $100 | $100 | $100 | $100 | |
| Linen & Laundry | $125 | $125 | $125 | $125 | $125 | $125 | $125 | $125 | $125 | $125 | $125 | $125 | |
| Music & Entertainment | $125 | $125 | $125 | $125 | $125 | $125 | $125 | $125 | $125 | $125 | $125 | $125 | |
| Advertising | $125 | $125 | $125 | $125 | $125 | $125 | $125 | $125 | $125 | $125 | $125 | $125 | |
| Over/Short | ($15) | ($15) | ($15) | ($15) | ($15) | ($15) | ($15) | ($15) | ($15) | ($15) | ($15) | ($15) | |
| Professional Fees | $375 | $375 | $375 | $375 | $375 | $375 | $375 | $375 | $375 | $375 | $375 | $375 | |
| Taxes & Licenses | $165 | $165 | $165 | $165 | $165 | $165 | $165 | $165 | $165 | $165 | $165 | $165 | |
| Bank Charges | $78 | $78 | $78 | $78 | $78 | $78 | $78 | $78 | $78 | $78 | $78 | $78 | |
| Pest Control | $125 | $125 | $125 | $125 | $125 | $125 | $125 | $125 | $125 | $125 | $125 | $125 | |
| Payroll Taxes | 10% | $6,144 | $5,891 | $6,160 | $5,904 | $5,757 | $5,872 | $5,757 | $5,768 | $5,735 | $6,012 | $5,757 | $5,959 |
| Office Expense | 15% | $325 | $325 | $325 | $325 | $325 | $325 | $325 | $325 | $325 | $325 | $325 | $325 |
| Other | $175 | $175 | $175 | $175 | $175 | $175 | $175 | $175 | $175 | $175 | $175 | $175 | |
| Total Operating Expenses | $101,458 | $98,496 | $101,808 | $97,935 | $94,649 | $97,155 | $94,890 | $95,626 | $94,184 | $101,409 | $94,223 | $96,675 | |
| Profit Before Interest and Taxes | $7,941 | $4,256 | $8,938 | $5,674 | $4,175 | $5,165 | $3,995 | $4,095 | $6,822 | $22,463 | $10,032 | $8,131 | |
| EBITDA | $13,453 | $9,768 | $14,450 | $11,186 | $9,687 | $10,677 | $9,507 | $9,607 | $12,334 | $27,975 | $15,544 | $13,643 | |
| Interest Expense | $4,750 | $4,750 | $4,750 | $4,750 | $4,724 | $4,697 | $4,671 | $4,644 | $4,618 | $4,592 | $4,565 | $4,539 | |
| Taxes Incurred | $957 | ($105) | $892 | $197 | ($117) | $100 | ($144) | ($117) | $469 | $3,807 | $1,164 | $765 | |
| Net Profit | $2,234 | ($389) | $3,296 | $728 | ($432) | $368 | ($532) | ($432) | $1,734 | $14,065 | $4,302 | $2,827 | |
| Net Profit/Sales | 1.52% | -0.28% | 2.22% | 0.53% | -0.33% | 0.27% | -0.40% | -0.32% | 1.29% | 8.77% | 3.12% | 2.01% | |
| Pro Forma Cash Flow | |||||||||||||
| Month 1 | Month 2 | Month 3 | Month 4 | Month 5 | Month 6 | Month 7 | Month 8 | Month 9 | Month 10 | Month 11 | Month 12 | ||
| Cash Received | |||||||||||||
| Cash from Operations | |||||||||||||
| Cash Sales | $146,824 | $137,912 | $148,533 | $138,097 | $132,619 | $137,261 | $132,680 | $133,695 | $134,650 | $160,319 | $138,050 | $140,608 | |
| Subtotal Cash from Operations | $146,824 | $137,912 | $148,533 | $138,097 | $132,619 | $137,261 | $132,680 | $133,695 | $134,650 | $160,319 | $138,050 | $140,608 | |
| Additional Cash Received | |||||||||||||
| Sales Tax, VAT, HST/GST Received | 0.00% | $0 | $0 | $0 | $0 | $0 | $0 | $0 | $0 | $0 | $0 | $0 | $0 |
| New Current Borrowing | $0 | $0 | $0 | $0 | $0 | $0 | $0 | $0 | $0 | $0 | $0 | $0 | |
| New Other Liabilities (interest-free) | $0 | $0 | $0 | $0 | $0 | $0 | $0 | $0 | $0 | $0 | $0 | $0 | |
| New Long-term Liabilities | $0 | $0 | $0 | $0 | $0 | $0 | $0 | $0 | $0 | $0 | $0 | $0 | |
| Sales of Other Current Assets | $0 | $0 | $0 | $0 | $0 | $0 | $0 | $0 | $0 | $0 | $0 | $0 | |
| Sales of Long-term Assets | $0 | $0 | $0 | $0 | $0 | $0 | $0 | $0 | $0 | $0 | $0 | $0 | |
| New Investment Received | $0 | $0 | $0 | $0 | $0 | $0 | $0 | $0 | $0 | $0 | $0 | $0 | |
| Subtotal Cash Received | $146,824 | $137,912 | $148,533 | $138,097 | $132,619 | $137,261 | $132,680 | $133,695 | $134,650 | $160,319 | $138,050 | $140,608 | |
| Expenditures | Month 1 | Month 2 | Month 3 | Month 4 | Month 5 | Month 6 | Month 7 | Month 8 | Month 9 | Month 10 | Month 11 | Month 12 | |
| Expenditures from Operations | |||||||||||||
| Cash Spending | $40,961 | $39,274 | $41,065 | $39,362 | $38,380 | $39,145 | $38,380 | $38,456 | $38,232 | $40,079 | $38,380 | $39,724 | |
| Bill Payments | $4,309 | $128,009 | $91,374 | $101,127 | $88,851 | $88,566 | $93,315 | $88,136 | $90,305 | $89,307 | $103,186 | $87,199 | |
| Subtotal Spent on Operations | $45,270 | $167,283 | $132,439 | $140,489 | $127,231 | $127,711 | $131,695 | $126,592 | $128,537 | $129,386 | $141,566 | $126,923 | |
| Additional Cash Spent | |||||||||||||
| Sales Tax, VAT, HST/GST Paid Out | $0 | $0 | $0 | $0 | $0 | $0 | $0 | $0 | $0 | $0 | $0 | $0 | |
| Principal Repayment of Current Borrowing | $0 | $0 | $0 | $0 | $0 | $0 | $0 | $0 | $0 | $0 | $0 | $0 | |
| Other Liabilities Principal Repayment | $625 | $625 | $625 | $625 | $625 | $625 | $625 | $625 | $625 | $625 | $625 | $625 | |
| Long-term Liabilities Principal Repayment | $0 | $0 | $0 | $0 | $3,333 | $3,333 | $3,333 | $3,333 | $3,333 | $3,333 | $3,333 | $3,333 | |
| Purchase Other Current Assets | $0 | $0 | $0 | $0 | $0 | $0 | $0 | $0 | $0 | $0 | $0 | $0 | |
| Purchase Long-term Assets | $0 | $0 | $0 | $0 | $0 | $0 | $0 | $0 | $0 | $0 | $0 | $0 | |
| Dividends | $0 | $0 | $0 | $0 | $0 | $0 | $0 | $0 | $0 | $0 | $0 | $0 | |
| Subtotal Cash Spent | $45,895 | $167,908 | $133,064 | $141,114 | $131,189 | $131,669 | $135,653 | $130,550 | $132,495 | $133,344 | $145,524 | $130,881 | |
| Net Cash Flow | $100,929 | ($29,996) | $15,469 | ($3,017) | $1,430 | $5,592 | ($2,973) | $3,145 | $2,155 | $26,975 | ($7,474) | $9,727 | |
| Cash Balance | $190,929 | $160,932 | $176,401 | $173,384 | $174,814 | $180,406 | $177,432 | $180,578 | $182,733 | $209,708 | $202,234 | $211,961 | |
| Pro Forma Balance Sheet | |||||||||||||
| Month 1 | Month 2 | Month 3 | Month 4 | Month 5 | Month 6 | Month 7 | Month 8 | Month 9 | Month 10 | Month 11 | Month 12 | ||
| Assets | Starting Balances | ||||||||||||
| Current Assets | |||||||||||||
| Cash | $90,000 | $190,929 | $160,932 | $176,401 | $173,384 | $174,814 | $180,406 | $177,432 | $180,578 | $182,733 | $209,708 | $202,234 | $211,961 |
| Inventory | $10,000 | $41,168 | $38,676 | $41,566 | $37,937 | $37,175 | $38,435 | $37,175 | $37,371 | $37,008 | $40,092 | $37,175 | $39,382 |
| Other Current Assets | $10,000 | $10,000 | $10,000 | $10,000 | $10,000 | $10,000 | $10,000 | $10,000 | $10,000 | $10,000 | $10,000 | $10,000 | $10,000 |
| Total Current Assets | $110,000 | $242,096 | $209,608 | $227,966 | $221,321 | $221,989 | $228,841 | $224,607 | $227,949 | $229,741 | $259,800 | $249,409 | $261,344 |
| Long-term Assets | |||||||||||||
| Long-term Assets | $547,600 | $547,600 | $547,600 | $547,600 | $547,600 | $547,600 | $547,600 | $547,600 | $547,600 | $547,600 | $547,600 | $547,600 | $547,600 |
| Accumulated Depreciation | $0 | $5,512 | $11,024 | $16,536 | $22,048 | $27,560 | $33,072 | $38,584 | $44,096 | $49,608 | $55,120 | $60,632 | $66,144 |
| Total Long-term Assets | $547,600 | $542,088 | $536,576 | $531,064 | $525,552 | $520,040 | $514,528 | $509,016 | $503,504 | $497,992 | $492,480 | $486,968 | $481,456 |
| Total Assets | $657,600 | $784,184 | $746,184 | $759,030 | $746,873 | $742,029 | $743,369 | $733,623 | $731,453 | $727,733 | $752,280 | $736,377 | $742,800 |
| Liabilities and Capital | Month 1 | Month 2 | Month 3 | Month 4 | Month 5 | Month 6 | Month 7 | Month 8 | Month 9 | Month 10 | Month 11 | Month 12 | |
| Current Liabilities | |||||||||||||
| Accounts Payable | $0 | $124,975 | $87,989 | $98,164 | $85,904 | $85,450 | $90,380 | $85,124 | $87,344 | $85,849 | $100,288 | $84,040 | $91,595 |
| Current Borrowing | $0 | $0 | $0 | $0 | $0 | $0 | $0 | $0 | $0 | $0 | $0 | $0 | $0 |
| Other Current Liabilities | $75,000 | $74,375 | $73,750 | $73,125 | $72,500 | $71,875 | $71,250 | $70,625 | $70,000 | $69,375 | $68,750 | $68,125 | $67,500 |
| Subtotal Current Liabilities | $75,000 | $199,350 | $161,739 | $171,289 | $158,404 | $157,325 | $161,630 | $155,749 | $157,344 | $155,224 | $169,038 | $152,165 | $159,095 |
| Long-term Liabilities | $600,000 | $600,000 | $600,000 | $600,000 | $600,000 | $596,667 | $593,334 | $590,001 | $586,668 | $583,335 | $580,002 | $576,669 | $573,336 |
| Total Liabilities | $675,000 | $799,350 | $761,739 | $771,289 | $758,404 | $753,992 | $754,964 | $745,750 | $744,012 | $738,559 | $749,040 | $728,834 | $732,431 |
| Paid-in Capital | $0 | $0 | $0 | $0 | $0 | $0 | $0 | $0 | $0 | $0 | $0 | $0 | $0 |
| Retained Earnings | ($17,400) | ($17,400) | ($17,400) | ($17,400) | ($17,400) | ($17,400) | ($17,400) | ($17,400) | ($17,400) | ($17,400) | ($17,400) | ($17,400) | ($17,400) |
| Earnings | $0 | $2,234 | $1,845 | $5,141 | $5,868 | $5,437 | $5,805 | $5,273 | $4,841 | $6,575 | $20,640 | $24,942 | $27,769 |
| Total Capital | ($17,400) | ($15,166) | ($15,555) | ($12,259) | ($11,532) | ($11,963) | ($11,595) | ($12,127) | ($12,559) | ($10,825) | $3,240 | $7,542 | $10,369 |
| Total Liabilities and Capital | $657,600 | $784,184 | $746,184 | $759,030 | $746,873 | $742,029 | $743,369 | $733,623 | $731,453 | $727,733 | $752,280 | $736,377 | $742,800 |
| Net Worth | ($17,400) | ($15,166) | ($15,555) | ($12,259) | ($11,532) | ($11,963) | ($11,595) | ($12,127) | ($12,559) | ($10,825) | $3,240 | $7,542 | $10,369 |


